How to turn mobility promises into daily reliability: an operational playbook for dispatch leaders
Every shift you contend with driver shortages, late pickups, and weather or traffic snarls. You don’t need another dashboard of hype—you need an actionable plan with SOPs, escalation paths, and guardrails that stop problems from reaching senior leadership. This playbook clusters questions into five operational lenses—ROI governance, reliability & scenarios, data integrity, adoption, and execution discipline—so you have a repeatable process to maintain stability during peak and off-hours.
Explore Further
Operational Framework & FAQ
ROI foundations, governance & KPI discipline
Defines credible ROI constructs, baseline definitions, governance ownership, and KPI discipline to prevent disputes and ensure measurable, repeatable value delivery.
For our employee transport and corporate car rentals, what should a solid ROI case include beyond cost per trip so Finance, HR, and Ops all agree on what “success” means?
B0032 What belongs in ROI case — In India corporate employee mobility services (EMS) and corporate car rental (CRD), what does a credible “Business Outcomes & ROI” case actually include beyond cost per trip—so a CFO, CHRO, and Transport Head can agree on what success means without arguing about whose numbers are ‘real’?
A credible “Business Outcomes & ROI” case in Indian EMS/CRD defines success as a small, shared set of operational, safety, cost, and ESG outcomes that can all be traced back to auditable trip data, not just to cost-per-trip spreadsheets. It links reliability (OTP, escalations), safety and compliance incidents, total cost of ownership, and employee experience to one governed data set that Finance, HR, and Transport can all query the same way.
A strong outcomes case starts by anchoring on reliability and continuity. The business case specifies target on-time performance, exception detection-to-closure time, and fleet uptime, and ties these to shift-adherence and productivity. It uses command-center data, alert logs, and SLA reports as the single source of truth. This reduces arguments over “whose log is correct” when late-pickup or no-show disputes arise.
Safety and compliance outcomes are then defined in measurable terms. The case tracks incident rate, women-safety protocol adherence, driver credential currency, and audit-trail completeness, with proof from centralized compliance management and safety dashboards. This allows the CHRO and Security/EHS to show duty-of-care and zero-incident posture with evidence instead of anecdotes.
Cost and TCO metrics move beyond per-kilometer rates. The ROI story covers cost per employee trip, dead mileage reduction, vehicle utilization, billing accuracy, and dispute rates. It pulls these from integrated billing systems, indicative management reports, and centralized operations dashboards. This gives the CFO defensible numbers that reconcile with finance systems and audit expectations.
Employee experience and attendance are treated as first-class outcomes. The case includes commute satisfaction scores, complaint closure SLAs, and correlations with attendance or attrition, using app feedback, SOS closure logs, and user satisfaction indices. This lets HR argue for investments using data instead of only qualitative feedback.
ESG and EV benefits are framed with verifiable baselines. The business case quantifies CO₂ reductions, EV utilization, and idle-emission savings using CO₂ dashboards, carbon reduction calculations, and EV fleet-operation reports. This allows ESG leaders and Finance to align on climate impact and to justify EV transition with both emissions and cost-per-kilometer evidence.
To keep all functions aligned, the outcomes case also describes governance and continuity. It specifies how a central command center, escalation matrix, and business continuity plans will keep SLA performance, safety, and cost under control across incidents, weather disruptions, and tech failures. This creates a shared definition of “stable operations” that all three stakeholders can sign off on.
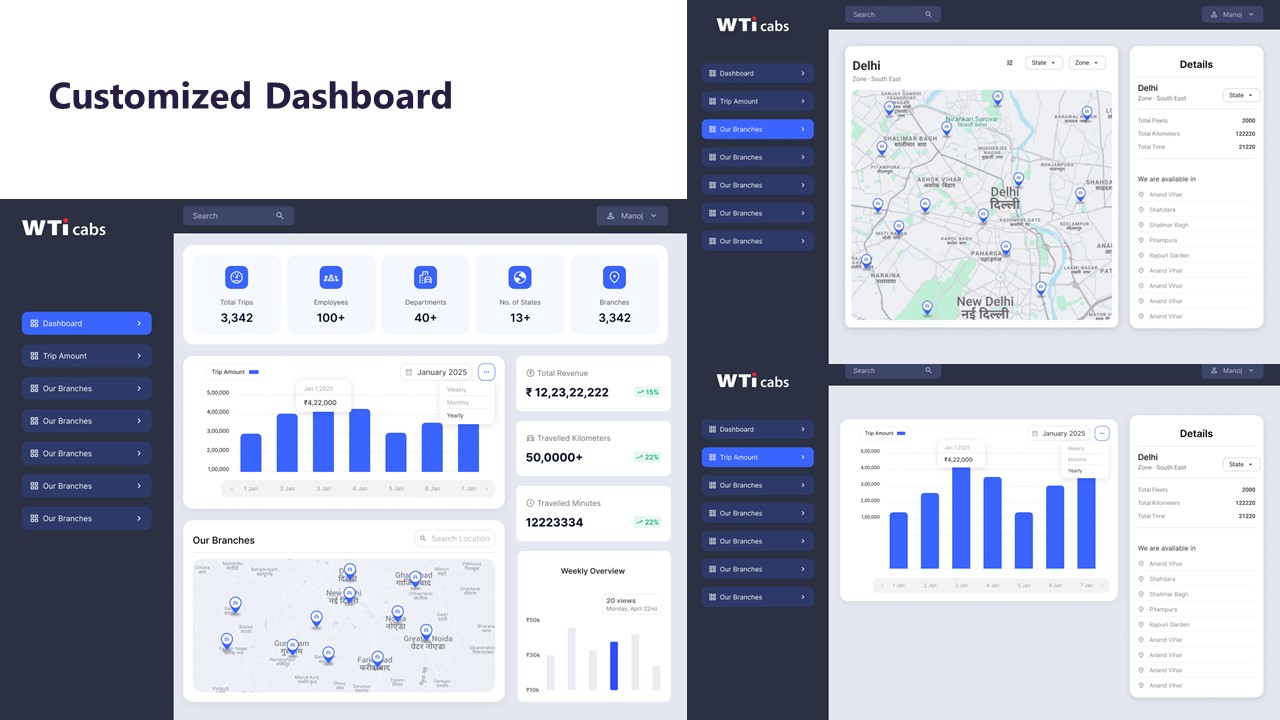
images:
For EMS/ECS, how do we set a baseline that Finance will trust later, so ROI doesn’t look like “paper savings”?
B0034 ROI baseline that Finance trusts — In India corporate employee mobility services (EMS) and project/event commute services (ECS), what are the most defensible ways to define a baseline for ROI (routes, headcount, attendance patterns, and exceptions) so Finance doesn’t call it “made-up savings” six months later?
In Indian employee mobility (EMS) and project/event commute (ECS), the most defensible ROI baselines are built from 3–6 months of pre-change operational data, tied directly to Finance-visible metrics like cost per employee trip, on-time performance, seat-fill, and exception rates. ROI is accepted as “real” when every claimed saving can be traced back to a frozen, auditable baseline that uses data sources Finance already trusts, such as HRMS attendance, vendor invoices, GPS logs, and incident registers.
The starting point is to define a clear “pre-program” period. Most organizations use 3–6 representative months for EMS and 1–2 comparable events or projects for ECS. The baseline should lock in four dimensions. The first dimension is routes and fleet, where teams document shift windows, route counts per day, vehicle types, average dead mileage, and fleet uptime using GPS or trip sheets. The second dimension is headcount and attendance patterns, where HRMS is used to capture eligible employees, actual riders by shift, hybrid WFO/WFH patterns, and no-show rates. The third dimension is cost and billing, where Finance and Procurement reconcile current cost per kilometer, cost per employee trip, minimum guarantee/idle costs, and any ad hoc surcharges across vendors. The fourth dimension is reliability and safety exceptions, where operations and Security list on-time performance, missed or delayed pickups, escalation counts, and safety or compliance incidents.
A common failure mode is to baseline only cost and ignore utilization and exceptions. This leads Finance to question whether savings are just demand shifts rather than efficiency gains. A more defensible method is to baseline unit economics and quality together. For example, cost per employee trip should always be presented alongside Trip Fill Ratio, on-time percentage, and exception closure time. This makes it clear that cost reductions are not achieved by eroding service levels. Another failure mode is to use vendor-reported aggregates with no linkage to HRMS or Finance systems. Finance usually challenges such numbers as “self-certified.” The baseline therefore needs a data lineage map that shows exactly how each KPI is calculated and which system is the source of record.
A practical baseline package that withstands later scrutiny usually includes the following. First is a signed-off baseline report, agreed by Transport, HR, Finance, and Procurement, that freezes the pre-change KPIs for routes, cost, attendance, OTP, and incident volume. Second is a methodology note that documents formulas for each KPI, such as cost per kilometer, cost per employee trip, Trip Fill Ratio, dead mileage, and on-time performance, plus how hybrid attendance assumptions are derived. Third is a source-of-truth table that maps every metric to its system of record, such as HRMS, GPS/telematics, vendor invoices, or ticketing logs, with retention and audit details. Fourth is a variance-exclusion list that pre-defines what will not be counted as “savings,” such as policy-driven headcount reductions or external disruptions, so that ROI conversations stay focused on mobility efficiency rather than business volume changes.
For EMS, route-level baselines are especially important. Transport teams should lock route counts per shift, average seat-fill, and dead mileage caps by timeband and location. This allows later comparisons when dynamic routing or pooling is introduced. For ECS, the emphasis is on event or project templates. Teams baseline “per-event” metrics such as number of buses or cabs deployed, staging time, average delay at start or close, and cost per attendee moved. This reduces arguments later about whether a new execution model truly improved performance or simply served a smaller crowd.
To keep Finance from calling future savings “made up,” organizations also need a transparent change-log. Any policy shifts during the program, such as new eligibility rules or tighter attendance controls, should be logged with dates and expected impact on volume. When ROI is reported after six months, teams can separate policy-driven demand reductions from operations-driven efficiency gains. This separation is vital because Finance will discount savings that appear to come from reduced usage rather than better operations, unless the two are clearly distinguished. Regular joint reviews, where Finance, HR, and Transport look at the same dashboards and variance explanations, further reinforce trust and reduce the perception that numbers are being adjusted to fit a narrative.
Who should own outcomes in our mobility program—HR, Admin/Facilities, or Ops—so escalations don’t turn into blame games and ROI stays credible?
B0035 Outcome ownership and governance — In India corporate ground transportation programs (EMS/CRD/LTR), what governance model usually works best for outcome ownership—HR, Admin/Facilities, or Operations—so incident-driven escalation doesn’t derail the ROI narrative and no function becomes the default scapegoat?
In India corporate ground transportation, outcome ownership works best when HR owns policy and experience, but day‑to‑day performance and incident control sit with a centralized Transport/Admin function operating a governed command‑center model. HR should not run operations, and operations should not be left without HR’s policy cover or Finance/Procurement’s guardrails.
A centralized transport or facilities team is structurally better placed to manage OTP, routing, driver fatigue, vendor SLAs, and command center operations. This aligns with the persona of the Facility/Transport Head as the “operator of daily reliability” who already manages driver shortages, late pickups, app downtime, and weather or traffic disruptions every shift. When this team is formally mandated as the operational owner, it can standardize NOC processes, escalation matrices, and vendor governance across EMS, CRD, ECS, and LTR.
HR’s role works best as policy and duty‑of‑care governance. HR should set commute entitlements, women‑safety rules, night‑shift protocols, and escalation thresholds, and then consume auditable data from transport systems to answer leadership questions on safety, experience, and attendance. This avoids HR becoming the default scapegoat for every routing or driver issue while still allowing HR to be the visible guardian of employee well‑being and employer brand.
Finance and Procurement should remain owners of commercials and contract structure, including outcome‑linked SLAs and penalty/incentive ladders, but they should not be the face of incident management. Their governance focus should be on reconcilable trip data, SLA‑to‑invoice linkage, and vendor lock‑in and data‑ownership clauses, so cost and ROI narratives survive audits even when individual incidents occur.
To avoid any one function becoming a blame sink, most organizations benefit from a formalized shared‑governance model with clearly separated responsibilities:
- HR owns policy, safety standards, and experience metrics.
- Transport/Admin owns execution, command‑center operations, and incident handling.
- Finance/Procurement own contracts, billing integrity, and ROI baselines.
This separation allows incident‑driven escalations to be handled through predefined SOPs and audit trails rather than ad‑hoc blame, while preserving a clean ROI story around reliability, safety, cost per trip, and ESG performance.
If we tie payments to KPIs in a multi-vendor EMS setup, how do we avoid disputes and leakage without pushing vendors into bad behaviors?
B0036 KPI-linked commercials without perverse incentives — In India corporate employee transport (EMS) with multi-vendor aggregation, how should Procurement structure KPI-linked commercials so they reduce billing disputes and leakage without creating perverse incentives that hurt safety, employee experience, or driver behavior?
Procurement should define KPI-linked commercials around a small set of auditable, balanced metrics and then hard-ring‑fence safety and compliance so they are never traded off for cost or OTP. Contracts work best when payouts reward reliable, compliant capacity over time, not just “more trips for less money” in the short term.
Procurement teams typically reduce billing disputes by tying invoices to a canonical trip and roster ledger that is generated from a single governed platform. This ledger should be the only commercial source of truth for trips, no-shows, dead mileage caps, and seat-fill, and it should be visible to vendors and internal stakeholders. Disputes fall when definitions are unambiguous, when HRMS-integrated attendance and routing logic are transparent, and when exception-closure workflows and approvals are recorded in the same system.
A common failure mode is over‑indexing incentives on OTP or cost per km. This often encourages speeding, unsafe shortcuts, and unhealthy driver duty cycles. Safety, women’s night-shift rules, and credentialing should instead sit in a mandatory compliance layer with non‑negotiable thresholds and automatic penalties or suspensions when breached. Outcome-linked commercial levers should then focus on blended indicators such as Trip Adherence Rate, exception resolution time, and complaint-closure SLA, combined with hard incident-free requirements.
To avoid perverse incentives, Procurement can also cap the commercial impact of any single KPI, exclude near-miss safety events from “performance” bonuses, and require periodic route adherence audits. Balanced scorecards that mix reliability, utilization, and experience—with safety and compliance as binary gates rather than tradeable variables—tend to support healthier driver behavior and more stable employee experience in multi-vendor EMS programs.
What does “audit-ready” KPI evidence look like for our mobility dashboards—trip logs, SLA breaches, exceptions, and invoices—so Finance isn’t nervous during audits?
B0038 Audit-ready KPI evidence standard — In India corporate ground transportation (EMS/CRD) where the vendor provides dashboards, what is a practical standard for “audit-ready” KPI evidence (trip logs, SLA breaches, exceptions, and invoice linkage) that reduces CFO anxiety about surprises during internal or statutory audits?
An “audit-ready” KPI evidence standard in Indian corporate ground transport means every SLA metric, trip, and invoice line can be traced back to tamper-evident trip logs with a clear chain-of-custody. It also means exceptions and SLA breaches are systematically captured with time-stamped root cause and closure records so Finance and auditors never see numbers they cannot verify.
An effective standard starts with complete trip lifecycle records. Each trip requires a unique trip ID, GPS-derived start and end times, route trace, distance, and vehicle/driver identifiers. Every OTP%, Trip Adherence Rate, and Cost per km metric must be directly computable from those raw trips. Vendors usually achieve this with telematics dashboards and integrated driver/rider apps that generate immutable trip logs and boarding events.
Invoice linkage is a second non‑negotiable pillar. Every invoice line should reference the underlying trip IDs or defined service packages, with tariff mapping visible in the system. A CFO should be able to sample a line item and see: approved roster, executed trip, SLA status, distance or slab applied, and any penalties or credits. This reduces disputes about dead mileage, no‑shows, or rate application and aligns billing with outcome-based contracts.
Exception and SLA breach handling must be structured, not ad hoc. A practical standard is that all late pickups, safety incidents, GPS outages, and routing deviations are auto-flagged, ticketed, and closed within defined SLAs, with evidence stored. CFOs gain confidence when OTP or incident-rate KPIs in dashboards match the underlying exception logs and when penalty or earnback calculations are transparent.
Finally, the platform should provide exportable, time-bounded reports with stable KPI definitions. Reliability, safety, utilization, cost, and ESG metrics must be calculated using consistent formulas that auditors can review. Role-based access, audit logs for data edits, and API integration with HRMS and finance systems further reduce surprise gaps between operations data and financial books.
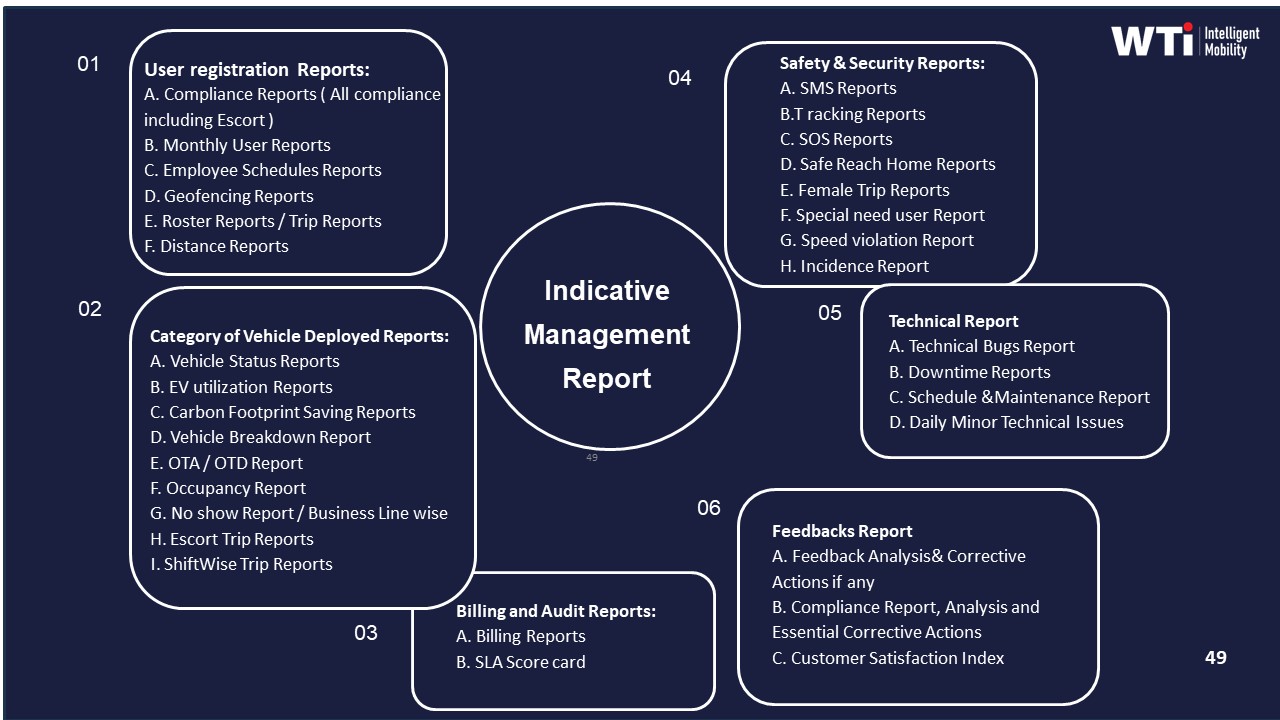
Images:
How can we measure real toil reduction in EMS—less manual routing, rostering, and exception handling—in a way leaders will actually believe?
B0039 Measuring toil reduction credibly — In India corporate employee mobility services (EMS), how can a Transport/Facilities Head quantify ‘toil reduction’ from automation (routing, rostering, exceptions, and NOC monitoring) in a way that leadership accepts as real operational efficiency rather than “soft benefits”?
In Indian employee mobility operations, a Transport or Facilities Head can quantify toil reduction by converting manual effort into hard, time-and-cost numbers tied directly to shift stability, SLA compliance, and reduced escalations. Leadership accepts toil reduction as real efficiency when it is expressed as saved man-hours, lower exception latency, cleaner SLA performance, and fewer high-severity incidents instead of generic claims about “ease of use.”
A practical approach is to baseline current manual work across routing, rostering, exception handling, and NOC monitoring, and then re-measure after automation under the same workload. Each recurring task should be timed, multiplied by frequency per day and per month, and converted into FTE-equivalent hours and cost per month. Exception closure time should be tracked from detection to resolution and compared before and after automated alerts and workflows.
Leadership responds best when toil metrics connect to familiar KPIs such as On-Time Performance percentage, Trip Adherence Rate, and exception detection-to-closure SLAs. Toil reduction is credible when it shows fewer night-shift calls, lower no-show handling effort, and reduced dependence on ad-hoc manual rerouting during disruptions. This evidence is stronger when paired with control-room dashboards that provide auditable logs of automated decisions, escalations, and outcomes.
Useful categories to quantify include:
• Manual planning time: hours per shift previously spent on rostering and route building versus automated routing outputs.
• Exception handling effort: number of alerts per day, average handling time per alert, and percentage handled automatically by predefined workflows.
• NOC monitoring load: number of trips per dispatcher, average interventions per 100 trips, and reduction in after-hours escalations.
• Rework and errors: reduction in duplicate routes, mis-assignments, and last-minute manual corrections that previously required supervisor intervention.
Toil reduction also becomes tangible when it is linked to reduced driver fatigue management overhead, fewer vendor coordination calls, and improved data quality for billing and compliance. When these improvements are presented as a simple before-and-after table with three to six months of data, leadership is more likely to treat them as durable operational gains rather than soft, anecdotal benefits.
For CRD/executive rides, how should we define ROI when the big driver is executive experience, which is sensitive and hard to put into numbers?
B0046 ROI for executive experience — In India corporate car rental (CRD) and executive transport, how should Finance and Admin define ROI when the main driver is “executive experience” (punctuality, vehicle standardization, predictability) that is politically sensitive but hard to quantify?
Finance and Admin should define ROI in executive transport by translating “experience” into a small, stable set of operational and financial KPIs that can be measured per trip and per executive, then linking those KPIs to risk avoided and productivity protected rather than only to direct cost savings. ROI becomes “cost per unit of reliability and risk reduction” instead of “cheapest per km.”
The most practical approach is to anchor executive experience in a few hard metrics. On-time performance for airport and intercity trips, trip adherence rate, exception detection-to-closure time, and vehicle standardization compliance can all be measured from the CRD platform and trip logs. These indicators convert punctuality and predictability into numbers that Finance can track by vendor, city, and executive band.
Admin and Finance can then frame benefits as avoided escalations, reduced contingency costs, and protected executive time. High OTP and route adherence reduce missed flights, last-minute rebookings, and urgent backup vehicle dispatches. Clean audit trails and compliance logs reduce the probability and impact of disputes, safety incidents, or reputational escalations, which is critical where board members or CXOs are riders.
A simple ROI narrative is most credible when it uses unit economics plus risk metrics. Finance can track cost per kilometer and cost per executive trip alongside SLA breach rate, complaint rate, and incident-free trip ratio. The preferred vendor is the one that holds cost within acceptable bands while maintaining near-zero critical failures and minimal noise for leadership, even if the nominal tariff is not the lowest.
Across our mobility services, what’s the minimum KPI set that gives leadership control without creating “KPI theatre” and distrust every month?
B0047 Minimum viable KPI set — In India enterprise mobility programs (EMS/CRD/ECS/LTR), what is a realistic ‘minimum viable KPI set’ that gives executives enough control and early warning signals without turning the program into a monthly KPI theatre that nobody trusts?
A realistic minimum KPI set for enterprise mobility in India tracks reliability, safety/compliance, cost, and experience with 1–2 simple, auditable metrics per pillar. This keeps executives in control with early warning signals without creating a monthly “KPI theatre” that operations teams distrust.
Most organizations benefit from a core reliability KPI that combines on-time performance with exception-closure speed. A single OTP% metric exposes chronic delays and routing issues early, while a basic exception closure SLA shows whether the command center and vendors are actually resolving breakdowns. Trip Adherence Rate can sit behind OTP as an audit check rather than a headline number.
A minimal safety and compliance view usually relies on total incident rate plus a credentialing currency metric. The incident rate surfaces real-world safety and women-safety failures, and credential currency checks that driver KYC/PSV and vehicle documents are not quietly expiring. Both should be backed by tamper-evident GPS and trip logs so Security and HR can reconstruct events when needed.
For cost control, most executives need only cost per employee trip or cost per kilometer plus dead mileage as the early-warning pair. These indicators show whether routing, fleet mix, and vendor behavior are drifting, without demanding complex financial analysis every month. Finance can then drill into billing models and tariff mapping only when one of these two signals moves outside an agreed band.
Experience can be kept lean with a single Commute Experience Index or satisfaction score by corridor or shift band. This exposes pockets of poor experience that HR must act on, without creating survey fatigue. When these four pillars are tracked together on one command-center dashboard, executives get enough signal to intervene, while transport heads avoid being buried under low-value metrics and presentations.
Reliability framework, tier-2 proof & scenario modeling
Outlines how to frame reliability, validate non-metro performance, and use scenario modeling to anticipate peaks and outages with concrete evidence.
In our EMS program, how do we decide what comes first—OTP reliability or cost control—when HR and Finance want different things?
B0033 Reliability vs cost prioritization — In India enterprise-managed ground transportation for shift-based employee mobility (EMS), how should leadership decide whether to prioritize reliability outcomes (OTP/OTD) versus cost outcomes (CET/CPK) when the CHRO is pushing “duty of care + experience” and the CFO is pushing “predictable cost and auditability”?
Leadership in Indian employee mobility should prioritize reliability outcomes like on-time performance (OTP/OTD) above pure cost metrics such as cost per employee trip (CET) and cost per kilometer (CPK) until minimum reliability and safety thresholds are consistently met. Cost optimization only creates sustainable value after a zero-escalation, duty-of-care baseline is operationalized and auditable.
Reliability directly underpins shift adherence, attendance stability, and incident avoidance in EMS. Poor OTP quickly converts into HR escalations, productivity loss, and reputational risk that silently increase total cost. A common failure mode is choosing the lowest CET/CPK vendor without guardrails on service uptime, women-safety protocols, and incident response, which then generates hidden costs in overtime, rebooking, and management firefighting. Leadership should therefore define non-negotiable reliability and safety SLOs, then optimize CET/CPK within that governed envelope instead of trading service stability for marginal savings.
A practical decision pattern is to frame EMS procurement and governance as outcome-tiered. The first tier locks minimum OTP/OTD, safety, and compliance SLAs, with automated evidence from command-center tooling and trip logs. The second tier links commercial models to blended outcomes, where incentives and penalties index payouts to OTP, seat-fill, and exception-closure performance rather than raw kilometers alone. This approach gives the CHRO defensible “duty of care + experience” and gives the CFO predictable, auditable spend tied to measurable reliability instead of headline rates that ignore operational risk.
With hybrid demand swings in EMS, what scenario outputs should leaders look at so they can approve confidently without worrying the ROI will collapse in peak seasons or disruptions?
B0041 Scenario outputs executives need — In India employee mobility services (EMS) under hybrid-work volatility, what are the most useful scenario-model outputs for executives—so they can approve a contract without fearing festival seasons, weather disruptions, or roster churn will blow up the promised ROI?
In Indian employee mobility services under hybrid-work volatility, the most useful scenario-model outputs for executives are those that directly forecast reliability, cost, and safety performance under stress conditions. Executives rely on outputs that show how OTP, cost per trip, seat-fill, and incident risk behave when rosters, demand, and road conditions change together.
The strongest models simulate shift-windowed routing and fleet capacity against specific Indian patterns such as monsoon traffic, festival peaks, and political or infrastructure disruptions. These models are most valuable when they output OTP% and Trip Adherence Rate under different scenarios, with exception detection-to-closure time and the impact on attendance and shift adherence. Executives also look for projected Vehicle Utilization Index, dead mileage, and cost per employee trip so they can see whether promised savings survive demand spikes and routing changes.
For Finance and Procurement, scenario outputs must link SLA assumptions to commercials. Useful views include cost-per-kilometer and cost-per-seat curves under varied seat-fill, no-show rate, and hybrid-attendance patterns. Outputs that show 10–20% route cost reduction or year-over-year cost reduction are more credible when tied to specific routing and capacity assumptions and to outcome-based contract mechanisms such as penalties for SLA breach rate or incentives for utilization and OTP.
For HR, Security, and ESG leads, models that quantify incident rate, women-safety compliance risk under night-route changes, and EV utilization ratio under different shift mixes are important. Scenario outputs that show carbon abatement, emission intensity per trip, and EV fleet uptime under festival or monsoon stress help executives support EV and ESG commitments without fearing reliability breakdowns.
For Tier-1 and Tier-2 rollouts, what proof should we ask for to trust the vendor can deliver OTP and incident response outside metros without hidden buffers and extra costs?
B0042 Tier-2 reliability proof expectations — In India corporate employee transport (EMS) across Tier-1 and Tier-2 cities, what proof should buyers demand to believe a vendor can hit the same on-time performance and incident response outcomes outside metros—without padding the plan with hidden buffers and cost escalations?
In India’s corporate employee transport market, buyers should demand hard, comparable operating proof from non-metro cities that links on-time performance and incident response to audited data, not to hidden buffers or ad-hoc cost escalation. The core test is whether the vendor can show tier-2 outcomes that mirror metro SLAs using documented playbooks, live command-center observability, and transparent unit economics per trip or per km.
Vendors should first evidence a functioning command-center model that already monitors operations across multiple cities. Buyers should ask for screenshots or access to dashboards similar to the EV fleet and transport command centre views, where OTP, exceptions, and safety alerts are visible in real time for tier-2 locations, not just large campuses. Buyers should also insist on examples of centralized alert supervision or SOS workflows that show geofence violations, over-speeding, and SOS tickets being captured and closed against defined SLAs.
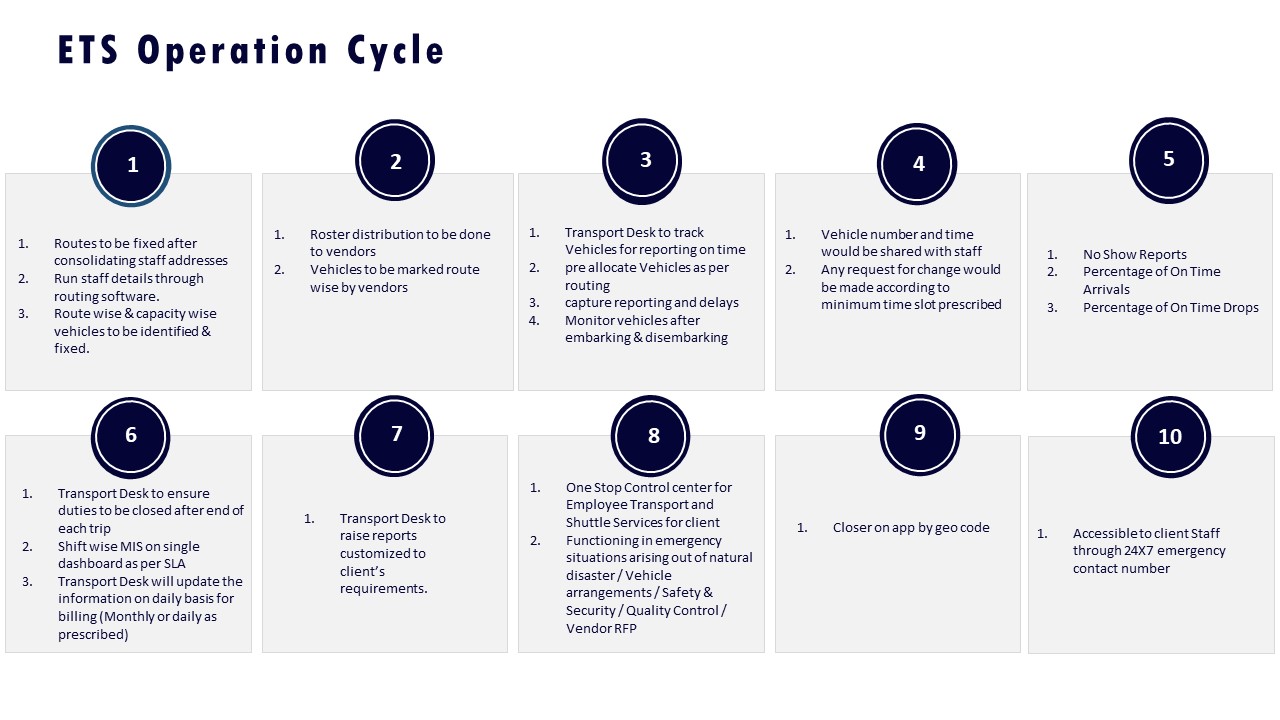
A common failure mode is vendors claiming “pan-India capability” but relying on loosely governed local vendors. Buyers should therefore demand route-level and shift-level OTP logs from at least one live tier-2 account that resemble the Mumbai monsoon case study: before/after OTP, exception counts, and customer satisfaction deltas under adverse conditions. This evidence should be backed by a clear ETS operation cycle or project planner that specifies how routing, fleet allocation, and escalation are handled in non-metro geographies.
To avoid hidden buffers and creeping costs, buyers should require alignment between SLAs, business continuity plans, and billing models. The business continuity collateral should show how cab shortages, political strikes, and technology failures are handled without unapproved surge pricing. The billing and invoicing flows should then prove that dead mileage caps, standby logic, and penalty/earnback clauses are implemented in the centralized billing system rather than left to manual interpretation.
Cost integrity in smaller cities depends on governance as much as on rates. Buyers should ask for indicative management reports and single-window dashboards used with other clients to monitor OTP, incident closure time, and cost per trip across multiple branches. These reports should include clear trip-level data that reconciles to carbon and ESG dashboards where EV fleets are deployed, showing that efficiency gains and uptime improvements (like the 86% to 93% fleet uptime improvement and per-km cost reduction) are achieved without undisclosed buffers.
Finally, buyers should request client references and governance artefacts that prove operational maturity beyond metros. These include actual escalation matrices for tier-2 sites, team structures with named roles on the ground, vendor and statutory compliance frameworks, and HSSE contribution charts that define who answers the phone at 2 a.m. and what SOPs they execute. When these artefacts line up with live dashboards, case-study outcomes, and reconciled billing flows, buyers gain credible assurance that metro-grade OTP and incident response can be replicated in smaller cities without hidden cost inflation.
If vendors are claiming big “AI routing” gains, what proof should we ask for—data packs, before/after KPIs, third-party audits—so we can separate hype from real results?
B0043 Proof to validate AI claims — In India corporate ground transportation (EMS/CRD), what are the most reliable ‘proof and references’ artifacts to ask for (anonymized data packs, before/after KPI deltas, and third-party audits) when buyers suspect vendors are overselling “AI routing” impact?
In corporate ground transportation in India, the most reliable proof against “AI routing” hype comes from hard operational baselines, before/after KPI deltas, and audit‑ready evidence that tie directly to OTP, cost, safety, and ESG metrics. Buyers gain control when they insist on anonymized data packs, independently verifiable dashboards, and third‑party validations instead of accepting generic slideware.
Vendors claiming optimization should first provide raw, anonymized trip‑level data samples. These data packs should show route manifests, GPS traces, shift windows, vehicle types, trip fill ratios, and exception logs before and after the “AI” deployment. Operations teams can then validate whether on‑time performance, dead mileage, and seat fill actually improved, and whether gains are consistent across weekdays, night shifts, and monsoon or festival periods.
A second class of artifacts is structured before/after KPI summaries aligned to EMS and CRD priorities. Reliable packs show changes in OTP%, trip adherence rate, cost per kilometer, cost per employee trip, fleet uptime, driver attrition, and complaint volumes over at least 3–6 months. The strongest references also isolate EV routes to evidence whether routing handled battery, charging windows, and night operations without increasing failure rates.
The third layer is formal assurance and audit artifacts. These include command‑center reports, route adherence audits, incident and SOS closure logs, and compliance dashboards for women‑safety protocols and driver KYC/PSV. Independent audits or customer satisfaction surveys provide additional credibility when they demonstrate stable performance improvements rather than short pilot spikes. Together, these artifacts turn “AI routing” from a marketing claim into an auditable, operations‑grade capability that transport heads, HR, and Finance can defend.
For EMS/ECS, how do we stress-test site-launch and demand-spike scenarios so we trust the capacity plan without locking into permanent overcapacity costs?
B0058 Stress-test capacity scenarios — In India enterprise mobility programs (EMS/ECS), how should leaders stress-test scenario models for site launches or sudden demand spikes so they can trust the vendor’s capacity plan without paying for permanent overcapacity?
Leaders should stress-test EMS/ECS capacity plans by running explicit “what-if” scenarios against OTP, fleet utilization, and driver fatigue limits instead of accepting static headcount or vehicle numbers. The goal is to see how the vendor’s plan behaves under real peak patterns, not just on an average day, and to prove that buffers are temporary and outcome-linked rather than permanent overcapacity on the P&L.
A robust scenario model starts from actual shift windowing, seat-fill targets, and dead-mile caps. Leaders should ask vendors to simulate multiple cases such as a new site go-live, a 20–30% attendance spike, or weather and political disruptions. Each scenario should output changes in OTP%, Trip Adherence Rate, Vehicle Utilization Index, and cost per trip. A common failure mode is a plan that keeps OTP high only by parking idle cabs on-site all day, which erodes cost efficiency and hides weak routing.
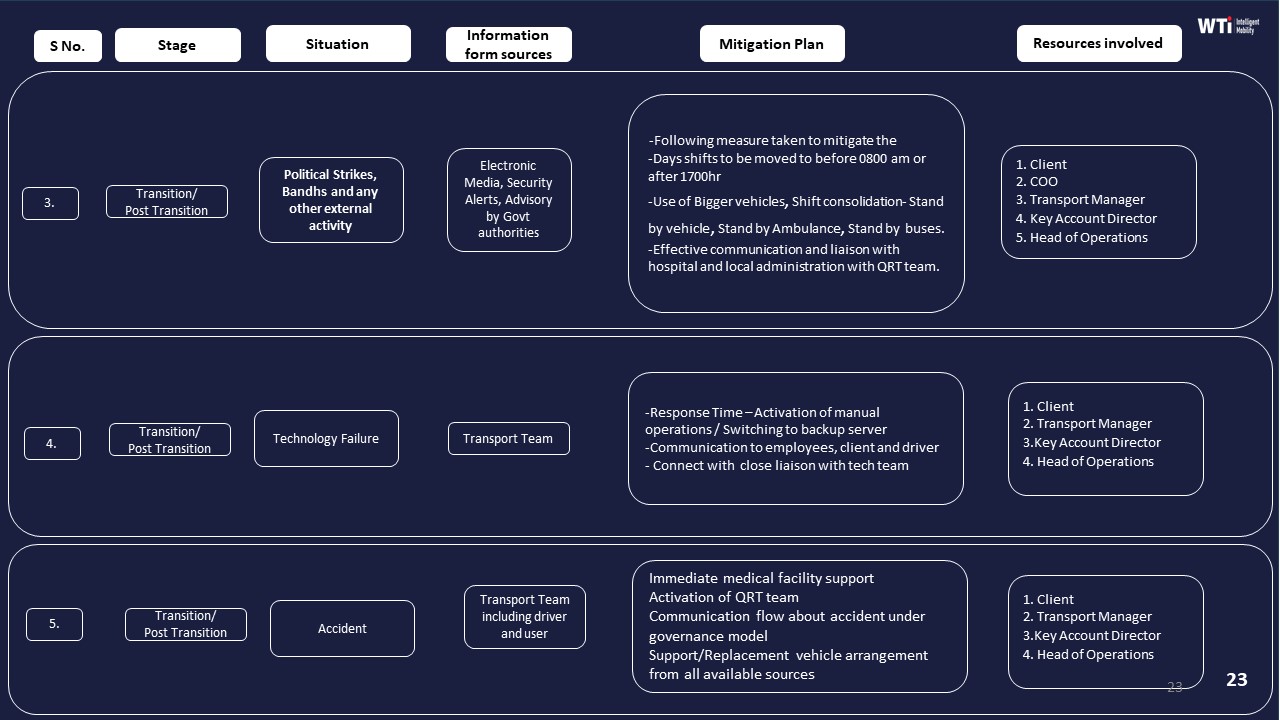
Stress-testing also needs to cover operational resilience. Vendors should show how a 24x7 command center will dynamically recalibrate routes, reallocate vehicles across hubs, and invoke standby fleets during demand spikes. Business continuity plans for cab shortages, technology failures, or natural events should be tied back to measurable service-impact and recovery-time assumptions instead of vague “best-effort” language. Leaders can then negotiate commercial models where permanent base capacity is lean, and buffers, rapid scale-up, and EV/ICE mix adjustments are compensated as outcome-based or time-bound elements rather than locked-in fixed cost.
images:
What do “scenario models” mean for mobility decisions, and when do we truly need them versus when it’s just overkill?
B0067 Explain scenario models for mobility ROI — In India enterprise-managed ground transportation (EMS/CRD/ECS/LTR), what does “Scenario Models” mean in practice for executives, and when is scenario modeling essential versus overkill for mobility ROI decisions?
Scenario models in Indian enterprise ground transportation are structured “what-if” views that quantify how changes in fleet mix, routing, EV adoption, demand patterns, or SLAs will impact cost, reliability, safety, and ESG metrics. Scenario modeling is essential when decisions are high-value, long-term, or hard to reverse, and it is overkill when choices are small, reversible, or can be tested quickly in live pilots.
In practice, scenario models convert operational levers into comparable options. Executives see side‑by‑side projections for cost per km and cost per employee trip, on‑time performance impact, vehicle utilization, and emissions for alternative designs. Typical EMS and ECS models stress‑test shift windowing, seat‑fill targets, dead‑mile caps, and peak vs non‑peak buffers. CRD and LTR models compare dedicated vs on‑demand supply, long‑term rental vs ad‑hoc usage, and EV vs ICE fleets using uptime, maintenance, and contract tenures.
Scenario modeling becomes essential when enterprises redesign network or policy baselines, negotiate outcome‑linked contracts, or commit to EV transition and charging topologies. It is also critical for decisions that affect ESG disclosures or require board‑level sign‑off, where CO₂ abatement, EV utilization ratio, and cost predictability must be defensible. Scenario modeling is usually unnecessary when tweaking minor SLA clauses, swapping vendors under similar commercials, or experimenting with limited‑scope pilots where data‑driven learning is faster than pre‑modelling.
Executives typically use three signals to justify full scenario modeling:
- High capital or long‑tenure commitment in fleet, platforms, or EV infrastructure.
- Material exposure to safety, compliance, or business continuity risk.
- Board‑visible KPIs at stake, such as ESG metrics, major cost lines, or OTP targets.
Data integrity, audit readiness & dispute discipline
Sets data portability, audit-ready KPI evidence, and dispute-resolution rules to maintain trust across sites and vendors.
If we ever switch vendors, what should we lock in on data ownership, exports, and KPI calculation transparency so we don’t lose baselines or history?
B0049 Data portability for ROI continuity — In India corporate ground transportation (EMS/CRD), what should buyers insist on regarding data ownership, data export formats, and KPI calculation transparency so the organization can switch vendors without losing ROI baselines or historical performance evidence?
In corporate ground transportation in India, buyers should insist that all mobility data, KPI definitions, and KPI calculations remain enterprise-owned, exportable in open formats, and transparently documented so any future vendor can recreate ROI baselines and performance trends without dependence on the previous platform. Buyers should require system-agnostic raw trip and event data, plus human-readable KPI logic, as part of standard contracts for EMS and CRD programs.
Organizations need clear data ownership clauses that state all trip, routing, compliance, safety, and billing data generated under EMS and CRD programs belongs to the enterprise. Contracts should mandate that vendors provide complete historical data on demand. This expectation aligns with outcome-based procurement and data-driven operations, where commute KPIs feed Finance, HR, ESG, and audit workflows.
Data export requirements should specify open, documented formats. Raw trip and event-level data should be exportable as CSV or similar tabular formats. Aggregated reports, routings, exception logs, and audit trails should be exportable in non-proprietary formats that BI or audit tools can consume. Integration with HRMS, ERP, and analytics platforms depends on such stable, vendor-neutral data structures.
KPI transparency requires vendors to disclose how each metric is calculated. OTP%, Cost per Employee Trip, Cost per Kilometer, dead mileage, Trip Fill Ratio, incident rates, and CO₂ metrics all need explicit formulas and inclusion/exclusion rules. Transparent KPI logic allows future vendors to reproduce baselines and trend lines, supporting mobility governance boards, audits, and ESG disclosures.
To protect long-term comparability and switchability, buyers should ensure contracts include:
- Explicit enterprise data ownership and access rights for all EMS/CRD data.
- Obligations for periodic and end-of-contract export in open, documented formats.
- Written definitions and calculation methods for all contractual KPIs and SLAs.
- APIs or exports that align mobility data with HRMS, finance, and ESG reporting pipelines.
Without these safeguards, mobility programs risk vendor lock-in, irreproducible ROI claims, and weak historical evidence for safety, reliability, and ESG performance.
With outcome-linked EMS contracts, where do measurement disputes usually happen—OTP, exceptions, seat-fill, dead miles—and how do we set dispute rules upfront to avoid monthly renegotiations?
B0050 Prevent KPI measurement disputes — In India corporate employee mobility services (EMS) with outcome-linked procurement, what are the most common sources of measurement disputes (OTP definitions, trip adherence exceptions, seat-fill, dead miles) and how can leaders pre-agree on dispute rules so Procurement isn’t stuck renegotiating every month?
Most EMS measurement disputes in outcome-linked contracts come from ambiguous KPI definitions and undocumented exception rules. Leaders can avoid monthly renegotiation by defining KPIs, exclusions, data sources, and dispute workflows in a single, pre-signed “measurement annexure” that sits behind the commercial terms.
The most frequent flashpoints are On-Time Performance, Trip Adherence, seat-fill, and dead mileage. OTP disputes arise when there is no single definition of “on time” by band. Trip Adherence disputes emerge when route changes for safety, traffic, or employee requests are not tagged as approved exceptions. Seat-fill disputes occur when no one has agreed how to treat no-shows, last-minute roster changes, or vendor-suggested clubbing. Dead mileage disputes appear when there are no transparent rules for base hubs, buffer vehicles, or minimum guaranteed billing.
A practical pattern that reduces noise is to treat KPI measurement as a governed process rather than a monthly argument. Organizations define business rules for each KPI, codify valid exceptions (for example, extreme weather or police diversions), and lock a single system-of-record for time stamps and GPS trails. Transport and vendor teams then run weekly joint reviews to close deviations, rather than letting all disagreements surface in billing.
To keep Procurement out of constant renegotiation, leaders typically anchor four elements in the contract pack:
- Clear KPI formulas and time bands, including OTP grace windows and Trip Adherence rules.
- Enumerated exception categories, with who authorizes them and how they are tagged in systems.
- Declared data hierarchy, stating which dashboards, GPS feeds, or logs are considered final for each KPI.
- A simple, time-bound dispute workflow, with thresholds where exceptions convert into credits instead of debates.
When EMS, HR, Finance, and vendors sign off on this measurement framework up front, outcome-linked procurement becomes enforceable, auditable, and far less emotionally charged for the transport head and Procurement.
What are the red flags that our mobility reporting isn’t reliable enough for ROI decisions—manual adjustments, inconsistent trip data, invoice gaps—and how should Finance size the risk?
B0052 Red flags in ROI reporting — In India enterprise-managed ground mobility (EMS/CRD), what signals indicate that the organization’s current reporting is not trustworthy enough for ROI decisions—such as inconsistent trip master data, too many manual adjustments, or SLA-to-invoice gaps—and how should a CFO quantify that risk?
In enterprise-managed employee mobility and corporate car rentals, reporting becomes untrustworthy for ROI decisions when operational, financial, and compliance data cannot be reconciled into a single, audit-ready picture. A CFO should treat this as a quantifiable risk exposure on cost, compliance, and ESG rather than a “soft” reporting issue.
Key warning signals of untrustworthy reporting include inconsistent or non-standardized trip master data across EMS and CRD vendors. Another signal is heavy reliance on manual adjustments in billing, reconciliations, and exception handling. A third signal is a persistent gap between operational SLAs (OTP%, seat-fill, fleet uptime) and what actually flows into invoices and MIS. Additional indicators are fragmented data silos between HRMS, transport desk, vendors, and Finance, and the inability to produce clean audit trails for trips, incidents, and route adherence. When ESG or EV impact numbers cannot be tied back to trip-level logs, the CFO also loses confidence in sustainability ROI claims.
These patterns usually mean that unit economics such as cost per kilometer and cost per employee trip are directionally estimated rather than measurement-based. They also mean leakage through dead mileage, incorrect trip counts, and misaligned commercial models is likely but unproven. For Finance, this undermines both cost control and the defensibility of mobility spend during internal or external audits.
A CFO can quantify this risk by treating it as a range of potential misstatement on the mobility P&L and by attaching probability to leakage, non-compliance, and reputational downside. A practical approach is to baseline a small but representative sample of trips across EMS and CRD. In this sample, the CFO’s team can fully reconstruct the trip lifecycle from roster and booking through GPS trace, OTP performance, and final invoice line items. The reconciliation should flag mismatches in distance, time slabs, surcharges, no-show logic, and dead mileage attribution. The ratio of disputed or irreconcilable value in the sample can then be extrapolated across the annual mobility spend to estimate a leakage band.
In parallel, the CFO can estimate compliance risk exposure by checking how often trip and driver data cannot support safety and regulatory requirements. Examples include missing escort or women-safety documentation for night shifts, incomplete driver licensing or PSV credential records, or broken audit trails for incidents. Each gap can be translated into potential penalties, legal costs, and internal investigation overhead.
This quantified view transforms vague concerns about “bad data” into explicit risk categories. These categories cover financial leakage, audit qualification risk, and ESG credibility exposure tied to commute emissions or EV utilization claims. It also helps Finance justify investments in integrated mobility platforms, centralized command-center observability, and standardized SLA-to-invoice governance, because the downside is now expressed in measurable terms rather than anecdotal complaints.
images:
When vendors show ROI, how do we check it’s repeatable across shifts and cities, not just a best-case pilot site?
B0053 Validate ROI repeatability — In India corporate mobility vendor evaluations (EMS/CRD/ECS), how should buyers validate that a vendor’s claimed ROI is repeatable across timebands (night shift vs day) and cities, rather than being a single ‘best-case’ reference site?
In India corporate mobility evaluations, buyers should insist on city- and timeband-sliced evidence, not a single aggregate ROI number or showcase site. Vendors should be validated on repeatable performance across night and day shifts, and across multiple cities, using audit-ready data tied to operational KPIs and commercials.
Buyers can first demand a baseline–to–post-implementation comparison for EMS, CRD, and ECS that is broken down by city and timeband. Each data slice should show changes in cost per kilometer, cost per employee trip, on-time performance, trip adherence, fleet uptime, and seat-fill or utilization. A common failure mode is vendors presenting six-month savings from one flagship campus or one city, without disclosing weaker performance in other locations or in night shifts.
Buyers should also ask for access to anonymized dashboards or static exports from the vendor’s command center, with clear OTP%, exception-closure time, no-show rates, and incident rates split by day vs night, weekday vs weekend, and by at least 3–5 cities. Outcome-linked KPIs like route cost reduction, reduced dead mileage, and EV utilization ratio should be visible per cluster. ROI claims that are not supported by such granular observability are rarely repeatable.
To validate repeatability, buyers can require at least two or three reference clients whose programs span different regions and timebands, including challenging conditions like heavy traffic or monsoon-affected cities. They should ask reference clients directly whether the same level of cost control and reliability was achieved in night shifts, ramp-up phases, and new-city launches, not only in mature, optimized sites.
Contractually, buyers can link payouts to on-time performance, safety incidents, seat-fill, and utilization at the timeband–city level. Outcome-based clauses that apply only at an overall account level can hide underperforming clusters. City-wise SLA dashboards, route adherence audits, and periodic performance reviews help ensure that ROI remains consistent when operations expand or shift.
images:
After go-live in EMS, what governance cadence should we run so ROI stays on track without exhausting HR and Ops with endless reviews and escalations?
B0056 Post-purchase governance cadence — In India corporate employee mobility services (EMS), what should a post-purchase governance cadence look like (monthly business reviews, exception reviews, and target resets) to keep ROI on track without burning out HR and Ops with constant escalations and reporting?
A sustainable post-purchase governance cadence in Indian EMS works best as a layered rhythm. Monthly business reviews and structured exception reviews should run off a stable KPI pack, while quarterly target resets align commercials and SLAs. This approach protects ROI and service quality without forcing HR and Transport into daily firefighting or ad‑hoc reporting cycles.
A common failure mode is over-frequent governance. Daily or even weekly deep-dives pull Transport and HR into decks and calls instead of route control and driver management. Governance works better when the 24x7 command center, EMS platform, and incident workflows produce a single-window dashboard for OTP, safety incidents, Trip Adherence Rate, and complaint closure. HR and Ops should only step in when exception thresholds are breached or patterns persist for more than one cycle.
Monthly governance should behave like a standing “ops and risk” council. Transport, vendor ops, and Security/EHS review on-time performance, exception latency, women-safety compliance, and key no-show or roster issues. HR attends when patterns touch attendance, morale, or women-safety risk. Finance joins when CET/CPK and dead mileage drift beyond agreed bands or billing disputes repeat.
Quarterly reviews are the right forum to reset targets, tweak fleet mix or EV penetration, and adjust commercial levers tied to OTP, safety incidents, and Trip Fill Ratio. Outcome-linked contracts and incentives work better when they are not renegotiated mid-month. This spacing also lets data stabilize and avoids “knee-jerk” changes after single incidents. A clear escalation matrix and business continuity playbooks should be invoked only for defined triggers, such as sustained OTP drops or serious safety incidents, so that HR and Ops are not dragged into every minor deviation.
In a multi-vendor EMS setup, how do we standardize KPIs so Procurement can compare vendors fairly and avoid KPI definition games?
B0060 Standardize KPIs across vendors — In India multi-vendor employee transport (EMS), what is a realistic approach to standardizing KPIs and references across vendors so Procurement can compare apples-to-apples and avoid being manipulated by different definitions of OTP, cancellations, and exceptions?
In multi-vendor EMS in India, the only realistic way to get apples-to-apples KPIs is to define one “common language” of trip events, timestamps, and statuses at the contract level and then force every vendor’s data into that schema before you calculate OTP, cancellations, or exceptions. Procurement needs to standardize definitions first, then standardize data capture, and only after that standardize KPIs and penalties.
A common failure mode is starting with vendor dashboards. Vendor-supplied OTP or “trip success” numbers are usually not comparable because each vendor encodes events, grace periods, and exclusion rules differently. Procurement gains control when the enterprise owns the canonical KPI dictionary and the event log, and vendors are only data providers against that model.
A practical pattern is to anchor KPIs to raw, verifiable events. These events include planned pickup time from the roster, actual GPS-based arrival time, boarding confirmation, transport-desk change approvals, and user or command-center cancellations. OTP then becomes a simple calculation on standardized fields. Cancellation rate and “no-show” rate are derived the same way. Exception closure SLA is computed from centralized alert and ticket timestamps, not vendor self-reporting.
Procurement can then embed these standard KPI formulas into RFPs, MSAs, and rate cards. All vendors must accept the common definitions of OTP, cancellation, dead mileage, and incident, and agree that disputes will be resolved against the enterprise’s trip ledger, not individual vendor reports. This shifts leverage away from vendor narrative and towards traceable, auditable data that Finance, HR, and Security can all trust.
To make this workable for the Facility / Transport Head, the same canonical KPIs should be surfaced in a single-window operational dashboard and used in daily/weekly reviews. This reduces firefighting caused by conflicting numbers and allows Procurement to benchmark vendors using uniform SLA compliance scores and exception patterns instead of incompatible reports.
images:
Before we change EMS vendors, what social proof should leadership ask for—peer references, audited KPI packs, incident outcomes—so we’re not risking our reputation?
B0061 Social proof before vendor switch — In India corporate employee mobility services (EMS), what should executives look for as social proof—peer references by city and timeband, audited KPI packs, and incident-response outcomes—before betting their reputation on a vendor change?
Executives evaluating employee mobility services in India should insist on social proof that is city-specific, timeband-specific, and audit-ready. Social proof is credible only when it links peer references, hard KPIs, and real incident-response outcomes to the buyer’s own operating reality.
Executives in HR, Transport, and ESG roles should prioritize peer references from similar companies operating in the same cities and timebands. References are most useful when they specify night-shift safety performance, hybrid-roster complexity, and how the vendor handled monsoon traffic or political disruptions in that geography. Case studies that show on-time arrival improvement to around 98% in challenging conditions, or satisfaction scores above 90%, give better assurance than generic testimonials.
CFOs and Procurement leaders should demand audited KPI packs before committing to a vendor change. These KPI packs should include on-time performance percentages, fleet uptime, cost per kilometer baselines, and pre/post comparisons of route or idle-time optimization. Evidence of CO₂ reduction, cost per kilometer improvement, and employee satisfaction movement over at least one or two quarters is a strong indicator that the vendor’s claims are repeatable.
Transport and Security heads should look for documented incident-response outcomes as core social proof. Effective evidence includes business continuity plans for cab shortages, weather, strikes, and technology failures, along with specific mitigation steps. It also includes real-time alert supervision models, command-center governance structures, and women-centric safety protocols backed by driver-compliance and fleet-compliance documentation.
Executives should also check for third-party recognition and scale signals alongside these proofs. Indicators such as ISO certifications, national awards, IPO or capital strength, and long-tenure relationships with well-known enterprises help validate that the vendor can sustain performance across multiple cities and extended contracts without increasing operational risk.
Adoption, experience & change management
Translates user behavior and experience into actionable change plans, with safeguards against adoption fatigue and governance frictions.
In EMS, what usually goes wrong when we try to link transport improvements to attendance and productivity, so HR and Finance both trust the story?
B0037 Attribution pitfalls for productivity linkage — In India shift-based employee mobility services (EMS), what are the common failure modes in attributing mobility improvements to attendance stability and productivity—so HR doesn’t overclaim credit and Finance doesn’t dismiss everything as “correlation”?
In India shift-based employee mobility services, attribution usually fails because organizations lack clean baselines, do not isolate transport changes from HR and business changes, and cannot link trip-level data to individual attendance and productivity metrics in a traceable way. Most HR narratives rely on temporal correlation (“after we fixed transport, attendance improved”) without a design that Finance would recognize as causal, audit-ready, and repeatable.
A frequent failure mode is starting without a defined pre-EMS baseline. Organizations often do not freeze historic OTP%, no-show rates, shift adherence, and commute-related grievances before changing routing, vendors, or EV mix. As a result, later comparisons use partial memory and biased samples, which erodes Finance’s trust and invites the “this is just correlation” argument. Another pattern is mixing multiple interventions in the same period. HR may roll out new EMS routing, relax RTO policies, change shift timing, and launch a wellness program together. When all this moves attendance, it becomes impossible to attribute impact specifically to mobility.
Attribution also breaks when HRMS and EMS data are not integrated at person and shift level. Many teams compare fleet-level OTP with site-level attendance, which hides edge cases, double counts, and survival bias. Without a clear trip → employee → shift → output mapping, Finance cannot test alternative explanations like roster rationalization or seasonality. A further issue is ignoring control groups or A/B style comparisons. When every site and band is changed simultaneously, no benchmark group exists for Finance to check whether similar employees without the mobility change saw comparable improvements.
A common behavioral mistake is over-indexing on anecdotes and NPS while under-specifying the measurement model. HR tends to showcase individual stories or survey scores without pre-agreed KPI formulas for “commute-linked attendance uplift” or “recovered productive minutes per shift.” Finance then sees soft metrics floating on top of unverified operational data and discounts the entire impact story. Another failure mode is inconsistent time windows. HR may cite a three-month “post” period with favorable seasonality against a twelve-month “pre” period that includes peak attrition or festival disruption, which weakens statistical comparability.
To avoid these traps, organizations need a few disciplined practices. They should define, upfront, which attendance and productivity indicators are plausibly mobility-sensitive and lock a baseline window before major EMS changes. They should ensure EMS trip and OTP data is joined at the employee–shift level in HRMS, so Finance can trace each claim down to raw logs if challenged. They should sequence interventions so at least some locations or cohorts act as quasi-controls during the first wave of routing, vendor, or EV changes. They should agree cross-functionally on a simple attribution template where Transport owns operational inputs (OTP, trip adherence), HR owns people outcomes (late-logins, commute complaints), and Finance co-signs the linkage logic and review cadence.
When attribution is treated as a joint HR–Transport–Finance exercise with shared definitions and transparent data access, HR is less likely to overclaim and Finance is less likely to dismiss. The narrative then shifts from “transport solved productivity” or “this is just correlation” to “these specific EMS improvements explain this proportion of attendance stability, within an agreed, auditable confidence band.”
How should HR and Ops define experience KPIs—NPS, complaints, closure times—so we improve employee sentiment without creating an ops reporting nightmare?
B0044 Define experience outcomes without burden — In India enterprise employee mobility services (EMS), how should HR and the Transport Head jointly define ‘experience’ outcomes (CEI/NPS, complaint volume, closure SLAs) so the program improves employer brand without creating a reporting burden that frontline ops cannot sustain?
In India EMS, HR and the Transport Head should define “experience” outcomes as a small, fixed set of measurable commute metrics that map directly to employer brand (safety, reliability, respect) while being automatically generated from the mobility platform and command center, not from manual Excel work by ops teams. Experience should be expressed through a Commute Experience Index or NPS, complaint volume and mix, and complaint closure SLAs, with clear thresholds and ownership for each.
HR should anchor experience outcomes to employee trust and safety. The Transport Head should anchor the same outcomes to on-time performance, routing stability, and incident readiness, which the command center and driver apps already track. A common failure mode is defining too many “nice to have” questions in surveys that frontline operations cannot translate into actionable routing or driver-coaching decisions, which leads to reporting fatigue and no visible change on the ground.
To avoid that, both functions should agree on three to five “control-room” signals that can be auto-derived from EMS tools and NOC dashboards. Those signals should include NPS or a simple CEI score from rider apps, complaint count by category, closure time for tickets and SOS events, and links to reliability metrics such as OTP and Trip Adherence Rate. Most organizations achieve better outcomes when these indicators are surfaced on a single-window dashboard rather than split across fragmented reports from different vendors or branches.
HR should then use these EMS experience outcomes directly in EVP and employer-brand narratives. The Transport Head should use the same numbers in daily huddles with drivers and vendors, supported by data-driven insights on routing, safety, and compliance already available in the platform. This alignment improves employer brand credibility while keeping the reporting footprint light enough for night-shift operations and peak-hour teams to sustain without burnout.
For women and night-shift commutes, how do we judge if stricter rules and approvals will increase trust—or just add friction and annoy employees and managers?
B0045 Governance vs employee friction — In India corporate employee mobility services (EMS) supporting women and night-shift commutes, how can leadership evaluate whether tighter governance (approvals, routing rules, escalations) will improve trust and adoption—or backfire by increasing cognitive load and daily friction for employees and managers?
In employee mobility services for women and night-shift commutes, tighter governance improves trust and adoption only when controls are largely invisible to riders and managers and when every new rule is backed by automation, clear ownership, and measurable risk reduction. Tighter governance backfires when it surfaces as extra forms, extra approvals, or opaque denials that HR and line managers must manually explain or override.
Governance works when leadership treats safety and compliance as “by design” outcomes of the EMS platform. In practice that means using routing engines, geo‑fencing, driver KYC/PSV automation, and escort rules embedded in the roster and route planner instead of adding manual checkpoints. When women-safety protocols, SOS flows, and escort policies run through a centralized command center with clear escalation matrices, the Facility / Transport Head gets early alerts and fewer 2 a.m. calls, and HR gains audit-ready proof without asking employees to self-manage risk.
A common failure mode is pushing governance into the foreground as visible friction. Extra approval steps for every ad‑hoc ride, rigid routing overrides that ignore hybrid-work realities, or fragmented apps that do not sync with HRMS and shifts all increase cognitive load for managers. That erodes commute NPS and pushes employees toward informal workarounds, undermining both trust and compliance.
Leadership can treat “governance intensity” as a design parameter and test it empirically rather than ideologically. Pilot tighter routing rules and escalation paths on a subset of night-shift routes with full NOC monitoring, and watch on‑time performance, incident rates, helpdesk tickets, and employee feedback simultaneously. If safety indicators and auditability improve while complaint volume, no‑show rate, and manual overrides remain flat or improve, the governance design is likely accretive to trust. If managers start bypassing the system, escalations rise, or employees report confusion about approvals and pick‑ups, the governance layer is being felt as friction rather than protection.
Leadership should insist on three evaluation questions before adding any new approval, routing rule, or escalation step in EMS:
- Can this control be executed by the system or command center instead of by the employee or line manager?
- Does it create clear, auditable evidence for HR, Security/EHS, and ESG without requiring employees to enter more data or make more decisions?
- Can Transport and HR see in their dashboards whether this control is reducing incidents and SLA breaches, or just increasing exceptions and manual work?
Governance that passes these tests tends to feel like “quiet safety” for women and night-shift commuters. Governance that fails them tends to feel like bureaucracy and triggers workarounds that reduce both trust and adoption.
In EMS, how do we figure out if poor adoption is mainly due to service reliability or due to our policies and communication, before we invest in a new platform?
B0051 Diagnose root cause of low adoption — In India corporate employee transport (EMS), how should HR diagnose whether low adoption and negative sentiment are primarily caused by operational reliability issues (OTP, routing) versus policy and communication issues (eligibility rules, change fatigue), before spending on a new platform?
In Indian corporate employee transport, HR should separate reliability issues from policy and communication issues by triangulating three things in sequence. HR should first segment and analyze operational data, then run structured employee diagnostics, and finally validate against a few targeted live tests before deciding on a new platform spend.
HR should start with hard operational data tied to the ETS / EMS operation cycle. HR should ask Transport for route-wise and shift-wise On-Time Performance (OTP%), Trip Adherence Rate, no-show rates, and exception-closure times for the last 4–8 weeks. Large gaps between routes or time-bands usually signal operational reliability problems. A pattern where OTP is healthy but complaints remain high usually points towards policy friction, perceived unfairness, or communication gaps rather than routing failure.
HR should then collect structured employee feedback that explicitly separates “service not working” from “rules not working.” HR should run a short survey and floor connects that use distinct question blocks. One block should ask about booking ease, app stability, tracking, and pickup predictability. A second block should ask about eligibility clarity, cancellation rules, cut‑off times, and perceived fairness across levels or shifts. If most negative sentiment clusters on unpredictability, missed pickups, or safety escalations, reliability and vendor governance need fixing first. If dissatisfaction clusters on “I am not eligible,” “cut-off timings are impractical,” or “policy keeps changing,” policy design and change management are the primary problems.
HR should validate hypotheses through controlled operational experiments before committing to a new EMS platform. HR and Transport can temporarily tighten routing and command-center SOPs on a few problematic corridors without changing policy. HR can then observe whether complaints and sentiment improve in those corridors. HR can separately pilot simple policy relaxations or clearer communication for a small, defined employee group while holding operations constant. If reliability-focused interventions improve NPS and reduce escalations faster than policy tweaks, the root cause is operational. If transparent policy changes and better communication reduce noise even where OTP was already acceptable, the core issue is policy design and trust, not technology.
A simple diagnostic structure that HR teams can use before a platform decision is:
- Check whether OTP%, Trip Adherence, and exception-closure SLAs are consistently healthy across routes and shifts.
- Map complaint tickets and informal escalations to either “service failure” or “policy / eligibility” categories.
- Ask employees separately about predictability and safety versus fairness and clarity of rules.
- Run small, time‑boxed experiments on routing discipline and policy communication, and observe which changes move sentiment and adoption.
If OTP is weak and escalations are operationally clustered, a new platform alone will not fix adoption until vendor governance, routing, and command-center execution stabilize. If operations are stable on paper but employees perceive the system as opaque, unfair, or constantly changing, HR should redesign policy, simplify rules, and communicate eligibility and cut‑offs clearly before investing in another layer of technology.
In EMS, how do we set seat-fill and dead-mile targets that Ops can deliver without making rides worse and triggering employee backlash?
B0054 Seat-fill targets without backlash — In India employee mobility services (EMS), what is a reasonable approach to setting targets for seat-fill and dead-mile reduction that operations can actually deliver without causing employee backlash (longer ride times, inconvenient pooling) that undermines adoption?
In India EMS programs, most organizations set seat-fill and dead-mile targets as progressive ranges, not hard jumps, and they calibrate them against OTP, ride-time, and complaint trends before tightening. Targets that operations can actually deliver usually start slightly better than current baselines and move up quarter by quarter, with explicit guardrails on maximum ride time and on-time performance.
A common failure mode is treating seat-fill as a pure cost lever. Operations teams then over-pool cabs and extend detours, which quickly creates employee backlash, drops Commute Experience Index, and forces leadership to roll back policies. A more resilient approach ties seat-fill and dead-mile reduction to three co-equal outcomes. These are reliability (OTP and Trip Adherence Rate), safety compliance (especially for women and night shifts), and employee experience (complaint and NPS trends) alongside cost-per-trip metrics.
Most mature EMS operators therefore treat “seat-fill improvement” and “dead mileage reduction” as outcome-linked optimization. They use dynamic routing, shift windowing, and hybrid fleet mixes to increase pooling where demand is dense and predictable, but they allow lower pooling and some dead mileage in sparse routes, late-night bands, or high-risk corridors. Central command centers and NOC tools monitor exceptions, geofencing, and incident patterns to ensure that routing changes do not compromise escort rules or women-safety protocols.
Practical target-setting usually follows a staged pattern:
- First, measure current Trip Fill Ratio, dead mileage, OTP, and average ride times for at least one full roster cycle.
- Second, set modest short-term improvements that operations can test in one or two timebands and locations, watching ride-time and complaint impact.
- Third, embed explicit SOPs that cap maximum ride time per shift window and minimum OTP, and only then ratchet seat-fill and dead-mile targets upward through quarterly governance.
When targets, routing rules, and employee protections are codified in EMS SOPs and governed through a 24x7 command center, operations teams gain early alerts instead of daily firefighting, and employees perceive pooling changes as structured and fair rather than arbitrary.
In EMS, how should we measure outcomes—tracking, feedback, evidence—so employees see it as safety and service improvement, not surveillance that hurts morale?
B0059 Measure outcomes without surveillance backlash — In India corporate employee mobility services (EMS) where unions or employee forums scrutinize commute policies, how should HR and Legal frame outcome measurement (tracking, feedback, and evidence) so it improves trust and employer brand instead of triggering surveillance concerns and morale issues?
In union‑sensitive employee mobility programs in India, HR and Legal should frame outcome measurement as safety, fairness, and reliability assurance with clear limits, not as individual surveillance or performance tracking. Outcome metrics should be transparently defined, aggregated wherever possible, and tightly linked to duty of care, ESG, and service quality outcomes that employee forums themselves value.
Outcome measurement works best when HR positions commute data as part of a governed EMS program with SLA-driven delivery, centralized command-center observability, and audit-ready safety and compliance logs. HR should explicitly state that GPS, routing data, and trip records exist to improve On-Time Performance, reduce incidents on night shifts, enforce women-safety protocols, and validate vendor compliance with Motor Vehicles, labour, and HSSE norms. Legal should codify that EMS data is not to be used for productivity scoring, disciplinary action, or off-duty monitoring.
A common failure mode is silent data expansion. Unions push back when commute apps become backdoor attendance trackers without prior consultation. HR avoids this by co-creating a “commute data charter” with employee forums that covers what is collected, for how long, who sees it, and how it will be used in audits and ESG reports. The charter should emphasize chain-of-custody and audit trail integrity for incident reconstruction, while committing to role-based access, retention limits, and DPDP-aligned minimization.
In practice, trust improves when employees can see tangible benefits from data. Examples include transparent OTP statistics shared on dashboards, closure SLAs for complaints, visible reductions in incident rates, and clear reporting of EV utilization and CO₂ abatement supporting ESG disclosures. HR can also separate individual feedback (for grievance redressal) from anonymized analytics (for route optimization), and ensure that outcome-linked contracts with vendors focus on reliability, safety, and seat-fill, not on squeezing drivers in ways that create fatigue or labour conflict.
- Define a narrow, written purpose for EMS tracking focused on safety, compliance, and service SLAs.
- Use aggregated KPIs (OTP%, incident rate, commute experience index) for management, and protect granular data behind clear access controls.
- Engage unions early through joint reviews of dashboards, incident reporting flows, and EV/ESG metrics so they become co-owners of the governance model.
- Embed protections in policy and contracts that ban use of commute telemetry for unrelated HR actions, and reference these protections in union dialogue and employee communications.
In EMS, how do we judge if the user experience will be easy enough for everyone—employees, supervisors, coordinators—so adoption doesn’t collapse and ruin ROI?
B0063 Assess learning curve and adoption risk — In India corporate employee transport (EMS) where adoption is fragile, how should leaders evaluate whether the solution’s user experience will feel ‘zero learning curve’ for employees, supervisors, and transport coordinators, instead of triggering change-fatigue that kills ROI through low usage?
Evaluating “zero learning curve” UX in fragile EMS adoption
Leaders should treat “zero learning curve” as a testable, pre-go-live requirement and validate it by role, using real shift scenarios, not as a post-launch hope. A solution that will not trigger change-fatigue lets employees book and board with 2–3 obvious actions, lets supervisors and transport coordinators manage rosters and exceptions from a single, calm “command room” view, and still keeps safety, compliance, and billing evidence flowing in the background.
A common failure mode is evaluating only feature checklists or demos. Most organizations succeed when they run short, task-based usability tests for each persona. Employees should be able to onboard in four simple steps, see Direction & Timing, Real-Time Tracking, Ride Check-In, SOS, and Help & Support without training, as shown in the employee app collateral. Transport coordinators should be able to manage rostering, routing, compliance, and alerts from a unified Admin / Command Centre view, instead of juggling fragmented tools.
Leaders should pressure-test three areas before rollout.
- For employees: time to complete first booking, error rates, and whether features like ad-hoc requests and SOS are discovered without explanation.
- For supervisors/transport heads: ability to handle a full ETS Operation Cycle, from roster changes to exception handling, from one dashboard without calling IT.
- For coordinators and command-centre staff: clarity of alerts (geo-fence, overspeed, device tampering), ease of escalation using the Alert Supervision System, and whether shift-wise briefings plus the tools realistically reduce night-shift calls.
Most leaders also link UX evaluation to operational calm. They check if the platform integrates cleanly with HRMS rosters, supports manual fallback when apps or GPS fail, and exposes clear SOPs for peak shifts and disruptions. Solutions that pass these tests usually achieve higher adoption, fewer escalations, and protect ROI on EMS, EV transition, and safety initiatives.
Operational rigor, vendor management & escalation playbooks
Implements execution discipline, cost-splitting clarity, KPI standardization, exit readiness, and risk controls across vendor relationships.
For EMS and LTR, how do we show true savings versus cost shifting—like dead mileage savings but higher vehicle costs or EV buffers—so the CFO buys it?
B0040 Separate savings from cost shifting — In India enterprise employee transport (EMS) and long-term rental (LTR) fleets, what is the most defensible way to separate cost savings from cost shifting (e.g., dead mileage reduction vs higher vehicle class, EV downtime buffers, or more escorts) when presenting ROI to a CFO?
In India enterprise EMS and LTR fleets, the most defensible way to separate true cost savings from cost shifting is to build ROI on a normalized “cost per employee trip” and “cost per km” baseline that is adjusted for service level, risk controls, and fleet mix, and then show how specific levers (like dead mileage reduction) change those unit costs while holding policy and SLA constants. CFOs trust ROI arguments that isolate operational efficiency gains from deliberate upgrades such as higher vehicle class, EV buffers, or additional escorts, and that reconcile cleanly to billing and audited trip data.
A robust approach starts with a pre/post baseline for CET and CPK at the same service definition. The service definition must explicitly freeze variables like night-escort policy, minimum vehicle class, EV uptime buffers, safety controls, and attendance patterns. Dead mileage reduction, route optimization, or higher seat-fill then show up as direct efficiency gains in the CET/CPK trend. Upgrades such as moving to premium vehicle categories, adding women-safety escorts on more routes, or building EV redundancy should be treated as separate line items and expressed as “cost of risk reduction” or “cost of ESG uplift,” not as savings.
Most organizations that succeed with CFOs separate three buckets in their ROI story. The first bucket is pure efficiency, tied to levers such as route optimization, dead mileage caps, better vehicle utilization, and automated rostering, which reduce CET/CPK while keeping the same SLA. The second bucket is risk and safety investment, where costs for escorts, driver fatigue management, and women-centric night routing are quantified against incident reduction and duty-of-care compliance. The third bucket is ESG and EV transition, where EV-related changes to fuel cost, uptime, and charging infrastructure are normalized to show TCO impact, and then carbon abatement is layered in as an additional strategic benefit rather than “free savings.”
CFO confidence increases when EMS and LTR operators link every rupee of claimed savings back to reconciled trip logs, centralized billing, and SLA dashboards. It also increases when changes like EV downtime buffers or vehicle upgrades are explicitly modeled as scenario variants against the same underlying dataset, instead of blended into a single headline number.
As we add sites or change vendors, how can IT make sure our EMS KPIs stay consistent so leadership can compare results quarter to quarter?
B0048 KPI consistency across sites — In India multi-site corporate employee transport (EMS), how should a CIO evaluate whether the mobility vendor’s KPI and ROI reporting will remain consistent as sites and vendors change—so leadership doesn’t lose comparability and confidence quarter over quarter?
A CIO should evaluate mobility KPI and ROI reporting by enforcing a vendor-neutral data model and governance layer, so that metrics stay comparable even when sites or vendors change. The core check is whether reporting is tied to a stable semantic KPI layer rather than to any single operator, city, or app implementation.
A robust evaluation starts with the KPI definitions themselves. The CIO should insist that core EMS metrics such as On-Time Performance, Trip Adherence Rate, Vehicle Utilization Index, Trip Fill Ratio, Cost per Employee Trip, incident rate, and EV utilization ratio are defined once in a canonical schema. The mobility platform should then map every site and vendor feed into that schema. This makes vendor-switching or city expansion a data-mapping exercise, not a redefinition of success.
A second check is where the reporting logic lives. KPI and ROI calculations should sit in a central mobility data lake or equivalent governed store, not inside individual vendor systems. The CIO should look for streaming trip and telematics data feeding into a governed semantic layer that produces dashboards and MIS. If each new vendor brings its own black-box reports, quarter-on-quarter comparability will erode.
A third signal is API-first integration and raw data access. The CIO should ensure that every EMS vendor exposes trip ledgers, GPS logs, and billing data via documented APIs, which the enterprise aggregates centrally. This enables consistent outcome-linked procurement, cross-vendor SLA tracking, and unified ESG mobility reporting for CO₂ per passenger-km and carbon abatement.
Finally, governance must be formalized. The CIO can mandate a mobility governance board that approves KPI definitions, reviews quarterly dashboards, and controls changes to metrics. Any new site or vendor should pass an onboarding checklist that covers schema alignment, SLA mapping, audit-trail integrity, and DPDP-compliant data sharing. Without this, leadership confidence in the numbers will decay as the footprint grows.
Images:
If we switch mobility vendors, how do we manage the political risk and internal resistance so the change doesn’t fail even if the ROI looks good?
B0055 Managing political risk in vendor change — In India corporate ground transportation programs (EMS/LTR), how should leaders think about ‘political capital’ risk when changing mobility vendors—especially if the current provider is entrenched—so the transformation doesn’t fail due to internal resistance even if the ROI math is sound?
Leaders should treat political capital as a finite budget that must be preserved for real failures, so any EMS/LTR vendor change should be framed as risk reduction and operational stability for internal stakeholders rather than just an ROI upgrade. A mobility transformation usually succeeds when HR, Transport, Finance, IT, and Security all see fewer escalations and clearer accountability after the change, and it fails when even one powerful function feels exposed, overruled, or surprised.
Political capital risk is highest when the incumbent vendor is entrenched and “known,” even if performance is mediocre. HR fears a safety or women’s night-shift incident under a new provider. The Facility / Transport Head fears more 2 a.m. firefighting and driver attrition. CFO and Procurement fear audit queries if the new commercials or billing logic are challenged. IT fears data and DPDP exposure from another platform. A leader burns political capital if any of these risks materialize without prior alignment, especially after having argued that the new model is “better.”
To manage this, leaders can use a phased, evidence-led playbook. They can start with a controlled pilot in a few shifts, sites, or personas and make OTP%, incident rate, CET/CPK, and complaint closure SLAs visible through a shared dashboard. They can preserve optionality by keeping afallback slice of the incumbent capacity live during transition, and by insisting on API openness and data portability to avoid perceived lock-in. They can pre‑agree escalation matrices and business continuity playbooks so that when monsoon traffic, political strikes, or tech outages happen, stakeholders see readiness, not improvisation.
Clear narrative control also protects political capital. The transformation should be positioned as a governed upgrade in compliance, safety, and observability, not as a repudiation of those who selected or managed the current vendor. Leaders should emphasize that the new EMS/LTR operating model strengthens HR’s audit readiness, reduces Finance reconciliation noise, gives Transport earlier alerts via a command-center style NOC, and supports ESG by enabling credible commute-emissions baselines. When stakeholders see their own KPIs de‑risked and their future investigations easier to defend, they are more likely to lend political cover to the change rather than resist it.
images:
For CRD bookings and billing, how should Finance define leakage controls and outcomes so we reduce reconciliation work instead of creating more?
B0057 CRD leakage controls and ROI — In India corporate car rental (CRD) booking and billing, how should Finance define leakage controls and ROI outcomes (policy compliance, approval adherence, and invoice accuracy) so the program reduces monthly reconciliation effort rather than shifting work onto the finance team?
Finance should define leakage controls and ROI outcomes for corporate car rental by tying every trip to pre-approved policy rules, automating trip-to-invoice matching, and demanding auditable data streams from the mobility platform rather than post-facto Excel reconciliation. Finance should treat CRD as a governed process with measurable outcomes on policy compliance, approval adherence, and invoice accuracy, not as a loose collection of vendor bills.
Finance reduces monthly effort when the booking platform enforces eligibility rules, cost ceilings, and approval hierarchies before a ride is dispatched. Finance also needs centralized, standardized billing models such as per km, trip-based, FTE, or pay-per-usage that are mapped to policy so that tariff mapping and tax calculations are automated in a single system instead of being reworked in Finance. A complete, accurate, and timely centralized billing engine with online reconciliation and customer approval workflows prevents leakage from manual overrides and fragmented vendor formats.
Leakage controls should include mandatory trip identifiers on every invoice line, GPS-backed duty slips, and automated checks for dead mileage or tariff mismatch to flag exceptions before invoices reach Finance. ROI outcomes should be framed as reduced cost per kilometer, fewer disputes per billing cycle, and a drop in manual adjustments, supported by systematic dashboards for usage, exceptions, and tax compliance. Programs that use centralized billing, clear billing models, and automated reconciliation decrease Finance’s monthly workload and move effort back into the transport operation and vendor governance where it belongs.
How do we define “exit readiness” for our mobility program so if we ever exit, we keep baselines, KPI history, and evidence without chaos?
B0062 Exit readiness for KPI continuity — In India corporate ground transportation (EMS/CRD/LTR), what is the right way to define and govern “exit readiness” for ROI measurement—so if the vendor relationship ends, the organization retains baselines, historical KPIs, and reference evidence without a messy data scramble?
Exit readiness in corporate ground transportation is defined best as a contractual and technical guarantee that all mobility data, KPIs, and evidence stay enterprise-owned, extractable, and auditable across the full contract lifecycle, with a rehearsed offboarding SOP that can be triggered without vendor friction. Exit readiness protects ROI measurement by ensuring that baselines, trend lines, and safety or ESG evidence remain intact even when EMS, CRD, or LTR providers change.
Most organizations need to hard-code exit readiness in three layers. The first layer is commercial and legal, where contracts specify data ownership, minimum data schemas for trips, billing and compliance, export formats, and a time-bound handover window linked to final payments. The second layer is technical and architectural, where platforms expose APIs or bulk exports so trip logs, routing outputs, command-center alerts, billing events, and EV telematics can be periodically replicated into an internal data environment. The third layer is operational governance, where command centers, transport teams, and finance create a standardized KPI library for OTP, cost per kilometer, incident logs, compliance status, and emissions, and align these metrics to internal dashboards rather than vendor-specific views.
A common failure mode is treating the vendor’s portal as the system of record and only asking for data near contract closure, which leads to gaps, inconsistent schemas, and audit risk. A more resilient pattern is to implement continuous evidence capture during business-as-usual operations, including shift-wise reports, safety and women-security evidence, billing and tariff mappings, EV utilization and carbon calculations, and business continuity incident records. This approach lets organizations benchmark new vendors against historical OTP, safety incidents, emissions, and cost without a messy data scramble.
For EMS/ECS, what early indicators should Ops track—like exception response time or complaint closure—so we can fix issues before Finance sees ROI slipping?
B0064 Leading indicators of ROI health — In India enterprise mobility (EMS/ECS), what are the most meaningful ‘leading indicators’ of ROI (exception latency, complaint closure SLA, roster stability) that operations leaders can act on before the CFO sees missed quarterly targets?
In India enterprise mobility operations, the most useful leading indicators of ROI are those that connect directly to reliability, safety, and utilization before they show up as cost overruns or attrition. Operations leaders can act early if they track exception latency, complaint closure SLA, roster stability, on‑time performance, and trip utilization together with safety and incident metrics.
Exception latency is critical because it measures how fast the command center detects and responds to deviations from plan. Lower exception latency usually improves on‑time performance and reduces dead mileage. It also prevents escalations from reaching HR or leadership.
Complaint closure SLA is a strong early signal of employee experience and potential attendance or attrition risk. Tight closure SLAs with clear ownership reduce noise for facility heads and prevent issues from becoming HR or CFO conversations.
Roster stability and shift adherence show whether routing and capacity planning are under control. Frequent last‑minute changes often increase empty runs, stress drivers, and degrade on‑time performance, which later inflates cost per employee trip.
On‑time performance (OTP%) and trip adherence rate are direct operational predictors of cost and satisfaction. Declining OTP usually precedes higher overtime, ad‑hoc cabs, and penalty exposure under outcome‑linked contracts.
Two more leading indicators with strong ROI linkage are trip fill ratio and dead mileage. Healthy seat‑fill and low dead mileage typically reduce cost per kilometer and improve fleet utilization.
For EMS/ECS, safety and compliance KPIs like incident rate and audit trail completeness also work as leading ROI indicators. Poor safety compliance often leads to vendor changes, legal exposure, and rework costs later in the year, even if the monthly bill seems under control.
In simple terms, what does “Outcome Definition & KPIs” mean for EMS, and why do HR and Finance often argue about it even if both want improvements?
B0065 Explain outcome definition and KPI conflict — In India corporate employee mobility services (EMS), what does “Outcome Definition & KPIs” mean in plain terms, and why do CFOs and CHROs often disagree on it even when they both want a ‘better commute program’?
Outcome Definition & KPIs in employee mobility simply means deciding, in advance, what “success” looks like for the commute program and how it will be measured in numbers that can be tracked every month. It turns a vague goal like “better transport” into specific targets such as on‑time pickups, incident‑free trips, and cost per employee trip that can be audited.
For CFOs, outcomes and KPIs are primarily about money, control, and audit. CFOs gravitate to metrics like cost per kilometer, cost per employee trip, dead mileage, and billing accuracy, because these flow into budgets, audits, and board questions. A CFO tends to define “better commute” as lower and more predictable spend, clean reconciliations, and fewer billing disputes.
For CHROs, outcomes and KPIs are primarily about safety, trust, and employee experience. CHROs focus on women‑safety compliance, zero serious incidents, on‑time performance linked to attendance, complaint closure SLAs, and commute satisfaction scores. A CHRO tends to define “better commute” as employees feeling safe, arriving on time without stress, and not escalating on internal forums.
Both sides want improvement, but they often disagree because they prioritize different risks. Finance worries about leakages and future audit remarks, while HR worries about a single incident or recurring service failures damaging morale and reputation. If KPIs are set only around cost, HR sees the program as unsafe or harsh on employees. If KPIs are set only around safety and experience, Finance sees an open‑ended cost line. In mature EMS programs, outcome definition usually has to balance both sets of metrics under one governed, SLA‑driven framework so neither side feels exposed.
At a leadership level, what does “cost and productivity linkage” mean in EMS, and how directly can commute performance really affect attendance and manager complaints?
B0066 Explain cost-to-productivity linkage — In India corporate employee transport (EMS), what does “Cost & Productivity Linkage” mean at a leadership level, and what is a reasonable expectation of how directly commute performance can influence attendance stability and manager complaints?
Cost & productivity linkage in Indian employee transport means leadership expects commute spending to show up as stable attendance, fewer shift disruptions, and lower “noise” from managers per rupee spent. Leadership views EMS not as a pure logistics cost but as an operational control lever that affects productivity, SLA delivery, and HR metrics like attrition and attendance.
At leadership level, most organizations treat cost per kilometer (CPK) and cost per employee trip (CET) as meaningful only when read alongside on‑time performance (OTP%), trip adherence, and no‑show patterns. A common pattern is that cheap but unreliable transport drives late logins, floor-level resentment, and unplanned overtime, which silently increases total cost of operations. A more expensive but reliable EMS model can reduce dead mileage, improve vehicle utilization, and cut incident firefighting, which often improves effective productivity per shift.
A reasonable expectation is that well-governed commute performance can materially stabilize attendance at a shift or process level. Leaders typically look for reductions in late logins, missed handovers, and last-minute replacement requests when OTP improves and routes are dynamically optimized. Commute reliability rarely transforms overall organizational productivity on its own, but it can remove a persistent source of friction that otherwise generates repetitive manager complaints, escalations to HR, and time lost in ad‑hoc coordination.