How to build a defensible KPI playbook that quiets the control room and delivers operational stability
You run the operations control room for daily reliability. This document translates KPI discipline into a practical, repeatable playbook that your dispatch team can follow without creating extra busywork. It shows exactly what to measure, who owns it, and what to do when a driver doesn't show up, GPS drops, or a vendor stalls—so you can keep the shift moving and demonstrate stability to leadership.
Explore Further
Operational Framework & FAQ
KPI governance, defensible metrics & vendor accountability
Defines how defensible KPIs are built and maintained, including baselines, data lineage, audit trails, and vendor performance reporting to prevent 'metric fights' and last-minute escalations.
For our corporate mobility program in India, what makes a KPI like cost per employee trip or OTP% truly “defensible” to Finance, and what proof do we need so it holds up in audits and leadership reviews?
B0068 Defensible mobility KPIs for CFO — In India’s corporate ground transportation and employee mobility services (EMS/CRD/ECS/LTR), what does a “defensible KPI” actually mean to a CFO, and what minimum evidence (data sources, audit trails, and reconciliation logic) is typically needed so cost-per-employee-trip and OTP% won’t collapse in an audit or board review?
A defensible KPI in corporate ground transportation is a metric whose value can be traced end-to-end from raw trip data to the GL, with clear SLA definitions and reconciliation rules that an auditor can independently re-perform. For a CFO, cost-per-employee-trip (CET) and on-time performance (OTP%) are defensible only when every number is reproducible from auditable trip logs, contracts, and billing records without manual “patchwork.”
A CFO expects CET and CPK to start from a complete trip ledger generated by the mobility platform or vendor systems. That ledger must include timestamps, routes, employee IDs or cost centers, vehicle tags, and SLA flags for each EMS, CRD, ECS, or LTR trip. Billing lines need to map one-to-one or many-to-one to those trips through tariff mapping and clearly documented rules for minimum charges, dead mileage, night premiums, and cancellation logic. Reconciliation then ties aggregated trip costs to centralized billing systems and finally to ERP/Finance, with variance reports explaining any gap.
OTP% is only defensible when the definition of “on time” is fixed in SLAs and applied algorithmically to raw GPS or telematics data. Each trip’s planned pickup/drop time and actual time must be captured, with late reasons and exception codes logged and preserved. Centralized command-center or NOC tools, alert supervision systems, and transport dashboards need to maintain immutable history of route adherence, SOS events, and exceptions to support later audits.
Minimum evidence typically includes three layers. First, primary data sources such as trip-level logs from driver and employee apps, GPS traces, routing/NOC systems, and HRMS-linked rosters. Second, audit trails that show who changed what and when in rosters, tariffs, and trip closures, including Maker–Checker controls for billing and compliance dashboards. Third, reconciliation logic and reports that demonstrate how trip logs roll up into CET, CPK, and OTP%, and then match centralized invoices and payment records.
images: 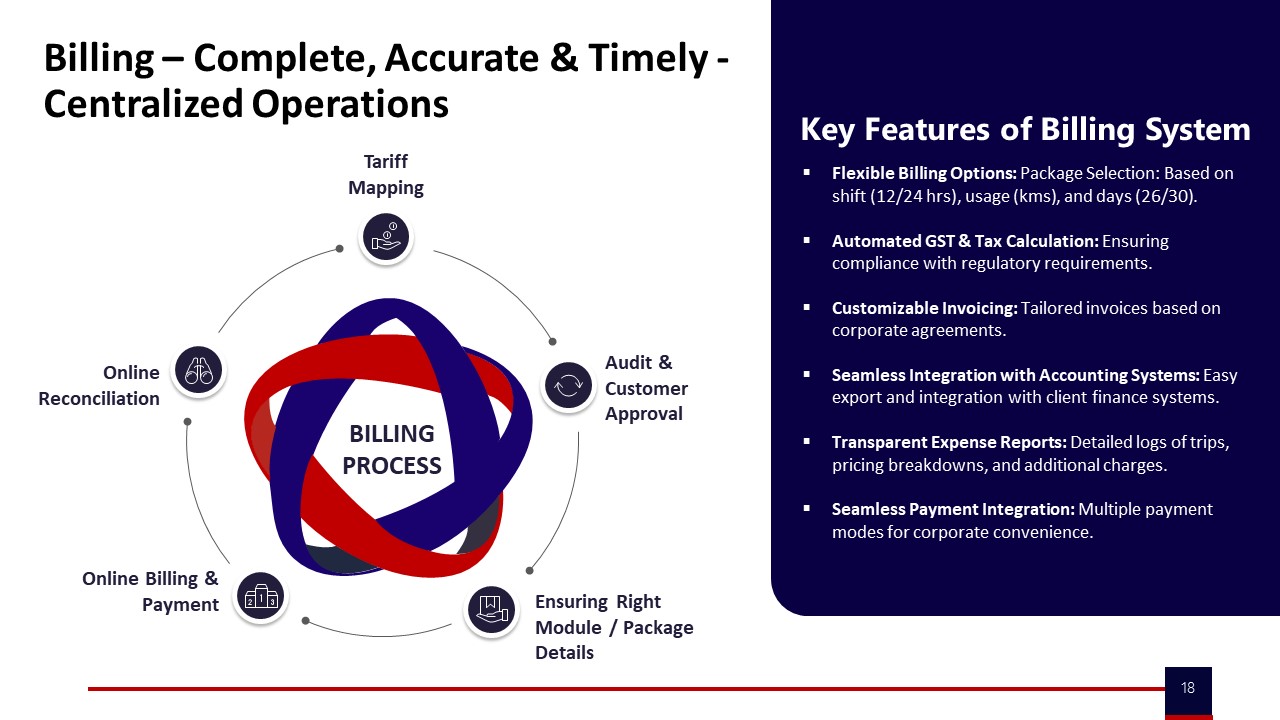
images: 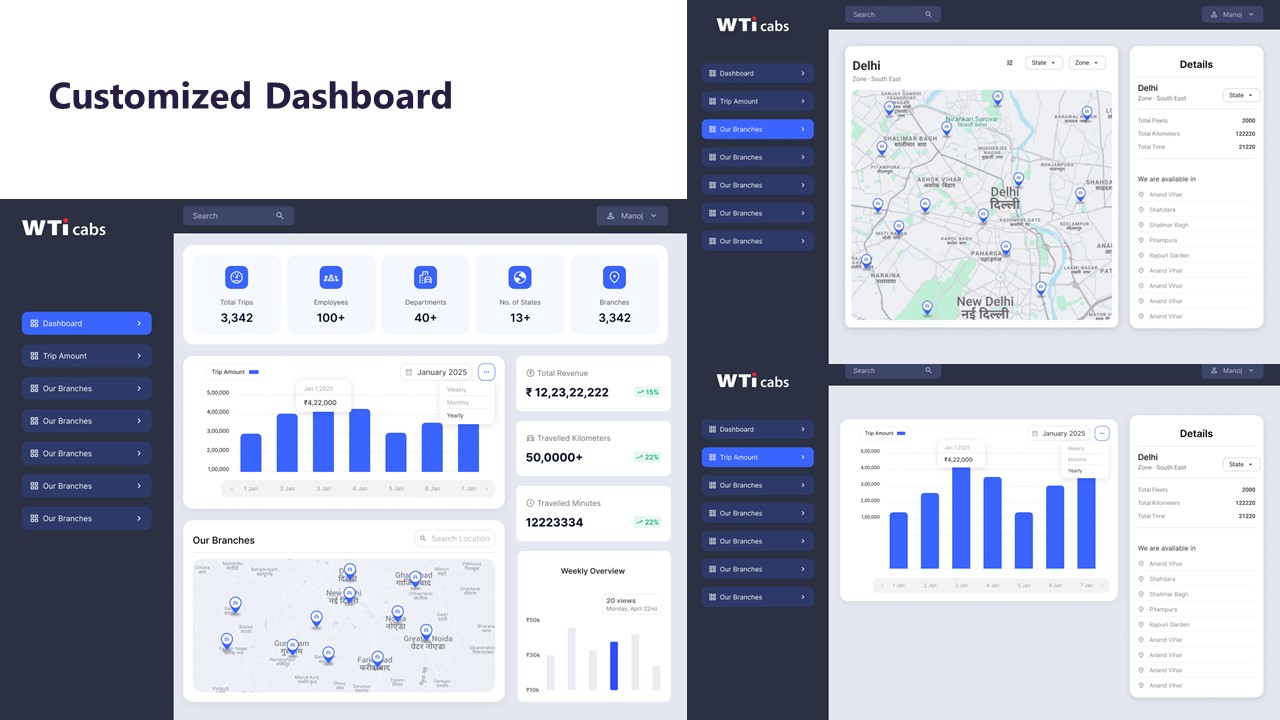
For EMS and corporate rentals, how do we pick the few KPIs that really matter—OTP, safety, NPS, emissions, cost—so we don’t end up optimizing the wrong things?
B0069 Choosing KPIs that drive behavior — In India’s enterprise employee transport (EMS) and corporate car rental (CRD), how should leadership decide which outcomes matter most—OTP%, trip adherence, safety incidents, CEI/NPS, gCO₂/pax-km, EV ratio, or cost-per-trip—without creating a dashboard that looks good but drives the wrong behaviors on the ground?
In enterprise employee transport and corporate car rental, leadership should prioritize a small, tiered set of outcome metrics that directly reflect risk, shift continuity, and cost control, then treat all other metrics as diagnostic drill-downs rather than board-level targets. A practical pattern is to anchor on safety and reliability first, cost and utilization second, and ESG and experience as governed, auditable outcomes tied to real data rather than vanity scores.
A common failure mode is giving every metric equal weight. That usually rewards metric-gaming and local firefighting instead of predictable shift starts and zero-incident operations. Most organizations that avoid this define a “short list” of primary outcomes, then map each dashboard widget to a specific decision or escalation, with clear SOPs for Transport, HR, and vendors.
For EMS and CRD in India, four primary outcome clusters tend to work as the “spine” of decision-making:
- Reliability: OTP% and Trip Adherence Rate, backed by exception detection-to-closure time.
- Safety & Compliance: safety incident rate, escort and women-safety compliance, audit trail integrity.
- Cost & Utilization: cost per employee trip and vehicle utilization, supported by dead mileage and Trip Fill Ratio.
- ESG & Experience: EV utilization ratio and commute experience index, but only when each is tied to traceable trip and telematics data.
Leadership should then define explicit use-cases for each metric. OTP% should drive routing, fleet mix, and driver fatigue management. Incident rate and compliance metrics should drive corrective training and vendor governance. Cost-per-trip should inform commercial models and vendor rationalization. EV ratio and gCO₂/pax-km should feed ESG disclosures and fleet-electrification roadmaps, not override reliability decisions on critical night or high-mileage routes.
Short, written guardrails help prevent “good-looking” dashboards that create the wrong behavior. For example, no target should reward high seat-fill if it degrades women’s night-shift safety. No EV ratio target should allow avoidable trip failures due to weak charging topology. No cost-per-trip goal should incentivize cutting standby buffers where OTP risks are highest.
The most resilient setups treat the dashboard as an operational control-room tool, not just a reporting surface. Metrics are grouped by who acts on them (Transport, HR, Finance, ESG), which SLA or SOP they trigger, and what happens when thresholds are breached. This keeps the leadership view honest and ensures that every chart on the wall corresponds to a real decision lever, not a cosmetic score.
In EMS, HR, Ops, and Finance often argue about what counts as “on time” or “adherent”—what governance setup stops KPI debates from becoming blame games during escalations?
B0070 Preventing OTP definition disputes — In India’s corporate ground transportation programs, how do HR, Facilities/Transport, and Finance typically disagree on the definition of OTP% and trip adherence in employee mobility services (EMS), and what governance approach prevents “metric fights” from turning into blame during escalations?
In Indian employee mobility services, HR, Transport, and Finance usually treat OTP% and trip adherence as three different things, which creates “metric fights” during escalations unless governance rules are fixed upfront and shared.
HR tends to define OTP% from the employee’s lived experience. HR usually counts a trip as delayed if the pick-up or drop affects login time, safety comfort, or perceived fairness. HR often ignores vendor excuses about traffic or roster cuts and focuses on impact to attendance, complaints, and morale. Trip adherence for HR is about whether the promised route, escort rules, and night-shift safety protocols were actually followed.
Facilities/Transport usually define OTP% operationally. Transport teams focus on GPS time stamps at gate or pick-up point, pre-agreed grace windows, and whether drivers followed dispatch instructions. They may exclude last-minute roster changes, no-shows, or client-side delays from “failures.” Trip adherence is seen as route compliance, dead-mile caps, vehicle utilization, and exception handling under real constraints like traffic, weather, and driver fatigue.
Finance usually defines OTP% and trip adherence through billing logic. Finance looks at which trips are billable, which penalties apply, and what SLA breaches should trigger credits or disputes. OTP% is often counted only on “valid trips” as per contract definitions. Trip adherence is interpreted as compliance with commercial terms such as duty hours, kilometers, and agreed service windows that justify charges.
A governance approach that prevents metric disputes becoming blame requires a single, contract-bound measurement library. The library should define OTP%, grace times, valid vs invalid trips, and trip adherence rules in precise, data-driven terms before operations start. It should also bind all parties to a common data source, such as a command center dashboard and unified trip ledger, rather than fragmented reports from HR, Transport, or vendors.
The governance model should place these definitions under a formal mobility governance board or equivalent cross-functional steering forum. This forum should include HR, Transport, Finance, Security, and IT and should approve metric definitions once, then change them only through controlled revisions. The same forum should link these metrics to incentives, penalties, and vendor scorecards so that escalations refer back to agreed rules, not role-based reinterpretations.
To avoid blame during escalations, organizations should separate three layers in SOPs. One layer is factual measurement that comes from the common data platform. The second layer is root-cause classification that distinguishes vendor faults from policy, roster, or infrastructure issues. The third layer is consequence mapping that defines which function acts on which class of failure. This separation allows HR to focus on employee impact and communication, Transport to address operational fixes, and Finance to apply or waive commercial actions without re-litigating whether a trip was “on time.”
In EMS, what’s the real difference between trip adherence and route adherence, and how does that affect how Ops and HR manage attendance issues?
B0075 Trip vs route adherence meaning — In India’s enterprise mobility programs, what is the practical difference between “trip adherence” and “route adherence” for employee mobility services (EMS), and how do those definitions change governance conversations between Facilities/Transport heads and HR when shift attendance is impacted?
Trip adherence and route adherence describe two different layers of “did the commute actually run as planned” in Indian employee mobility services. Trip adherence focuses on whether each scheduled trip happened as per plan, while route adherence focuses on whether the vehicle followed the approved path and stop sequence for that trip.
Trip adherence is typically measured at the shift–trip level. It checks if the planned pickup and drop times, vehicle allocation, and employee boarding were executed as scheduled. Facilities and Transport teams use trip adherence to explain on-time performance, missed trips, cancellations, and no-shows, which tie directly into shift attendance, login delays, and productivity. When trip adherence is poor, governance conversations with HR revolve around coverage gaps, vendor performance, rostering quality, and whether there is enough buffer capacity or better shift windowing.
Route adherence is measured at the GPS/path level. It checks if the driver followed the pre-approved route, stops, and time bands, especially for women’s night shifts and high-risk areas. This is more tightly linked to safety, compliance, and duty-of-care expectations. When route adherence is weak, the discussion with HR moves from “why was the employee late?” to “was the commute safe and compliant?”, including escort rules, geo-fencing, and audit-ready evidence for investigations.
This separation changes governance conversations. Facilities/Transport heads need to present trip adherence to defend operational reliability and OTP, and route adherence to demonstrate safety-by-design and regulatory compliance. HR uses trip adherence data to correlate transport issues with attendance and attrition, and route adherence data to defend the organization’s posture on women’s safety, risk management, and audit readiness. In mature programs, both metrics become part of SLA-linked governance, so that shift attendance discussions are no longer opinion-based but anchored in clear evidence of where the failure occurred.
For EMS KPIs like OTP, NPS, cost per trip, and emissions, who should own which metrics so accountability is clear during escalations?
B0077 KPI ownership and accountability model — In India’s employee mobility services (EMS), what governance model usually works best for KPI ownership—HR-owned experience metrics (CEI/NPS), Facilities-owned operational metrics (OTP%, adherence), Finance-owned cost metrics (CET/CPK), and ESG-owned emissions (gCO₂/pax-km)—so no one can claim the data is “someone else’s problem” during escalations?
In Indian employee mobility services, the most stable governance model puts commute KPIs under a cross‑functional mobility governance structure, while assigning clear primary ownership by metric family and making shared visibility and joint review non‑negotiable. HR usually owns experience and safety-linked indexes, Facilities/Transport owns reliability KPIs, Finance owns cost KPIs, and ESG owns emissions metrics, but all of them report into a single, governed mobility program with a command-center–style view and formal review cadence.
The governance works when there is an explicit “mobility board” or similar construct that sits above individual departments. That structure aligns EMS with centralized command-center operations, vendor governance, and outcome-linked procurement. It reduces the risk of fragmented data because transport operations, HRMS integration, billing, and emissions calculations are treated as one managed program rather than siloed projects.
A common failure mode is when OTP%, CEI, CET, and gCO₂/pax‑km are tracked in separate systems with no shared dashboard or audit trail. In those setups, HR is blamed for safety and experience, Facilities for operations, and Finance for cost, but none of them can show reconciled data during escalations. The governance model is more resilient when the command center or central mobility function curates a canonical KPI layer, enforces consistent definitions, and runs joint reviews with HR, Finance, Procurement, ESG, IT, and Security on a fixed cadence.
To keep KPIs from becoming “someone else’s problem,” organizations typically need three elements:
- A single EMS service catalog and SLA framework agreed by HR, Facilities, Finance, and ESG.
- A unified data and observability layer where OTP, CEI, CET, and emissions share the same trip ledger and audit trails.
- Outcome-linked contracts where vendors are governed on the same KPI set that internal teams review, so external and internal accountability stay aligned.
If we have multiple mobility vendors across cities, how do we keep KPI math consistent so Procurement can compare them fairly and we don’t get stuck with one vendor’s definitions?
B0078 Standardizing KPIs across vendors — In India’s corporate mobility operations, what are the most credible ways to ensure KPI calculations (OTP%, CET, gCO₂/pax-km) are consistent across multiple vendors and regions, so Procurement can compare “apples to apples” and avoid getting trapped in vendor-specific definitions?
In India’s corporate mobility operations, the most credible way to get “apples to apples” KPIs across vendors and regions is to take KPI definition and data ownership away from individual vendors and anchor it in an enterprise-wide, procurement-governed standard. The enterprise must publish one canonical KPI library, one data schema, and one source-of-truth process that every vendor’s data must map into.
A common failure mode is allowing each vendor to define its own On-Time Performance or Cost per Employee Trip. Procurement then gets impressive but incomparable numbers. To avoid this, organizations need a KPI dictionary that precisely defines OTP%, CET, and gCO₂/pax‑km, including time windows, inclusions and exclusions, handling of partial trips, dead mileage, and cancellations. Every contract should mandate conformance to this dictionary.
Consistency improves when raw trip and telematics data flows into an enterprise-controlled mobility data layer instead of remaining in fragmented vendor portals. A normalized schema for trips, vehicles, employees, timestamps, distances, and vehicle type lets Procurement and Finance recalculate KPIs centrally and challenge vendor-reported figures.
Robust comparison also depends on outcome-linked SLAs that reference the same KPI definitions for all Employee Mobility Services, Corporate Car Rental, and project/event commute vendors. Procurement can then benchmark OTP%, CET, and emissions intensity across cities and suppliers using unified dashboards, supported by auditable GPS logs and billing data.
Practical guardrails that materially reduce “definition gaming” include:
- A written KPI handbook owned by Procurement and Finance.
- Standardized trip lifecycle events (accept, start, pickup, drop, cancel) across all tech stacks.
- Contracts that treat vendor dashboards as advisory, and the enterprise data lake as the authoritative record.
- Periodic route adherence and invoice audits, using the same semantics in every location.
From an IT viewpoint, how do we judge whether EMS KPIs are based on reliable HRMS/attendance/access-control/GPS data without creating fragile integrations we’ll be stuck maintaining?
B0079 KPI data sources vs integration debt — In India’s employee transport (EMS), how should a CIO evaluate whether mobility KPIs are built on reliable data sources—HRMS rosters, attendance, access control logs, GPS/telematics—without the enterprise taking on brittle integrations and long-term maintenance debt?
In India’s employee transport, CIOs should treat mobility KPIs as untrustworthy until every source system (HRMS, attendance, access control, GPS/telematics) is integrated through a governed, API-first data layer that they control instead of point-to-point vendor customizations. Reliable KPIs depend on traceable trip and roster data, standardized schemas, and auditable pipelines, not on dashboards alone.
CIOs should first insist on a clear data architecture from any EMS platform that shows how HRMS rosters, attendance, access systems, and vehicle telematics land in a mobility data lake or equivalent governed store. Each feed should have defined ownership, schema contracts, and versioning so roster changes, shift windows, and employee status updates do not silently break downstream KPIs like OTP, Trip Adherence Rate, or Cost per Employee Trip.
A common failure mode is allowing the vendor to build bespoke, tightly coupled integrations into HR or access control systems. This increases maintenance debt and makes exit or re-tendering difficult. CIOs should instead require API-based connectors, documented Trip Ledger APIs, HRMS Integration points, and explicit SLOs for sync latency, so mobility services can evolve without rewriting core integrations.
To reduce brittleness, CIOs should ask for automated data-quality checks around every key KPI input. Examples include roster vs trip manifest reconciliations, GPS and trip-log consistency checks, incident and SOS log integrity, and audit-trail completeness for compliance and safety metrics. These controls should be visible on a centralized compliance dashboard and command-center tooling, not buried in vendor code.
images:

With DPDP and employee trust in mind, how should we design mobility KPIs so we can prove safety/compliance without it feeling like surveillance?
B0080 KPI governance under DPDP trust — In India’s corporate ground transportation under the DPDP Act context, how should Legal and IT shape KPI requirements so safety and compliance metrics can be proven (audit trails, incident evidence) without crossing into surveillance overreach that damages employee trust and HR credibility?
Legal and IT in India’s corporate ground transportation should co‑design KPIs so every safety or compliance metric is backed by auditable trip data, but only within a clearly defined, legally justified data set with strict access, retention, and purpose limits under the DPDP Act. The KPI framework should track route adherence, OTP, incident response, credentialing, and EV/ESG metrics at an aggregate or pseudonymous level, while restricting person‑level visibility to specific, time‑bound incident workflows with HR and Security oversight.
Legal should first fix the lawful purposes for mobility data under the DPDP Act. These typically include duty of care, statutory transport compliance, incident investigation, and fraud or abuse prevention. Each KPI must map to one of these purposes. Any KPI that cannot be traced back to a clear purpose and legal basis should be excluded or redesigned.
IT should then translate those purposes into data-minimized telemetry. GPS and telematics should capture only what is required for safety and SLA evidence. For example, route adherence and Trip Adherence Rate can be computed from trip logs without streaming continuous employee location outside trip windows. OTP and exception-closure SLAs can be measured with timestamped trip lifecycle events rather than continuous background tracking of employee devices.
Legal and IT should also separate operational observability from employee surveillance. Command center dashboards should show route performance, Fleet Uptime, Incident Rate, and Safety Escalation SLA at vehicle or route level. Named, person-level views should be available only when there is an active incident ticket, a compliance breach, or a documented audit, and each access should be logged for later review.
To protect HR credibility, Legal and IT should explicitly block KPIs that enable covert performance scoring of individuals via transport data. Commute logs should not become proxies for attendance rating, productivity scoring, or behavioral profiling beyond what is transparently disclosed and contractually agreed with employees.
A robust control set usually includes:
- Documented KPI catalog that lists for each metric: purpose, data fields used, DPDP legal basis, and maximum retention.
- Role-based access where CHRO, Security/EHS, Transport, and vendors see only the minimum data needed for their function.
- Immutable audit trails for trip logs, incident workflows, and access to sensitive records, supporting investigations without broad exposure.
- Regular joint reviews by Legal, IT, HR, and Security to retire or redesign KPIs that drift toward surveillance or are no longer purpose‑justified.
By designing KPIs this way, organizations can still prove safety and compliance outcomes—such as women‑safety routing, driver KYC/PSV currency, incident closure SLAs, and EV utilization for ESG disclosures—while keeping employee trust intact and HR positioned as a protector of dignity rather than an extension of surveillance.
Which mobility KPIs are easiest for vendors to game, and what simple guardrails keep reporting honest without making Ops police everything?
B0081 Preventing KPI gaming by vendors — In India’s enterprise mobility programs, what KPIs tend to be the most “gameable” by vendors (for example OTP% or utilization metrics), and what governance guardrails help keep KPI reporting trustworthy without turning operations into constant policing?
In India’s enterprise mobility programs, the most “gameable” KPIs are those that are easy to redefine in the vendor’s favor and hard for the client to independently reconstruct from raw data. The highest-risk metrics are typically On-Time Performance (OTP%), utilization and seat-fill metrics, safety/compliance statistics, and cost KPIs like cost per km or cost per employee trip when they are not tied to a transparent trip ledger and audit trail.
Vendors can game OTP% by redefining grace windows, excluding cancelled or re-routed trips, or treating partial fulfilment as “on time.” Utilization and Trip Fill Ratio can be inflated by counting dead mileage as productive distance or by selectively excluding low-load routes. Safety and incident metrics become unreliable when near-misses, SOS triggers, or minor events are under-reported or reclassified to avoid penalties. Cost metrics become cosmetic when dead mileage, waiting time, and no-show handling are buried in opaque billing lines instead of being visible in an end-to-end ETS or CRD operation cycle with clear tariff mapping.
Governance guardrails work best when they shift from trust in reported percentages to trust in underlying trip-level evidence. A robust model establishes a canonical trip ledger with immutable timestamps, GPS traces, and status codes that can be sampled and audited. OTP and route adherence should be calculated from this ledger with agreed formulas, not from vendor summaries. Safety, compliance, and women-safety KPIs are more trustworthy when there is a centralized command center or NOC that monitors alerts, geofence violations, and SOS escalations in real time, with closure SLAs and a clear escalation matrix.
Stronger controls focus on outcome-linked contracts that use multiple converging indicators instead of a single headline KPI. For example, OTP% can be cross-checked against no-show rates, escalation volume, and complaint closure SLAs. Utilization and cost KPIs can be reconciled with billing and invoicing flows and centralized billing features that expose tariff mapping, online reconciliation, and exception buckets. Compliance and safety metrics gain credibility when supported by centralized compliance management and continuous assurance loops rather than episodic audits.
The most effective guardrails avoid turning the relationship into permanent policing by embedding governance into normal operations. This includes clear definitions of each KPI in the RFP and contract, API access to raw trip and telematics data for independent analytics, and periodic joint route adherence and random route audits. A multi-tier engagement and escalation model that ties vendor councils, QBRs, and management reports to auditable dashboards and ESG or CO₂ dashboards helps keep numbers aligned with reality. In practice, KPI trustworthiness improves when both sides agree that data-driven insights, not cosmetic numbers, drive cost optimization, safety assurance, and EV transition decisions across EMS, CRD, ECS, and long-term rental programs.
For mobility RFPs, how do we turn OTP, NPS, safety, emissions, and cost into a scoring model we can defend later when HR and Finance want different things?
B0082 Defensible RFP scoring for mobility — In India’s corporate mobility procurement, how should a Category Manager translate outcome definitions (OTP%, CEI/NPS, safety, emissions, cost) into an RFP scoring model that is defensible a year later—especially when HR is pushing for experience and Finance is pushing for CET control?
Category Managers in India’s corporate mobility buys need to convert outcome definitions into a small, fixed scoring spine that explicitly balances reliability, experience, safety, ESG, and cost. The RFP must weight these outcomes up front, tie them to measurable KPIs and data sources, and preserve that structure into contract SLAs and QBR reviews so the scoring remains defensible a year later.
The most robust pattern is to design the RFP scoring around 4–6 outcome buckets rather than dozens of fragmented line items. Each bucket should map to mobility KPIs that already exist in EMS/CRD/ECS/LTR operations such as OTP%, Trip Adherence Rate, Cost per Employee Trip, incident rate, and EV utilization ratio. The RFP should ask vendors to submit historical data, sample dashboards, and reference programs that evidence these metrics, not just narrative claims.
To balance HR’s experience focus and Finance’s CET control, Category Managers can fix separate score bands for cost and for outcomes. Cost can be a capped band (for example, 30–40% of total score) using CET/CPK and TCO transparency, while service outcomes carry the remainder, split across reliability, safety/compliance, experience, and ESG. Within each non-cost band, the RFP can demand threshold criteria for eligibility and then comparative scoring above that threshold.
- Reliability: OTP%, exception closure time, fleet uptime, with auditable trip logs.
- Safety & Compliance: incident rate, driver KYC/PSV currency, women-safety controls, audit trail integrity.
- Experience: Commute Experience Index / NPS, complaint closure SLAs, app UX and adoption.
- ESG: EV utilization ratio, emission intensity per trip, reporting maturity for Scope 3 disclosures.
- Cost & Commercials: CET/CPK baselines, dead-mile policies, outcome-linked penalties/incentives, exit and data-portability clauses.
The RFP should require vendors to agree that these same KPIs and weights become the basis of quarterly performance reviews and incentive/penalty calculations. Category Managers can then document the original scoring grid, the signed SLA schedule, and one year of QBR scorecards in a single file. This creates a clean audit trail that shows how the chosen vendor was selected, how their performance is measured, and how HR’s experience priorities and Finance’s cost controls were both incorporated from the outset.
For EMS Ops teams, what KPIs show real toil reduction—less manual work, fewer escalations, quicker closures—and how do we make Finance value that, not just cost per trip?
B0083 Measuring toil reduction in EMS — In India’s employee mobility services (EMS), what KPI set best reflects “toil reduction” for the Facilities/Transport team (fewer manual reconciliations, fewer escalations, faster exception closure), and how can those operational gains be made visible to Finance so the program isn’t judged only on cost-per-trip?
In India’s employee mobility services, toil reduction for Facilities/Transport is best captured through a KPI set that measures exception volume, exception handling speed, and manual effort removed from the operation, then links those metrics to Finance’s views on reliability, compliance, and cost control rather than just cost-per-trip.
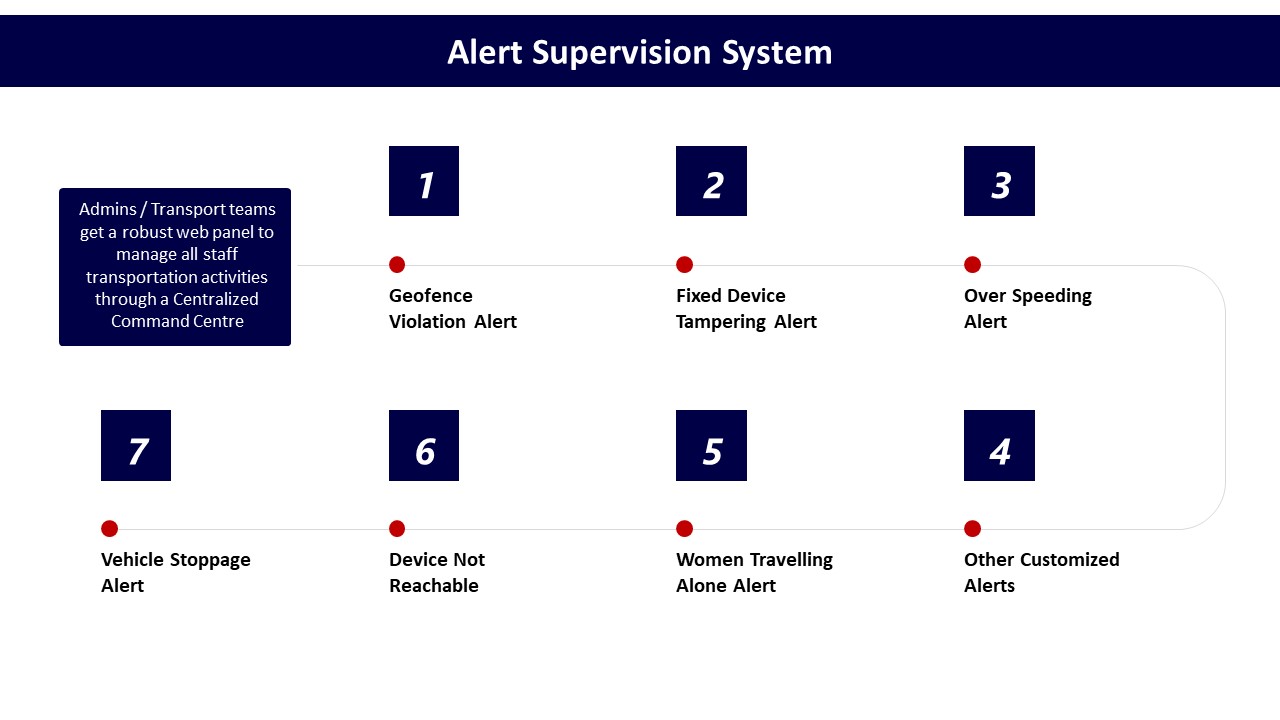
A practical KPI stack for toil reduction starts with incident and exception metrics. Facilities teams can track total daily transport escalations, the number of trips requiring manual intervention, and exception detection-to-closure time. These indicators reflect how often the transport head is forced into firefighting and how quickly the command center processes can restore normal operations. Command-center tooling, alert supervision systems, and dynamic routing during disruptions are designed to reduce this exception load and improve closure SLAs.
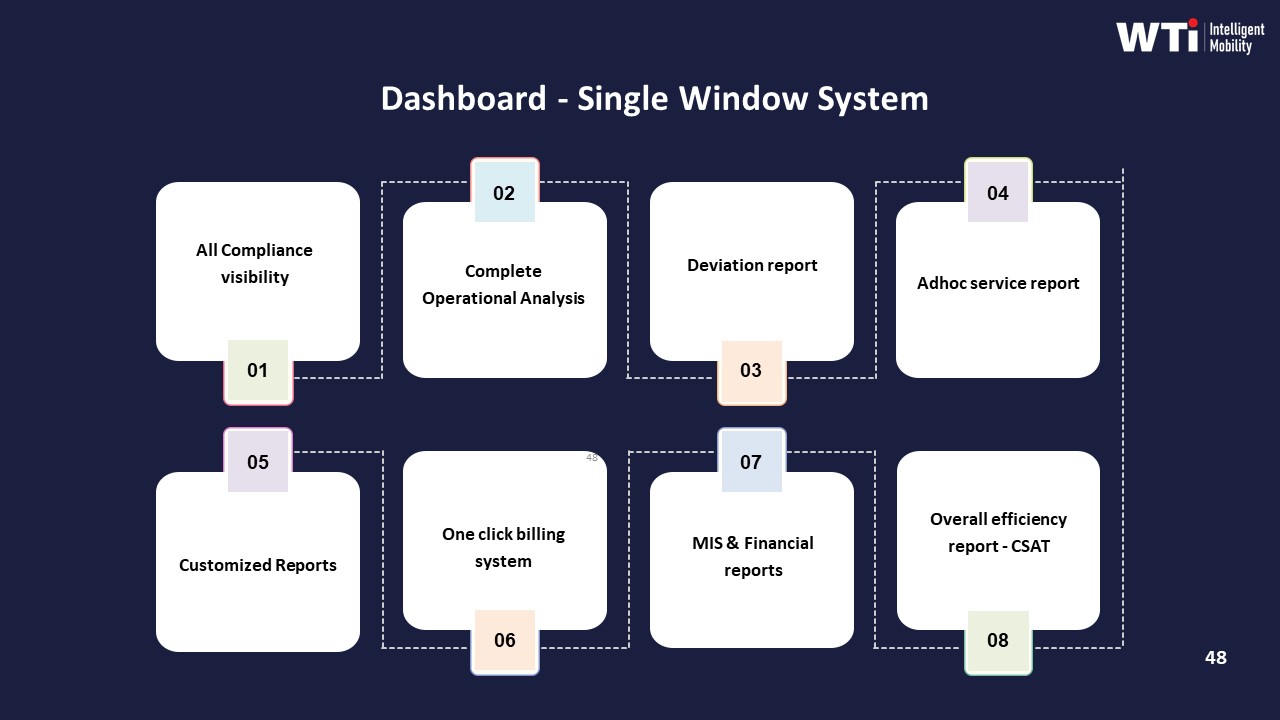
Facilities teams can also use process and automation KPIs to show reduced manual work. Automated rostering, GPS-based trip verification, centralized compliance management, and integrated driver apps are intended to lower manual reconciliations and paperwork. Indicators such as the percentage of trips fully closed in-app, billing disputes per billing cycle, and manual roster edits per shift help quantify this reduction in toil. These metrics are supported by dashboards, data-driven insights platforms, and single-window control-room reporting.
To make these gains visible to Finance, Facilities teams can align toil KPIs with Finance-relevant outcomes. Fewer escalations and faster resolution reduce SLA penalties and revenue leakage, which supports predictable mobility spend. Lower manual reconciliation errors and fewer billing disputes are closely tied to centralized billing systems, transparent billing models, and auditable billing processes. Finance can view these outcomes through management reports that combine OTP, exception closure SLAs, dispute counts, and invoice-acceptance rates alongside cost-per-trip, ensuring that the EMS program is evaluated on reliability, audit readiness, and governance quality as well as pure unit cost.
images:
How can we link EMS KPIs like OTP, adherence, and NPS to outcomes like attendance and attrition without overselling causality and getting challenged by Finance or Audit?
B0086 Credible linkage of KPIs to outcomes — In India’s corporate employee transport (EMS), what is a realistic way to connect mobility KPIs (OTP%, adherence, CEI/NPS) to business outcomes like attendance stability and attrition risk without overstating causality and losing credibility with Finance and Internal Audit?
In India’s employee mobility context, the most realistic way to link transport KPIs to outcomes like attendance stability and attrition risk is to treat mobility as a contributing driver, not a sole cause, and to show consistent patterns over time rather than claiming one-to-one causality. Transport teams gain credibility with Finance and Internal Audit when they present clean baselines, controlled comparisons, and clear language such as “associated with” or “contributes to” instead of “causes.”
A practical approach is to first stabilize and instrument core mobility metrics such as On-Time Performance (OTP%), Trip Adherence Rate, and a Commute Experience Index (or NPS-style score). These should be measured consistently across routes, shifts, and vendors, with auditable trip logs, GPS traces, and closure SLAs so that Internal Audit can verify the data lineage. Only after several months of stable, reliable measurement does it make sense to overlay HR outcomes such as late login trends, no-show rates, and team-level attendance volatility.
The next step is to work with HR and Finance to run simple, transparent comparisons instead of complex black-box models. Examples include before–after comparisons for a site where routing or OTP improved, or side-by-side comparisons between high-OTP and low-OTP corridors matched on shift type and headcount. Where patterns are visible—such as lower late login rates in high-OTP routes—the narrative should explicitly frame mobility as one of several factors alongside manager behavior, workload, and wider HR policies.
To retain Finance’s trust, mobility teams should avoid monetizing every effect or attributing all attrition change to transport. It is usually more acceptable to quantify directional ranges and operational benefits, such as reductions in late-logins or fewer escalations, and then let Finance decide if and how to translate those into rupee terms. Documented assumptions, versioned KPI definitions, and a shared data dictionary across transport, HR, and Finance help prevent disputes about numbers later.
In practice, organizations that succeed in this linkage use three safeguards. They keep the measurement model simple and auditable. They separate correlation insights (“sites with CEI above a threshold have fewer commute complaints and lower late-login rates”) from stronger causal claims. They review results jointly in a governance forum that includes HR, Transport, and Finance, so that any narrative about attendance or attrition impact is collectively owned rather than pushed by one function alone.
When cost per trip, OTP, and NPS pull in different directions, how do we decide the priority and stop teams from cherry-picking metrics to win arguments?
B0087 Resolving KPI trade-offs and trust — In India’s enterprise mobility services, how should a cross-functional steering group decide whether to optimize for cost-per-employee-trip, OTP%, or CEI/NPS when these goals conflict, and how do leaders prevent “metric cherry-picking” that erodes trust between HR, Operations, and Finance?
In enterprise mobility, a steering group should treat cost-per-employee-trip (CET), On-Time Performance (OTP%), and Commute Experience Index/NPS (CEI) as a constrained hierarchy, not competing vanity metrics. OTP% and safety-compliant reliability form the non‑negotiable floor, CEI validates that “reliability feels real” to employees, and CET is optimized within those guardrails so Finance can defend unit costs and audits.
The steering group gains control when it fixes red‑lines first. OTP% should have a minimum threshold aligned to shift needs and safety rules, for example the level at which attendance and women‑safety policies remain intact. Safety and compliance indicators, such as incident rate, escort adherence, and audit trail integrity, sit alongside OTP% as hard gates. CEI/NPS then acts as an early‑warning signal for hidden friction like confusing boarding flows or driver behavior that does not show up in OTP%. CET is tuned after these thresholds through routing optimization, fleet mix, and dead‑mileage reduction, so savings come from efficiency, not under‑servicing.
Leaders prevent “metric cherry‑picking” by locking a cross‑functional scorecard and decision rules into governance. HR, Transport, Finance, ESG, and Security should agree one common KPI set and targets, with explicit trade‑off rules, such as “no cost initiative is approved if modeled OTP% or safety compliance drops below target” or “productivity or attrition impacts must be reviewed before CET cuts are adopted.” A centralized command center and data lake help ensure HR, Operations, and Finance all see the same trip logs, exceptions, and billing data, which reduces arguments about “whose numbers are right.”
Clear SOPs for how changes are tested also reduce mistrust. New routing policies or EV transitions should run as time‑boxed pilots with baseline vs. post‑change CET, OTP%, incident data, and CEI. The steering group should review these as “evidence packs,” not anecdotes, and only then scale. Outcome‑linked contracts with vendors further anchor behavior by tying payouts or penalties to a small set of agreed KPIs instead of one department’s favorite measure.
To make this work day to day, the steering group can define a simple operating cadence: - HR and Transport review OTP%, safety incidents, and CEI weekly, using command‑center data. - Finance and Procurement review CET, dead mileage, and utilization monthly, using the same trip ledger. - Quarterly, the full steering group adjusts targets or commercials only via documented decisions that show impact across OTP%, CEI, and CET.
When all three metrics are viewed through a single, governed dashboard, and when change approvals require showing impact on each, departments have less room to highlight only the metric that suits their narrative, and more incentive to converge on decisions that keep operations stable, employees safe, and costs defensible.
When selecting a mobility vendor, what KPI governance features show they’re enterprise-grade so we’re not stuck with spreadsheets and monthly reconciliation drama?
B0088 Enterprise-grade KPI governance signals — In India’s corporate mobility vendor selection, what KPI governance capabilities signal “enterprise-grade” maturity—such as standardized definitions, baseline methods, and source-of-truth data lineage—so the buyer isn’t forced into spreadsheet reconciliation and ad-hoc explanations every month?
In India’s corporate mobility, “enterprise-grade” KPI governance is signalled when the vendor owns end‑to‑end definitions, baselines, and data lineage so Transport, HR, and Finance do not have to reconcile spreadsheets or argue over “whose number is right” every month. A mature provider standardizes KPI semantics, automates evidence capture from trip to invoice, and exposes a single operational and ESG “source of truth” through governed dashboards and reports.
A strong signal is a single-window dashboard that combines trip logs, CO₂ reduction, safety events, compliance status, and financial metrics in one governed layer. This reduces manual collation and supports Scope 3 and ESG narratives by tying commute data to emission tracking and green-mobility dashboards.
Another marker is tech-led observability of operations and safety. Central command centres, alert supervision systems, and real-time fleet visibility indicate that OTP, route adherence, incident rates, women-safety compliance, and EV uptime are measured from live systems instead of retrospective estimates.
EV and sustainability reporting is another capability checkpoint. Vendors that can show six‑month before/after baselines for CO₂, cost per km, fleet uptime, and employee satisfaction, and link these to auditable emission dashboards, demonstrate reliable KPI definition and data lineage for ESG and CSR reports.
On the commercial side, centralized, automated billing that maps tariffs, trip records, and approval workflows into complete, accurate, and timely invoices is critical. When billing models, rate cards, and reconciliation logic are systematized, Finance is not forced into ad‑hoc checks and exception justifications.
Safety and compliance frameworks also reveal maturity. Centralized compliance management, driver and fleet induction logs, and HSSE contribution charts show that credential currency, audits, and incident responses are tracked as KPIs with traceable documentation rather than informal checks.
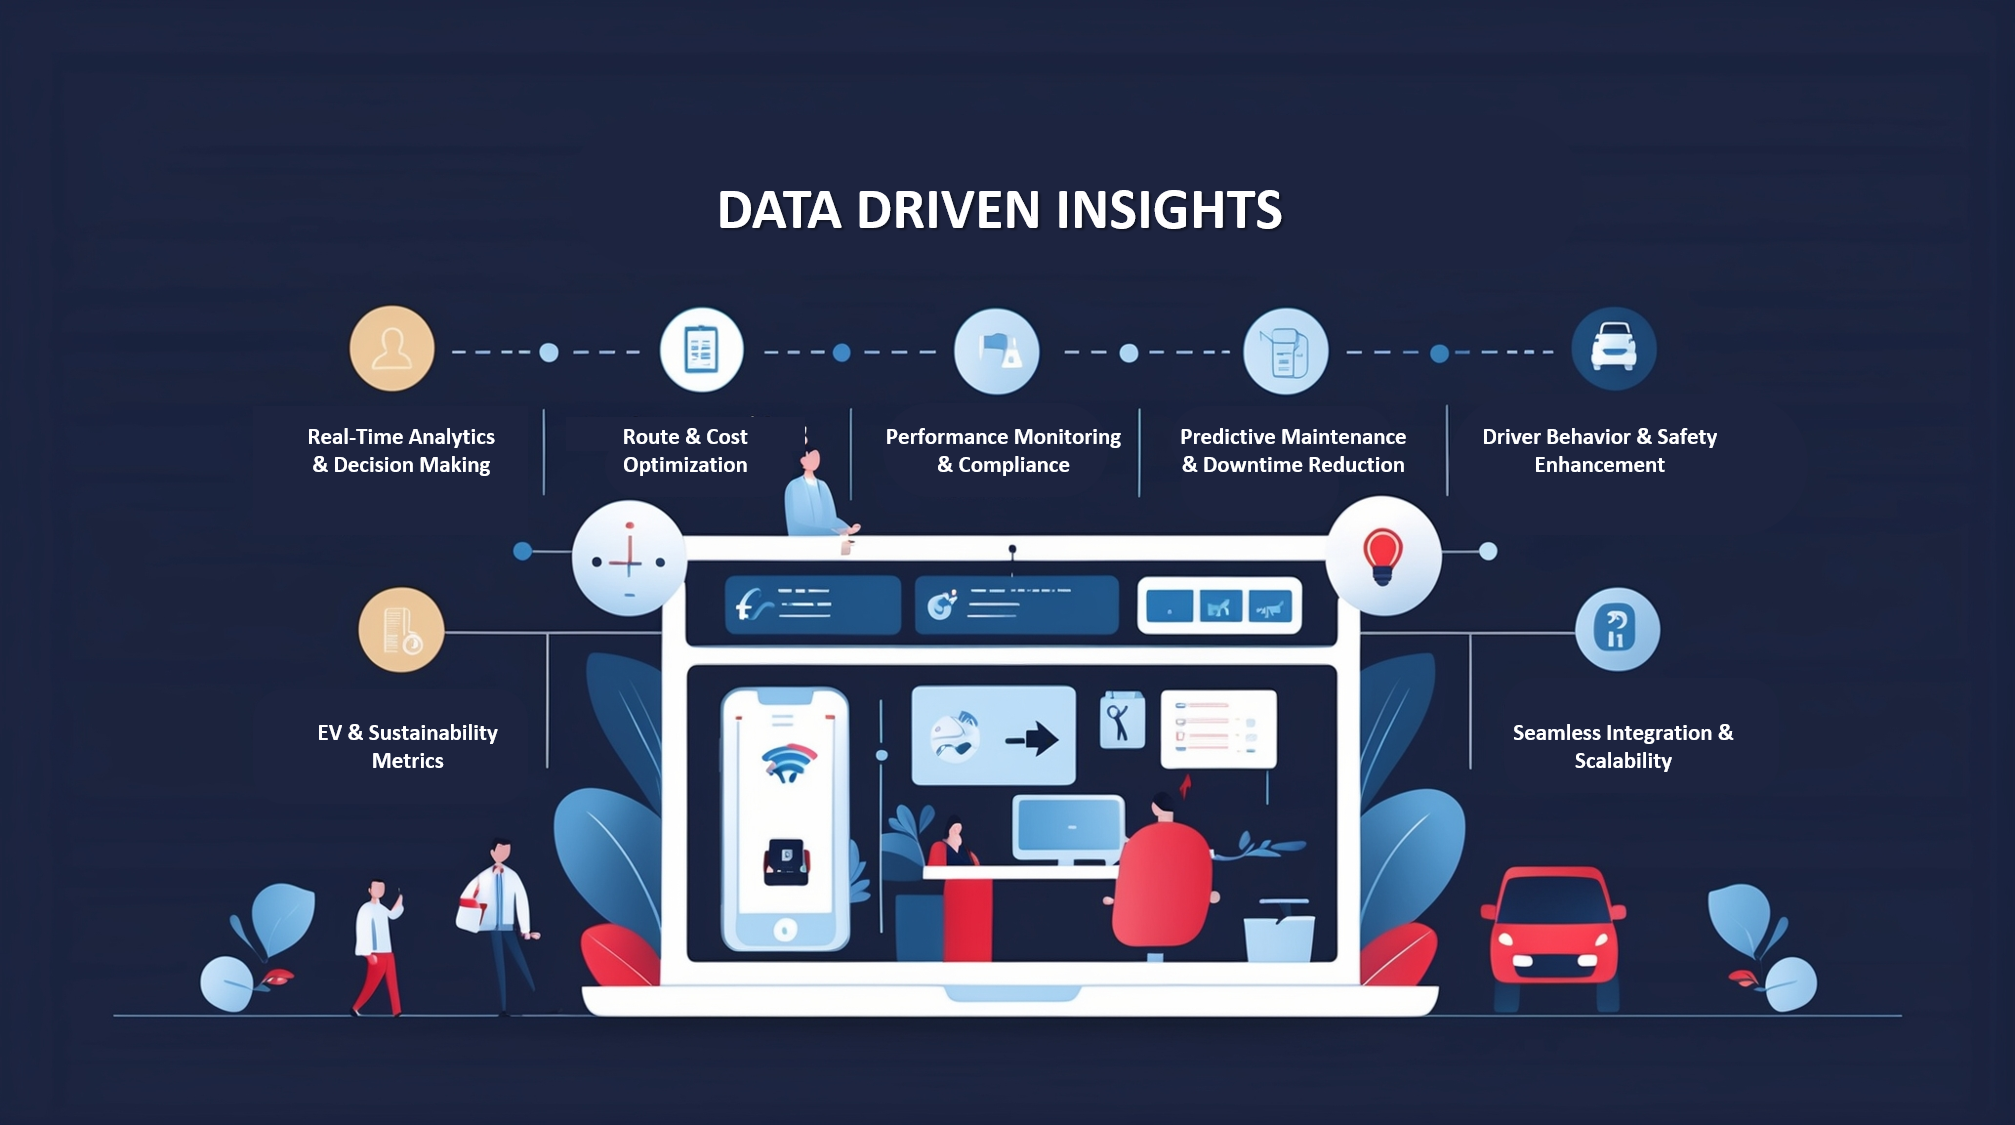
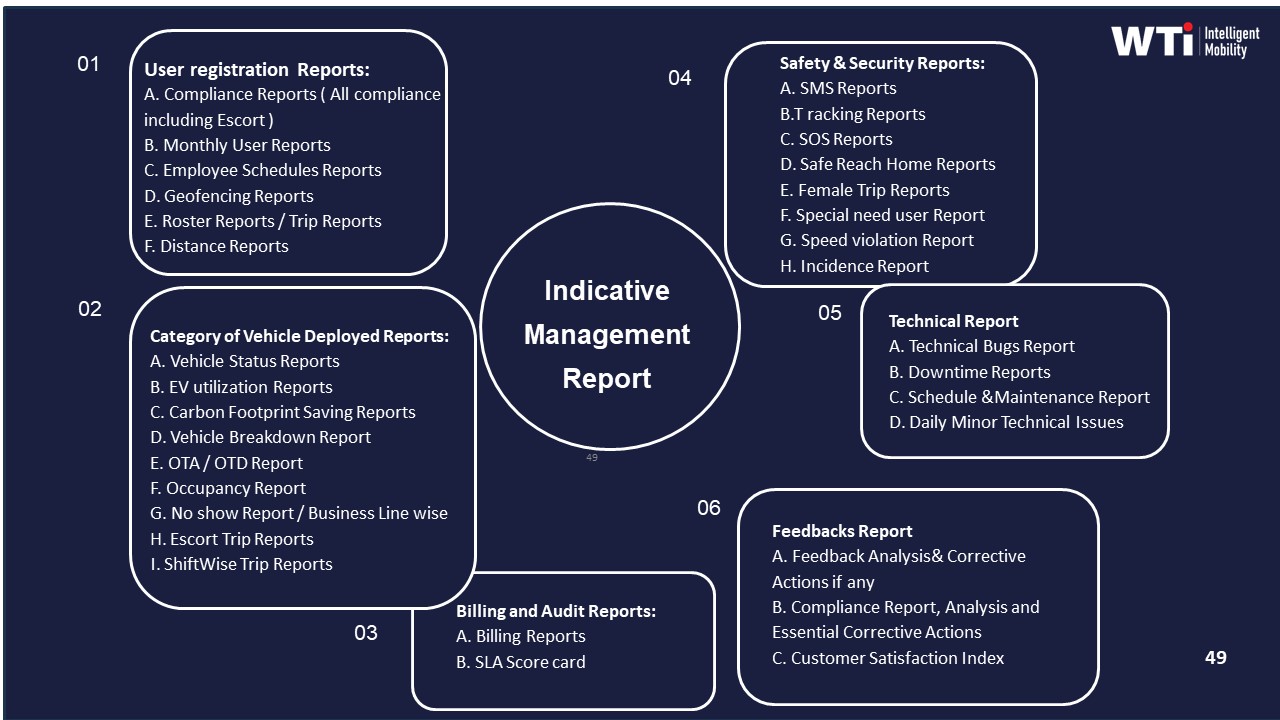
Finally, vendors that provide indicative management reports, customized dashboards, and data-driven insights across real-time analytics, route optimization, performance monitoring, and predictive maintenance demonstrate a KPI stack that is designed for repeatable governance, not one-off reporting.
From an audit standpoint, what documents and evidence should we have for mobility KPI definitions and baselines so audits don’t turn into a last-minute fire drill?
B0090 Audit expectations for KPI documentation — In India’s corporate ground transportation, what should Internal Audit expect to see as documentation for KPI definitions and baselines (for example OTP%, CET, gCO₂/pax-km) so audits don’t become a last-minute scramble across HR, vendors, and Finance?
Internal Audit should expect a single documented “KPI rulebook” plus traceable source-data references for each mobility KPI, so definitions and baselines are fixed before audits and not recreated from memory. This rulebook must cover what each KPI means, how it is calculated, where the data comes from, and which function owns its integrity across HR, Transport, Finance, ESG, and vendors.
Internal Audit can look for KPI documentation that treats OTP%, CET, or gCO₂/pax‑km as controlled objects rather than ad-hoc metrics. For reliability KPIs like On‑Time Performance (OTP%), the documentation should define what counts as “on time,” which trips are in scope (EMS vs CRD vs ECS vs LTR), how exceptions are handled, and which trip logs and GPS data form the audit trail. For cost KPIs such as Cost per Employee Trip (CET) or Cost per Kilometer (CPK), the rulebook should specify which cost heads are included, how dead mileage is treated, how billing systems map to Finance GL codes, and how reconciliations are done.
For ESG KPIs such as gCO₂/pax‑km, emission intensity per trip, or EV Utilization Ratio, Internal Audit should see written methods for emission factors, data lineage from telematics or vendor reports, and clear ties into ESG disclosures. The rulebook should link each KPI to its system of record, show data retention periods for trip and GPS logs, describe integration points with HRMS and ERP, and name accountable owners, so Internal Audit can test controls rather than chasing spreadsheets at year-end.
How do IT and Procurement make sure we own mobility KPI data and can port it if we change vendors, without losing our history and baselines?
B0092 KPI data portability and exit safety — In India’s corporate mobility ecosystem, how should a CIO and Procurement leader evaluate data ownership and portability for KPI reporting (trip logs, GPS traces, invoice mappings) so the enterprise can switch vendors without losing historical baselines or KPI continuity?
In India’s corporate mobility ecosystem, CIO and Procurement leaders should treat data ownership and portability as non‑negotiable contract and architecture requirements, because KPI reporting on trip logs, GPS traces, and invoice mappings loses integrity if data is fragmented, proprietary, or non‑exportable. Vendor evaluation should prioritize clear enterprise data rights, open and well-documented exports, and schema stability so the organization can change providers without breaking trendlines for OTP, cost, safety, or ESG metrics.
CIOs should first require that all core operational data sits in an enterprise-controlled domain or is continuously replicated into an enterprise mobility data lake. They should insist on documented schemas for trip lifecycle events, GPS telemetry, and billing references, and they should test whether APIs or bulk exports can deliver complete, timestamped, and tamper-evident records that align with HRMS and ERP identifiers. A common failure mode is allowing vendors to “own” raw GPS and trip logs while only exposing dashboards, which prevents independent recalculation of KPIs or reconstruction of incidents.
Procurement leaders should embed data-ownership clauses and portability SLAs directly into EMS/CRD/ECS/LTR contracts. Contracts should define that all trip logs, GPS traces, and invoice mappings are enterprise data, specify minimum export formats and frequencies, and link a portion of commercial payout to delivery of reconciled, machine-readable datasets. A frequent procurement risk is evaluating vendors only on per‑km rates and SLAs while ignoring whether historic baseline KPIs, like cost per employee trip or on‑time performance, can still be computed after a vendor exit.
Jointly, CIO and Procurement teams should evaluate vendors on a small set of explicit portability tests before award:
- Can the vendor provide a 12‑month, trip-level export with GPS traces and invoice IDs that reconcile to Finance and HRMS records?
- Can the same KPI definitions (OTP%, cost per km, Trip Fill Ratio) be computed independently using exported data, not only via the vendor’s dashboards?
- Can raw data be ingested into the enterprise’s own analytics stack with consistent keys for employees, vehicles, routes, and invoices?
Vendors that pass these tests reduce lock‑in, support outcome-linked contracts, and enable Procurement, Finance, and ESG teams to preserve KPI continuity even as routing engines, fleet partners, or EMS/CRD platforms change over time.
What’s a practical KPI hierarchy for mobility—leading and lagging indicators—so leadership doesn’t overreact to weekly OTP swings but still catches real issues early?
B0093 Leading vs lagging mobility KPI stack — In India’s corporate mobility services, what is a sensible “north star” KPI hierarchy (leading vs lagging indicators) that prevents leadership from overreacting to weekly OTP noise while still catching real service degradation early?
In corporate mobility services, a sensible KPI hierarchy puts a small set of leading indicators under daily control (for the Transport Head and command center) and reserves a few composite lagging indicators for leadership review on a monthly or quarterly cadence. This structure reduces overreaction to weekly on-time performance (OTP) noise while still surfacing real service degradation early.
Leading indicators work best when they are operational, predictive, and tightly linked to controllable levers such as routing, fleet mix, and driver management. Typical leading indicators in India’s employee mobility services include shift-wise OTP bands by corridor, exception detection-to-closure time from the command center, trip adherence rate on planned routes, driver fatigue or duty-cycle breaches, vehicle uptime, and EV-specific telemetry such as state-of-charge at trip start and charger availability. These metrics help the Facility or Transport Head and the 24x7 command center spot emerging problems like chronic late starts on a given hub, a vendor-specific dip in fleet uptime, or a pattern of safety exceptions before they become HR- or board-level issues.
Lagging indicators are better framed as composite, outcome-level KPIs tied to business impact, and they should move slower by design. The core lagging indicators in an Indian EMS or CRD program typically include aggregated OTP% over a month or quarter, commute experience or satisfaction indices linked to HR data, safety and incident rates with full audit trails, unit cost measures such as cost per employee trip and dead-mileage ratios, and sustainability outcomes like EV utilization ratio and gCO₂ per passenger-kilometer. These indicators give CHRO, CFO, ESG, and leadership a stable view of whether reliability, safety, cost, and ESG performance are structurally improving or deteriorating without being distorted by week-to-week volatility.
A practical governance pattern is to wire leading indicators into the command center and transport desk dashboards for daily and weekly stand-ups, and reserve lagging indicators for structured monthly or quarterly reviews with HR, Finance, and ESG stakeholders. This separation allows operations teams to act quickly on predictive signals such as rising no-show rates on a route or frequent geo-fence violations, while leadership reacts only to sustained pattern changes such as a quarter-on-quarter drop in commute satisfaction, a persistent increase in SLA breach rates, or a multi-month erosion of EV utilization. In practice, this reduces executive firefighting yet tightens control, because early-warning KPIs sit closer to the control-room and vendor governance layer, and slow-moving outcome KPIs anchor contracts, penalties, and long-term EV and ESG roadmaps.
When a vendor claims cost-per-trip savings, how can Finance confirm it’s real and not just exclusions or quality trade-offs—especially if NPS or exceptions worsen?
B0095 Validating true mobility savings — In India’s corporate mobility governance, how can a CFO validate that cost-per-employee-trip improvements are real (not a shift in accounting boundaries, exclusions, or quality trade-offs) when vendors present “savings” alongside deteriorating CEI/NPS or higher exception rates?
In corporate mobility, a CFO can validate that cost-per-employee-trip (CET) savings are real only when unit-cost trends are reconciled to stable service scope, quality, and risk. Any CET improvement must be checked against unchanged entitlements, constant or better On-Time Performance (OTP), and a flat or improving Commute Experience Index (CEI) or NPS, with exception and incident rates held or reduced.
A disciplined approach starts with a locked baseline. The CFO should freeze definitions for CET, Cost per Kilometer (CPK), and seat entitlement by persona. The baseline must include dead mileage, no-shows policy, vendor markups, and taxes so later “savings” cannot come from quietly excluding categories such as night surcharges or idle time. Outcome-linked procurement then ties payouts explicitly to reliability KPIs like OTP%, Trip Adherence Rate, exception-closure times, and safety incident rate so vendors cannot cut service or shift risk back to HR to win on price.
A common failure mode is fragmented data where vendor-reported savings do not match HRMS attendance, Finance ledgers, or command-center trip logs. A CFO reduces this risk by insisting on a unified data model: trip-level records from the mobility platform reconciled monthly to Finance and HR systems, with auditable ties to CEI/NPS scores and complaint volumes. If CET goes down while CEI, complaint closure SLA, or exception counts worsen, the CFO can flag savings as unsustainable or cosmetic and trigger commercial clawbacks or contract resets.
For corporate mobility, what should cost per employee trip include/exclude across EMS, rentals, events, and long-term rentals so Finance can compare fairly and avoid disputes?
B0099 Defining cost per employee trip — In India’s corporate ground transportation, what does “cost per employee trip” typically include and exclude across EMS, CRD, ECS, and LTR, and how should Finance define the metric so it remains comparable across service lines and doesn’t invite vendor disputes?
Finance teams in Indian corporate ground transportation typically define “cost per employee trip” to include only direct, allocable trip delivery costs and to exclude structural overheads and non-trip costs that vary by service line. A robust definition treats CET as a standardized, auditable unit rate built from a clear cost stack, with written inclusions, exclusions, and allocation rules that apply consistently across EMS, CRD, ECS, and LTR.
In practice, CET usually includes all vendor charges that are directly tied to a completed trip unit. This often covers per-km or per-trip fares, time-based components within the duty window, standard tolls and parking where bundled, and driver/vehicle costs already embedded in the contracted rate. For EMS and ECS, CET is commonly derived from pooled or route-level invoices by allocating total route cost over actual boarded employees, using trip manifests and seat-fill data from the mobility platform. For LTR, Finance generally allocates fixed monthly rentals to actual trips or employee-trip equivalents based on duty slips and utilization and excludes unused capacity from CET if the intent is to benchmark efficiency. For CRD, CET is usually a direct division of invoice value by the number of eligible employee trips or duty segments.
CET definitions usually exclude enterprise-side overheads like internal transport desk salaries, HR or security effort, and general IT costs that are not uniquely attributable per trip. They also commonly exclude one-time implementation, platform setup, or transition charges and pure penalty or credit notes arising from SLA breaches, which are tracked separately in TCO or ROI analysis. EV-specific capital or infrastructure investments that sit on the client’s books are normally kept out of CET and handled in separate depreciation or ESG cost models, while per-use EV charging fees embedded in vendor invoices can be included if directly trip-linked. To avoid disputes, Finance teams codify CET in contracts and RFPs through:
- Explicit inclusion and exclusion lists tied to tariff sheets and billing models.
- Standardized allocation rules for pooled routes, shuttles, and long-term rentals.
- Alignment between SLAs, billing logic, and mobility platform data (trip logs, manifests, seat-fill).
- Consistent CET formulas across EMS, CRD, ECS, and LTR, with any service-line adjustments documented and pre-agreed.
Operational resilience during disruptions
Outlines practical playbooks to keep operations calm during peak shifts and disruptions, including early-warning signals, OTP vs experience considerations, and escalation that minimizes firefighting.
In shift commute EMS, what are the typical ways OTP can look fine but employees still feel the service is bad, and how should we capture that in our KPIs?
B0071 When OTP hides poor experience — In India’s employee mobility services (EMS) for shift-based commute, what are the most common “silent failure modes” where OTP% looks healthy but employees still complain (e.g., waiting time, pickup location drift, last-mile walk, or repeated reschedules), and how should those be reflected in the outcome definition and KPI set at an executive level?
In India’s employee mobility services for shift-based commute, the most common silent failure modes occur when on-time pickup percentage (OTP%) looks healthy but employee effort, uncertainty, and perceived risk remain high. Silent failures usually sit in dimensions like waiting time variance, pickup point drift, last‑mile burden, rescheduling churn, and safety assurance rather than pure timestamp adherence, so executives need outcome definitions and KPIs that explicitly measure these adjacent frictions instead of only tracking OTP%.
Silent failure modes typically emerge when governance focuses on fleet-side metrics and ignores employee experience signals. OTP% can be met even when vehicles arrive too early and leave employees behind, when pickup locations keep shifting, or when employees walk long distances in unsafe or poorly lit areas. Fragmented routing, manual interventions, and weak observability from the command center enable these patterns to persist, because exception data is not connected to HRMS, transport apps, or centralized dashboards in a way that reveals commute stress. This disconnect creates a perceived reliability gap even under apparently strong service performance.
Executives should define outcomes around “low-friction, low-anxiety commute” instead of “on-time vehicles” alone. The KPI set should blend reliability, safety, and experience measures, and should be traceable using data from routing engines, trip logs, safety systems, and employee apps integrated with HRMS. Outcome-linked procurement and centralized NOC monitoring should then use these multi-dimensional KPIs to govern vendors and internal teams.
Key silent failure modes and corresponding executive-level KPIs can include:
- Early-arrival and micro-delay windows. Vehicles may technically be “on time” but reach much earlier than the pickup window and leave before employees arrive, or arrive at the last minute with high variance. Executives should track a “pickup window adherence rate” that measures arrivals within a narrow, employee-communicated window rather than a single timestamp. A “waiting time variance index” can capture how predictable waiting time is at each site and route over time.
- Pickup point drift and unsafe last mile. OTP% does not capture how far employees walk or whether pickup points change due to local constraints, security restrictions, or routing shortcuts. Executives should define “average safe last-mile distance” and “pickup point stability rate” as KPIs, with explicit thresholds for distance from office gates or secure points. Geo-fencing and route adherence audits can supply the necessary trip-ledger evidence.
- Repeated reschedules and roster churn. Frequent shift changes, last-minute roster edits, and vendor-side reallocations cause perceived unreliability even if trips depart on time. Executives can measure a “reschedule rate per employee per month” and a “late roster change impact rate,” tying these to outcome-based commercials and continuous improvement work between HR, transport, and vendors.
- Seat-fill patterns and pooling discomfort. Optimized cab pooling can push seat fill to acceptable levels on paper but may consistently overload certain routes or timebands. This can create discomfort, longer travel times, and route zig-zags that are not visible in OTP%. Leaders should track “trip fill ratio” with guardrails for maximum pooling levels, combined with a “door-to-door commute time distribution” by shift and route, rather than relying on average trip duration only.
- Night-shift and gender-specific safety frictions. For women employees and night shifts, silent failures occur in escort allocation, route approvals, and SOS confidence. The absence of adverse incidents does not prove safety if protocols are inconsistently followed. Executives should define outcomes using “escort compliance rate for applicable trips,” “geo-fence violation rate,” and “SOS readiness indicators” such as time-to-response from the command center. These metrics should be part of a safety and compliance dashboard and integrated with audit trails.
- Exception handling and closure latency. Employees experience failures when incidents (missed pickups, app glitches, driver behavior issues) are not resolved quickly, even if overall OTP remains high. Leaders should treat “exception detection-to-closure time” and “complaint closure SLA adherence” as core KPIs alongside OTP%. Integration between the alert supervision system, central command center, and HR/ESG reporting should ensure that incident logs are auditable and visible.
- Hybrid-work volatility and demand predictability. In hybrid and flexible work environments, demand fluctuations can cause under-provisioning on certain shifts and locations. Vehicles may still hit OTP% for the trips that exist, but employees struggle to get slots or face repeated denials. Executives should track “booking success rate” and “denied-request rate” for critical shifts, linked back to capacity planning and vendor governance.
Outcome definitions should encode these KPIs into a unified “Commute Experience Index” rather than treating them as secondary metrics. Reliability outcomes can combine OTP%, pickup window adherence, and exception closure SLAs. Safety outcomes can combine escort and compliance metrics, SOS effectiveness, and route adherence scores derived from telematics and command center dashboards. Experience outcomes can combine commute time distribution, booking success, and feedback scores from employee apps. Sustainability and ESG outcomes can add EV utilization ratio, emission intensity per trip, and carbon abatement indicators as adjacent measures without displacing reliability or safety.
At an executive level, transport heads, CHROs, CFOs, and ESG leaders should view OTP% as only one node in a wider observability framework. Governance reviews and quarterly business reviews should use multi-layer dashboards that surface reliability, safety, cost, and ESG metrics side by side. Outcome-based contracts can then tie a portion of payouts and penalties to this broader KPI set, ensuring vendors and internal teams optimize not just for OTP%, but for overall commute stability and employee trust.
images:
For airport/intercity corporate rentals, how do we define reliability in a fair way when flights and schedules change, so SLAs don’t turn into constant billing disputes?
B0072 Fair reliability KPIs for CRD — In India’s corporate car rental services (CRD) covering airport and intercity trips, how should a Travel Desk and Finance team define “service reliability” beyond OTP—especially when flights delay or meetings shift—so that SLA governance is fair and doesn’t create invoice disputes every month?
Service reliability in corporate car rental services should be defined as a combination of on-time readiness, controlled exception handling, and clean trip closure, not just raw pickup OTP. Service reliability improves governance when SLAs distinguish between vendor‑controllable events and client or third‑party disruptions like flight delays or meeting overruns.
A practical pattern is to anchor SLAs on “readiness and response” rather than only clock time. The Travel Desk can define a committed response-time window for new or rescheduled requests, a maximum wait-time obligation when a flight is on-time, and clear rules for how long a driver must wait when a flight or meeting is delayed. Finance can then classify delays into controllable and non‑controllable categories using trip logs, GPS data, and flight-linked tracking, so penalties or waivers are applied only where the vendor had genuine control.
Most organizations reduce invoice disputes when they codify a short set of measurable reliability KPIs for CRD. Examples include trip adherence rate to the final agreed ETA, driver no‑show rate, exception detection‑to‑closure time for changes, and clean documentation rate where duty slips, OTPs, and logs reconcile without manual correction. These KPIs can sit alongside cost per kilometer and cost per employee trip baselines, so Travel Desk and Finance see both reliability and unit economics from the same trip ledger.
A common failure mode is to penalize all late pickups purely on scheduled time. This usually triggers monthly debates over waiting charges, dead mileage, and “who changed what when.” A more robust approach is to embed airport flight-data integration and meeting-change workflows in the booking process, so any reschedule or delay automatically updates the SLA reference time and produces an audit trail.
To keep SLA governance fair and low‑friction, Travel Desk and Finance can jointly maintain three simple rule-bands. One band covers standard trips where OTP% and response SLAs fully apply. One band covers approved, documented exceptions where the service is still counted as reliable but exempt from penalties. One band covers true failures like unserved bookings, safety incidents, or unapproved vehicle downgrades, where penalties or credits apply automatically. This structure protects operations from being blamed for airline or client changes while still keeping vendors accountable for what they control.
For event or project commute in India, what KPIs let us push for zero delays without encouraging unsafe driving or gaming the data?
B0073 Safe KPIs for ECS punctuality — In India’s project/event commute services (ECS) for conferences or site ramp-ups, what outcome definitions and KPIs best balance “zero tolerance for delays” with operational reality, so project leadership can govern vendors without incentivizing unsafe driving or data manipulation?
In India’s project and event commute services, the most effective outcome definitions combine strict time-bound SLAs with safety, compliance, and data-integrity metrics that carry equal or higher weight than pure on-time numbers. Outcome definitions work best when project leadership links payouts to a blended score across on-time performance, safety compliance, utilization, and exception handling, rather than to raw punctuality alone.
The primary time metric usually focuses on shift readiness instead of just trip start times. Project leadership often defines on-time performance as employees being at security gates or workstations before shift start, with explicit OTP bands and tolerances. This approach aligns mobility outcomes with project productivity while acknowledging traffic variability and routing constraints.
A common failure mode is over-penalizing minor delays without accounting for incident-free operation, which can push vendors toward unsafe driving or route-shortcuts. This risk is reduced when the KPI set includes a safety incident rate, route adherence audits, and driver fatigue indicators, with zero-tolerance thresholds that override any OTP incentives. Vendors then understand that unsafe behavior will neutralize or reverse any gains from faster arrivals.
Data manipulation becomes attractive when commercial outcomes depend on self-reported timestamps or editable logs. This is mitigated by anchoring KPIs to telematics data, tamper-evident GPS logs, and immutable trip records that are periodically audited. Independent audits of route adherence and checkpoint scans help maintain audit trail integrity and discourage retrospective edits.
A practical governance pattern is for project leadership to define a small, explicit KPI stack. Typical ECS KPI stacks include an on-time arrival percentage indexed to shift start, a trip adherence or route adherence score, a safety and compliance index covering licenses, fitness, and night-shift escort rules, and an exception closure SLA for breakdowns and no-shows.
Balanced scorecards also incorporate utilization or dead mileage caps so fleets are not oversized to chase perfect punctuality. Fleet utilization metrics encourage vendors to optimize routing and capacity for conferences or ramp-ups without increasing congestion or cost unnecessarily. This supports both operational efficiency and overall project cost control.
Exception handling quality is often a better predictor of project success than headline OTP numbers. Metrics that track detection-to-closure time for disruptions, such as vehicle breakdowns or sudden weather issues, allow leadership to see whether command centers and on-ground supervisors are preventing isolated issues from becoming systemic failures.
For zero-tolerance projects, leadership can define clear thresholds where any serious safety incident, escort violation, or data-tampering attempt triggers automatic penalties or contract reviews regardless of punctuality scores. This makes the safety baseline non-negotiable and prevents incentives from drifting toward risky behavior as pressure mounts.
images:
For long-term rentals, what KPIs should we use for uptime and replacements so a fixed monthly cost doesn’t hide service degradation over time?
B0074 LTR uptime vs cost predictability — In India’s long-term rental (LTR) corporate fleet programs, how should Procurement and Finance define KPIs for uptime, replacement responsiveness, and service continuity so that “cost predictability” doesn’t quietly trade off against reliability over a 6–36 month contract?
In India’s long‑term rental (LTR) programs, Procurement and Finance need KPIs that lock in uptime, replacement speed, and continuity as non‑negotiable outputs, not soft promises traded away for a lower monthly rental. Cost predictability is preserved when contracts define clear availability targets, response‑time KPIs, and continuity clauses, and then link a portion of vendor payout to these metrics over the full 6–36 month tenure.
Procurement should first define “available fleet” in precise, auditable terms. A practical KPI is an uptime SLA per vehicle, expressed as a percentage of contractual duty hours in which a compliant vehicle and chauffeur are actually available and fit for service. A second KPI should track Trip Adherence Rate for those LTR vehicles that run rostered or executive duties, because chronic route or time deviations often signal hidden maintenance or driver fatigue issues.
Finance should then require measurable “replacement responsiveness” metrics. A simple construct is maximum response time to provide a like‑for‑like replacement when a vehicle is down for planned maintenance or breakdown. A second, complementary KPI can cap allowable downtime per incident before penalties apply, which prevents long, silent gaps where the asset is technically “on rent” but practically unavailable.
Service continuity over 6–36 months requires contract‑level guardrails. Procurement and Finance should insist on a minimum monthly uptime threshold for the overall LTR pool, with stepwise penalties if the vendor falls below that baseline and earnbacks only after sustained improvement. A second continuity KPI should cover preventive maintenance compliance, because missed preventive maintenance almost always reappears later as unplanned outages that break both OTP and budgets.
Useful contract KPIs for LTR in this context include: - A fleet‑wide uptime percentage, tracked monthly and over rolling quarters. - Maximum replacement TAT for breakdowns and accidents, differentiated by city and timeband. - A preventive maintenance completion rate tied to vendor reporting and audit rights. - A Trip Adherence Rate where LTR vehicles serve fixed executive or project duties.
These metrics protect against the common failure mode where a low “headline rental” hides poor maintenance, slow replacements, and non‑performing vehicles. They also make it easier for Finance to reconcile invoices to service actually delivered, because every rupee of rental is now traceable to uptime, adherence, and continuity performance rather than just asset presence on paper.
As an Ops lead, what should I ask to ensure the KPI framework actually reduces firefighting and doesn’t just add more reporting work for the control room?
B0097 KPIs that reduce firefighting — In India’s employee mobility services (EMS), what are the most pragmatic questions a Facilities/Transport Head should ask to test whether a KPI framework will reduce daily firefighting—rather than adding another layer of reporting that increases cognitive load for the control room?
A Facilities or Transport Head should test any KPI framework by asking whether it turns live operations into earlier, clearer signals that reduce escalations. A KPI set that only produces pretty dashboards or monthly reports will increase cognitive load in the control room, while a KPI set that is tightly linked to alerts, SOPs, and vendor governance will reduce daily firefighting.
The most pragmatic questions fall into a few clusters.
1. “Will these KPIs change what my team does in the next 30 minutes?”
Which 5–7 KPIs will my shift supervisor actually look at during live operations, and what exact actions do they trigger. Are OTP%, Trip Adherence Rate, no-show rate, and exception closure time visible in real time, or only in end-of-day MIS. For every KPI, what is the red-line threshold, and what is the pre-defined SOP when that threshold is breached. Can the system convert KPI breaches into alerts and tickets automatically, or does my team have to visually scan reports to spot problems.
2. “Does this framework give early warning, or just tell me I failed?”
Do KPIs surface leading indicators, such as growing delay trend by route, driver fatigue risk, or dead mileage spikes, or only lagging metrics like monthly averages. Can I see shift-window specific OTP and route adherence, not just site-wide numbers. Will alerts trigger before a wave of late pickups hits, for example when ETAs start breaching buffers on a particular corridor. Are safety and compliance KPIs (escort compliance, credential expiry, incident rate) tied to proactive checks, not just audit reports.
3. “Is the data clean and unified enough that I can trust it under pressure?”
Are KPIs driven from a single trip lifecycle record that combines GPS, roster, and driver data, or are we manually stitching from different vendor sheets. How are cancelled trips, partial trips, and routing changes handled so that OTP and utilization are not gamed. Can I drill from a red KPI into the exact trips, drivers, and routes without exporting to Excel. Who owns data correction when there is a mismatch between GPS, HRMS, and billing, and how fast is that resolved.
4. “Will this help me manage vendors and drivers without more meetings?”
Are vendor-wise OTP, SLA breach rate, and Trip Fill Ratio visible and comparable across cities. Can I tie penalties, incentives, and route reallocation directly to KPIs without manual debate. Do driver-level metrics like incident rate and behaviour flags flow back into training, roster allocation, and fatigue management. Can I generate QBR-ready views from the same KPI set, or do I need a separate reporting exercise for leadership.
5. “Is this designed for my control room, or only for the boardroom?”
Can the command center see a single window with live exceptions, route deviations, and open incidents linked to KPIs. Are there role-based views for shift leads versus management, so frontline staff are not buried under strategic charts. Is there an escalation matrix wired to KPI thresholds, so repeated failures auto-escalate without manual follow-up. Does the framework support business continuity playbooks, for example different KPI expectations and alerts during strikes, monsoon disruptions, or tech downtime.
6. “How much extra work will my team do just to ‘feed’ these KPIs?”
Which data points are automated from apps and telematics, and which still rely on manual entry or reconciliation. How many minutes per shift do supervisors spend updating sheets, versus the system pulling from EMS routing, driver apps, and HRMS integration. If GPS or app connectivity drops, how does the framework degrade, and what is the minimal manual fallback to keep KPIs usable. Does the vendor commit to maintaining the KPI logic, definitions, and dashboards, or will my team be responsible for ongoing tuning.
7. “Can we pilot this on one site or shift and prove firefighting actually drops?”
Will the vendor agree to a limited pilot where we baseline current escalations, late pickups, and exception closure times, then measure impact after the KPI framework is live. During the pilot, who sits with my control room during nights and peaks to tune alerts and thresholds. How quickly can we modify KPIs if they are noisy, confusing, or being gamed by vendors. At the end of the pilot, can we show leadership a simple before-versus-after view that correlates fewer calls and incidents with the new KPI setup.
A Facilities or Transport Head should only accept KPI frameworks that are tightly wired into routing, command center operations, and vendor governance. A practical test is simple. If a KPI cannot be linked to a clear alert, SOP, and accountable owner in the next shift, it will likely become just another reporting burden for the control room.
Escalation playbooks, ownership & data quality
Sets clear ownership, repeatable data processes, and decision rights for KPI reporting, with standards for data quality, source-of-truth, and procurement alignment.
If HR or Comms wants to talk about mobility improvements—NPS, safety, EV adoption—how do we do it in a way Legal/ESG can stand behind later?
B0096 Using mobility KPIs in comms — In India’s corporate mobility programs, what is the best way for Marketing or HR to use outcome KPIs (CEI/NPS, safety posture, EV ratio) to strengthen employer brand and employee communications without making claims that Legal and ESG cannot substantiate later?
In India’s corporate mobility programs, Marketing and HR should only use outcome KPIs in employer branding once the numbers are generated from a stable, auditable operations and data model, and every metric is traceable back to underlying trip, safety, and ESG logs. KPI-led communication must follow operations reality, not lead it.
A safe starting point is to anchor commute messaging on a small, well-governed metric set such as a commute experience index or NPS, a clearly defined “safety posture” (incident rates, compliance currency, closure SLAs), and simple ESG indicators like EV utilization ratio or gCO₂/pax‑km. Each KPI must sit on a repeatable calculation method that is agreed with Transport, ESG, Finance, and Legal, and that uses data already captured by the mobility stack such as trip logs, OTP%, safety/SOS incidents, and EV vs ICE fleet mix. This reduces the risk that employer-brand narratives diverge from what auditors or regulators see in the underlying telemetry.
A common failure mode is when Marketing highlights aggressive “zero-incident” or “green” claims that are not backed by audit-ready evidence. Another is when CEI or NPS numbers are quoted without sample sizes, time windows, or consistent survey methods, which makes them difficult for ESG or Legal to defend. Legal and ESG teams are especially sensitive to tokenistic ESG claims, surveillance-style safety controls without consent clarity, or EV impact numbers that ignore lifecycle and grid-mix assumptions.
To keep communications defensible, organizations can define a simple KPI governance SOP before any campaign goes live. That SOP can specify which KPIs are approved for external or internal communication, how often they are refreshed, and what qualifiers must always accompany them, such as “based on the last 6 months of employee commute surveys” or “for shift-based EMS routes in India only.” It can also require that any mention of EV adoption be linked to a fleet electrification roadmap, clearly defined EV utilization ratios, and emissions calculations that Finance and ESG have already seen in dashboards and reports.
When HR uses commute KPIs to talk about safety and experience, it helps to emphasize trends and commitments rather than absolute guarantees. For example, it is more defensible to communicate “commute NPS improved by X points after introducing SOS and women-first routing” than to promise “100% safe commutes.” This reflects the industry reality that safety and reliability are managed through command-center operations, routing policies, driver assessment, and compliance automation, and are measured through indicators like incident rate, OTP%, and closure times rather than binary absolutes.
In practice, Marketing and HR can treat the mobility command center, routing engine, and compliance dashboards as their source of truth. They can request periodic KPI packs that tie CEI, safety metrics, and EV ratios to the same data and semantics used by Transport and ESG for governance. This aligns employer branding messages with the actual Employee Mobility Services (EMS) or Corporate Car Rental (CRD) performance, reduces the chance of greenwashing accusations, and ensures that any strong claim about commute safety, experience, or sustainability can be reproduced during internal audits, ESG reviews, or board-level scrutiny.
Emissions, safety, CEI/NPS governance & ESG alignment
Covers emissions and safety metrics alongside CEI/NPS governance, ensuring audit-readiness and credibility of ESG claims through robust data provenance.
How do ESG and Finance align on emissions KPIs like gCO₂ per passenger-km and EV ratio so the numbers are audit-ready and don’t look like greenwashing?
B0084 Audit-ready emissions KPI agreement — In India’s corporate mobility programs, how should an ESG Lead and Finance Controller agree on emissions KPIs (gCO₂/pax-km, EV ratio) so sustainability claims are audit-ready and not dismissed internally as “token ESG” or externally as greenwashing?
In India’s corporate mobility programs, ESG Leads and Finance Controllers need to co-own a single, data-backed emissions baseline and agree KPI definitions upfront, so every gCO₂/pax-km or EV ratio claim is traceable back to trip-level logs and finance-approved volumes. Emissions KPIs are treated as financial metrics. They must reconcile cleanly with billing, trip data, and vendor reports, or they will be seen as token ESG or potential greenwashing.
They should first lock a scoped baseline for employee mobility and corporate car rentals. The ESG Lead defines what counts as commute emissions and which services, sites, and timebands are in-scope. The Finance Controller validates that this scope matches cost centers, contracts, and vendor invoices. This alignment prevents later disputes where reported emissions do not match the spend footprint.
KPI formulas and data sources must be explicit and version-controlled. The parties should write down how gCO₂/pax-km is calculated, which emission factors are used, how seat-fill and dead mileage are treated, and how EV utilization ratio is derived. The Finance Controller insists these definitions map to line items and volumes visible in billing and MIS. The ESG Lead ensures the method is consistent with corporate ESG frameworks and can withstand investor or auditor scrutiny.
Trip telemetry, routing systems, and vendor platforms should feed a governed data layer that both functions trust. The ESG Lead uses this to generate mobility emission intensity and carbon abatement indices. The Finance Controller checks that total kilometers, trip counts, and mode splits reconcile against invoices, SLA-linked payments, and cost-per-trip metrics. This alignment ensures reported improvements in gCO₂/pax-km or EV penetration are backed by measurable changes in utilization and cost, not just narrative.
Joint governance is essential to avoid tokenism. ESG and Finance can set a quarterly review where they jointly examine trends in EV utilization ratio, idle emission loss, and cost per employee trip, comparing them to reliability and safety KPIs such as on-time performance and incident rate. If EV adoption is increasing but fleet uptime or OTP are degrading, they treat this as a trade-off to manage, not something to hide. This balance reduces the perception of ESG as symbolic and shows leadership that sustainability moves are operationally grounded.
A common failure mode is treating EV ratio as a headline target without proving operational equivalence. The ESG Lead should insist on pairing EV KPIs with reliability and uptime metrics and with CO₂ reduction per rupee of spend. The Finance Controller should require that any EV-driven premium or investment be explained through total cost of ownership logic and linked to measurable reduction in emission intensity per trip.
To make claims audit-ready, both roles need an evidence pack approach. For every public number on mobility emissions, there is a clear trail of trip-level data, routing assumptions, vendor allocations, and aggregation steps. Data lineage and audit trail integrity are treated similarly to financial controls. The Finance Controller validates that the same underlying datasets support both financial reconciliation and ESG reporting. The ESG Lead ensures calculation logic is transparent and repeatable across reporting cycles.
Over time, they can shift mobility procurement to outcome-linked contracts that embed emissions KPIs beside on-time performance and safety metrics. Payments can be partially indexed to gCO₂/pax-km reduction or EV utilization, once both sides are confident in data quality. This moves sustainability from narrative to a governed performance outcome and makes it more difficult for internal stakeholders or external reviewers to dismiss it as greenwashing.
For executive transport and corporate rentals, how do we define “executive experience” in measurable terms that still work for procurement SLAs and predictable billing?
B0085 Measuring executive experience in CRD — In India’s corporate car rental (CRD) and executive transport, how should leadership define “executive experience” outcomes in a way that is measurable (without being subjective) and still compatible with Procurement’s need for standard SLAs and Finance’s need for predictable billing?
In corporate car rental and executive transport, leadership should define “executive experience” as a small, measurable set of service outcomes tied directly to trip data, rather than to subjective feelings or generic “VIP service” claims. Each outcome should map cleanly to a standard SLA metric and to a billing rule, so that HR/Admin, Procurement, and Finance all see the same numbers and the same logic.
A practical approach is to anchor executive experience to a few non-negotiable, data-backed dimensions. On-time performance for pick‑ups and drops should be tracked at a strict threshold, such as arrivals within a defined number of minutes of scheduled time, and expressed as a percentage per vendor, city, and executive tier. Vehicle and chauffeur compliance can be measured through checklists and document currency, with SLA-linked targets for 100% credential validity and vehicle fitness on every executive trip. Service continuity and uptime should be defined through measurable fleet availability, response times for on‑demand bookings, and documented business continuity playbooks for disruptions.
Experience should also be encoded through exception-handling SLAs rather than through vague “premium support” claims. For example, leadership can require that any executive trip exception, such as a no‑show, vehicle breakdown, or safety concern, triggers a logged incident with a maximum detection‑to‑closure time. These incident closure SLAs can be standardized across contracts, making them compatible with Procurement’s governance templates and enabling Finance to see how exception handling impacts cost per kilometer or cost per trip.
Safety and duty of care need explicit, measurable controls. Chains of evidence such as trip OTP, GPS‑based route adherence, and escort or night‑shift protocol adherence can be tracked and reported as compliance scores. Incident rates and audit trail completeness can then become part of the “experience” definition, ensuring that a “good experience” is not just punctuality, but also a zero‑incident posture backed by verifiable logs.
To keep this compatible with predictable billing, leadership should align these experience outcomes to clear commercial levers. Standard rate cards can be used for base services, while incentives and penalties can be attached only to a small, agreed‑upon set of KPIs, such as on‑time performance, incident‑free trips, and complaint closure within SLA. This reduces subjectivity in vendor performance debates and gives Procurement a repeatable contract pattern, while allowing Finance to reconcile SLAs, invoices, and variance analysis without manual interpretation.
images:
For EMS employee feedback, how do we set up NPS/CEI governance so employees trust it and HR can prove feedback actually gets closed?
B0091 Trusted CEI/NPS governance in EMS — In India’s employee mobility services (EMS), how should HR define CEI/NPS collection and closure expectations at a governance level so the metric is trusted—especially when employees fear retaliation or believe feedback disappears into a black hole?
In India’s employee mobility services, HR should define Commute Experience Index (CEI) or NPS governance so that feedback is anonymous by default, visibly acted on within fixed SLAs, and protected from retaliation through clear separation between ride data, identity, and performance management. The metric becomes trusted when employees see a repeatable loop of safe collection, transparent aggregation, and documented closure that is independent of vendor influence and line-manager pressure.
HR should first define CEI/NPS as an enterprise KPI tied to EMS vendor governance, not as a soft “survey activity.” CEI scores should be captured from rider apps or post-trip links but stored in a governed “mobility data lake” that strips personal identifiers at the point of aggregation. Individual complaints should route into a ticketing or command-center system with reference IDs and closure SLAs, but only aggregated patterns should be visible in performance dashboards or QBRs. This separation reduces fear that a single bad rating will be used against an employee or a specific driver outside the safety and compliance process.
HR should codify expectations in policy and SOPs. This includes a published cadence for CEI/NPS collection, clear minimum response thresholds before using scores for commercial decisions, and defined time-bands for complaint triage, investigation, and closure. Safety and women-centric issues should flow through a hardened escalation matrix that links transport command centers, Security/EHS, and vendor partners, with audit-ready evidence and root-cause analysis. Governance reviews with Procurement, Finance, and Transport should use CEI alongside operational KPIs such as OTP%, incident rate, and SLA breach rate, rather than treating it as anecdotal “noise.”
To overcome fear of retaliation and “black hole” perceptions, HR should communicate three concrete guarantees to employees. First, an explicit non-retaliation clause for commute feedback, backed by CHRO and Security/EHS. Second, periodic publication of “You said / We did” summaries that show how CEI insights changed routes, vendors, driver rosters, or safety protocols. Third, a parallel, confidential safety channel (e.g., SOS button and women-safety cell) for incidents that employees do not want to log through standard rating flows. When employees repeatedly see visible changes, predictable response times, and no negative consequences for speaking up, CEI and NPS evolve from a cosmetic survey into a trusted input for EMS governance and commercial decisions.
What does gCO₂ per passenger-km really mean for our employee transport and corporate rentals, and what data-provenance questions should ESG ask so the number stays credible year after year?
B0100 Explaining gCO₂/pax-km credibility — In India’s corporate mobility services, what does gCO₂/pax-km actually measure for employee transport and corporate rentals, and what high-level data provenance questions should an ESG lead ask so the emissions KPI is credible across reporting cycles?
gCO₂/pax‑km measures the grams of CO₂ emitted per passenger for every kilometer of employee transport or corporate rental travel. It normalizes commute emissions by both distance and occupancy so ESG teams can compare diesel vs EV fleets, shuttle vs cabs, and different vendors on a like‑for‑like basis.
For this KPI to be credible across reporting cycles, ESG leads need to interrogate how the number is built from raw trip and fuel data, not just accept a dashboard view. The calculation should align with the organization’s Scope 3 commute boundary, use defensible emission factors, and link back to auditable trip logs and telematics from EMS and CRD operations.
At a minimum, ESG leads should ask the following data‑provenance questions:
- Activity data definition. How are total kilometers measured for EMS and CRD trips. Are these based on odometer, GPS traces, or vendor-declared distances.
- Passenger attribution. How is pax count per trip derived. Does the system use actual manifests and seat‑fill from the mobility platform, or averages and assumptions.
- Fleet mix resolution. Are trips tagged by fuel type and vehicle category so diesel, CNG, hybrid, and EV rides use different emission factors.
- Emission factors. What source factors are used for each fuel and grid electricity, and are they fixed per year with documented versioning for audit.
- System boundaries. Does gCO₂/pax‑km include only tailpipe emissions or also grid electricity for EVs. How are empty legs, repositioning, and dead mileage treated.
- Data lineage. Can each monthly KPI be traced back to immutable trip records, vendor invoices, and telematics, with a clear ETL or calculation pipeline.
- Data completeness. What share of total EMS and CRD trips are actually captured in the mobility system versus estimated. How are missing or manual trips handled.
- Change control. When routes, fleet mix, or routing algorithms change, how is the impact on gCO₂/pax‑km documented so year‑on‑year comparisons remain meaningful.
- Vendor comparability. Do all mobility vendors feeding into the KPI follow the same definitions, schemas, and calculation logic, or are numbers being stitched from inconsistent methods.
A credible gCO₂/pax‑km series for corporate mobility combines trip‑level traceability, stable methodology, and clear documentation of fleet electrification, routing optimization, and seat‑fill, so it can withstand investor and auditor scrutiny through multiple reporting cycles.
What’s the difference between CEI and NPS for employee commute experience, and how should HR choose which one to use consistently for reviews and vendor governance?
B0101 CEI vs NPS in EMS — In India’s corporate employee transport (EMS), what does “CEI” mean versus “NPS” for commute experience measurement, and how should HR decide which one to standardize on for leadership reviews and vendor governance?
Commute Experience Index (CEI) is a structured, mobility‑specific experience score built from multiple operational and safety KPIs, while Net Promoter Score (NPS) is a single loyalty question adapted from generic CX. CEI explains why employees feel the way they do about transport, whereas NPS only tells how they feel overall about recommending the service.
CEI in employee mobility typically fuses transport‑specific signals. These include on‑time performance, no‑show handling, seat availability, app usability, safety perception, and complaint‑closure SLAs. CEI links directly to EMS operations, HRMS data, attendance, and vendor SLAs. NPS is usually measured via “How likely are you to recommend this commute?” and is easier to socialize in leadership rooms but carries less diagnostic depth for routing, driver management, or command‑center SOPs.
For HR, a common failure mode is reporting NPS alone. That approach creates noise without clear levers for the transport or command‑center team. Another failure mode is building a complex CEI formula that operations cannot compute regularly or that Finance and Procurement cannot audit.
For leadership reviews and vendor governance, most organizations benefit from standardizing on CEI as the primary metric and keeping NPS as a supporting sentiment indicator. CEI can be wired into outcome‑linked procurement, vendor scorecards, and penalty or incentive ladders. NPS can be used as a quick “health check” in quarterly reviews, but decisions on vendor renewal, EV rollout, or SOP changes should be driven by CEI trends and component KPIs.
A practical HR approach is:
- Anchor leadership dashboards and vendor QBRs on CEI and its sub‑components.
- Track NPS alongside CEI to capture reputational and word‑of‑mouth risk.
- Use CEI movements to trigger deep‑dive route, driver, or command‑center corrective actions.
Baseline setting, localization vs uniform targets
Addresses baselines and target setting across multiple sites, balancing uniformity with local traffic realities to avoid politically contentious, unachievable targets.
Across multiple sites, how do we set fair baselines and targets for OTP, NPS, and cost when hybrid work and seasonality make comparisons messy and political?
B0076 Baseline and target setting fairness — In India’s corporate ground transportation, how should an enterprise set baselines and targets for OTP%, CEI/NPS, and cost-per-employee-trip across multiple sites when hybrid-work variability, seasonal traffic, and site ramp-ups can make “before vs after” comparisons politically contentious?
In India’s corporate ground transportation, enterprises should set OTP%, CEI/NPS, and cost‑per‑employee‑trip baselines by using stable, audited multi‑week data slices per site and per shift band, and then define targets as ranges tied to operating conditions instead of single absolute numbers. Baselines and targets are most defensible when they are segmented (site, timeband, service type) and explicitly tagged with context such as hybrid‑attendance level and known traffic or ramp‑up periods.
Enterprises that manage multi‑site mobility reliably usually treat OTP% and CEI as operational KPIs and cost‑per‑employee‑trip as a governance KPI. Each metric benefits from a separate baseline for Employee Mobility Services versus Corporate Car Rental or project/event commute, because routing density, seat‑fill, and dead mileage behave differently across these service verticals. Seasonal monsoon patterns, festival weeks, and planned site expansions are captured as “marked periods” in the command‑center view, and those periods are excluded from reference baselines but kept as separate stress‑test benchmarks.
A common failure mode is using a single, pre‑change citywide average as the “before” number and then holding operations accountable for improvements during a different demand mix. A second failure mode is mixing manual‑ops data with post‑automation data without documenting roster accuracy, GPS uptime, and billing integration maturity. Both issues can be reduced if Transport, HR, and Finance agree on a simple SOP for KPI baselining that is owned by the command center and reviewed in governance forums rather than ad‑hoc escalations.
Enterprises can make these metrics politically safer by defining target ranges and guardrails instead of headline promises. Examples include setting OTP% minimums per shift window, CEI/NPS floors per quarter, and cost‑per‑employee‑trip bands per site type, with explicit rules for when targets are relaxed or stress‑tested during ramp‑ups, night‑shift expansions, or temporary EV‑deployment pilots. Clear documentation of these rules allows HR, Finance, and Transport to differentiate structural change from operational under‑performance.
images:

Across multiple sites, should OTP and other EMS KPI targets be the same everywhere or adjusted by site—and how do we avoid site-by-site targets turning into excuses?
B0089 Uniform vs localized KPI targets — In India’s multi-site employee transport (EMS), how should senior leadership decide whether KPI targets should be uniform across sites or localized (by traffic, safety risk, shift mix), and how do they keep localized targets from becoming an excuse for chronic underperformance?
In multi-site employee transport, leadership should define a small set of non‑negotiable, company‑wide KPIs and then localize target bands per site based on validated on‑ground constraints. Localized KPI targets should be approved centrally, linked to hard evidence (traffic profiles, risk scores, shift mix), and reviewed periodically so they do not become a permanent shield for weak operations or vendors.
Leadership gains control when they separate what is standard from how high each site is expected to perform. Reliability, safety, compliance, and ESG measurement should use the same definitions, formulas, and reporting templates across all locations. OTP%, Trip Adherence Rate, incident rate, driver credential currency, and EV utilization ratio should sit on a single mobility command framework and data model. Localization should only adjust thresholds and improvement trajectories, not the underlying metrics or audit rules.
A common failure mode is to let “tough city” tags justify permanently lower expectations. Leadership can avoid this by using comparative analytics across cities and vendors, by codifying traffic and risk baselines once through the command center, and by tying commercials to improvement deltas rather than static relaxed targets. Sites with challenging traffic, high night‑shift exposure, or weaker charging infrastructure can have transition periods and step‑up targets, but they should still operate under the same SLA structure, escalation matrix, and route adherence audit regime as more stable sites.
To keep localized targets from diluting accountability, organizations should enforce a few guardrails:
- Anchor a minimum floor for critical KPIs like safety incidents and credentialing where no relaxation is allowed.
- Require evidence packs from the central NOC when a site asks for softer OTP or cost baselines.
- Use quarterly governance reviews to ratchet targets upwards where data shows improvement headroom.
- Index a share of vendor payouts to cross‑site benchmarks so underperforming sites feel a financial signal.
When the same routing engine, telematics feeds, and audit trails run across EMS locations, leadership can distinguish genuine structural constraints from avoidable dead mileage, fragmented vendor behavior, or weak local supervision. Centralized observability also lets Transport Heads argue for or against localized targets based on measurable variables such as peak‑hour congestion, seat‑fill ratios, and escort requirements, rather than anecdote. Over time, a uniform measurement spine with calibrated local bands produces both fairness for difficult sites and pressure on chronic underperformers to either improve or be re‑tiered in the vendor governance framework.
How should EMS KPIs change between shift-based cab programs and pooled shuttles on campuses, so we don’t force one-size-fits-all targets?
B0094 Differentiating EMS vs shuttle KPIs — In India’s corporate employee transport (EMS), how should outcome definitions and KPIs differ for large shift-based populations versus pooled shuttles in campuses or business parks, so the program doesn’t apply one-size-fits-all targets that frustrate Operations and HR?
In India’s employee transport, outcome definitions and KPIs for large shift-based EMS fleets should be built around individual shift assurance and duty-of-care, while pooled campus or business-park shuttles should be measured on corridor efficiency and seat-fill economics. Using a single KPI set across both models usually distorts incentives, masks risk, and creates avoidable conflict between Operations, HR, and Finance.
For large shift-based populations, most organizations treat each employee as a “must-arrive-on-time” obligation. On-time performance is therefore defined at trip and employee level, with KPIs such as trip adherence rate, no-show rate, and exception detection-to-closure time. Safety and compliance metrics carry equal weight, especially for women and night shifts, so incident rate, credentialing currency, escort compliance, and audit trail integrity are tracked as hard outcomes, not soft checks. These EMS programs also carry hybrid-work volatility, so routing, fleet utilization, and dead mileage are governed by guardrails rather than pure cost targets.
Pooled campus or business-park shuttles operate more like high-frequency corridors. Outcome definitions focus on seat-fill ratio, corridor-level on-time performance at key timepoints, and cost per employee trip across the route. Individual SLA guarantees are weaker, because the value lies in predictable frequency and aggregated flows, not door-to-door precision. ESG and EV utilization ratios are often easier to optimize here, so emission intensity per trip and idle emission loss can be set more aggressively without destabilizing shift adherence.
To avoid one-size-fits-all targets, organizations typically separate KPI bundles and commercial logic by service type. EMS contracts index payouts to OTP, safety incidents, and SLA-compliant closure, while shuttle contracts lean on utilization, cost per trip, and emission intensity. HR and Operations gain control when governance dashboards and command-center workflows reflect this separation, so escalations and reviews compare like with like instead of forcing corridor services to behave like door-to-door cabs, or vice versa.
What does “baseline selection” really mean for mobility KPIs like OTP, cost, and emissions, and why does it become such a political fight during renewals?
B0098 What baselines mean and why political — In India’s corporate mobility services, what does “baseline selection” mean in the context of measuring OTP%, cost-per-trip, and emissions, and why do disagreements over baselines often become a political issue between HR, Finance, and Procurement during vendor renewal decisions?
Baseline selection in corporate mobility means fixing the reference period, data set, and calculation method that will be treated as the “before” state for OTP%, cost‑per‑trip, and emissions. Baselines define what counts as improvement, what counts as failure, and which vendor or model looks better or worse when contracts come up for renewal.
In practice, OTP% baselines depend on which months, shifts, and routes are included, how no‑shows and traffic disruptions are treated, and whether manual exceptions are counted. Cost‑per‑trip and CPK baselines depend on how dead mileage, minimum guarantees, and peak‑hour premiums are allocated, and whether multi‑vendor, fragmented data has been normalized. Emissions baselines depend on which vehicles are tagged (diesel vs EV), what distance and utilization numbers are used, and how emission factors are applied and audited.
Disagreements over baselines become political because each function has different exposure and incentives. HR tends to favor baselines that capture safety incidents, women‑safety compliance, and employee satisfaction, since commute issues hit attendance, morale, and employer brand. Finance pushes for baselines that emphasize spend visibility, leakage, and TCO, and will challenge any OTP or ESG claim that is not reconcilable to billing and MIS. Procurement needs a defensible, process‑clean baseline that justifies the last award and the next RFP outcome, and is wary of vendors “resetting” baselines to hide SLA drift.
When baselines are not agreed upfront and codified in contracts, every renewal cycle reopens arguments about which period “really counts,” whether hybrid‑work volatility or monsoon months should be excluded, and how to treat prior vendor under‑performance. This turns into a blame game: HR is seen as “emotional,” Finance as “blocking,” and Procurement as “picking the wrong vendor,” instead of having a shared, audit‑ready reference frame anchored in an integrated mobility data set and clear outcome‑linked KPIs.