How to run attribution like a control-room playbook: five lenses for reliability in employee mobility services
In peak shifts, GPS glitches, driver shortages, and weather disruptions push dispatches into crisis mode. This guide helps Operations Heads convert data into a repeatable, auditable playbook that keeps the control room calm instead of chasing firefighting. The five lenses offer practical guardrails, escalation paths, and SOP-level clarity so your team can act within minutes without adding hype or friction.
Is your operation showing these patterns?
- Escalations spike during peak shifts with no clear root cause.
- GPS outages or app downtime undermine credibility of improvements.
- Vendor response gaps force manual workarounds and long recovery times.
- Operations spend hours reconciling mismatched trip logs and rosters.
- Staff burnout rising as frontline incident triage becomes the norm.
- Leadership sees 'improvements' but frontline reports unresolved issues.
Operational Framework & FAQ
data integrity & single source of truth
Establish a clean data foundation across HRMS, attendance, access logs, and trip data; define a single source of truth and guardrails against drift and privacy risk.
For our employee transport program, what does attribution and causality really mean, and how do we avoid confusing correlation with real impact on attendance or attrition?
B0102 Attribution vs correlation explained — In India corporate Employee Mobility Services (EMS), what does “attribution & causality” practically mean when HR claims commute improvements increased attendance or reduced attrition, and what is the simplest way to avoid mistaking correlation for impact?
In Indian corporate Employee Mobility Services, “attribution & causality” means proving that specific commute changes directly drove outcomes like better attendance or lower attrition, instead of just happening around the same time. It requires linking a defined EMS intervention to measurable shifts in HR metrics while ruling out other obvious reasons for the change.
In practice, most organizations only see correlation. Attendance improves after a route revamp or EV rollout, and HR reports “transport solved it.” Attributing causality needs more discipline. The EMS change must be clearly defined in time and scope. The affected population must be separated from a reasonably similar “unaffected” group. Transport KPIs like on‑time performance, safety incidents, or trip fill ratio must move first. Attendance, attrition, or satisfaction should move after, in the same cohort.
A common failure mode is announcing “EVs improved morale” when the same period also had salary corrections, policy changes, or manager reshuffles. Another is using only point-in-time survey results or testimonials without tying them back to shift-wise OTP, no-show rates, or complaint closure SLAs captured in the EMS command center or dashboards.
The simplest way to avoid mistaking correlation for impact is to treat EMS changes as small experiments. HR and Transport can define one change, one cohort, one time window, and one or two HR outcomes, while keeping a comparable control group unchanged. If the treated group shows a clear, time-aligned improvement in both transport KPIs and HR metrics relative to the control, the causal story is much more defensible.
To operationalize this with minimal complexity, teams can follow four checks:
- Is there a clear “before/after” window for the EMS change?
- Is there a comparable set of employees whose commute did not change?
- Did transport reliability or safety KPIs improve first, before HR outcomes?
- Can Finance and HR jointly validate that no bigger concurrent changes explain the shift?
This lightweight, cohort-and-control mindset fits existing EMS governance, uses data already flowing through routing engines and HRMS integration, and gives HR a story about attendance and attrition that can stand up in front of Finance, ESG, and audit reviewers.
Why does Finance usually push back when HR says better OTP improves shift adherence, and what kind of proof actually convinces them?
B0103 Why Finance doubts HR claims — In India corporate ground transportation, why do CFOs often challenge HR’s claims that better on-time performance (OTP) improves shift adherence, and what proof typically changes a Finance leader’s mind?
Most Finance leaders challenge HR’s “better OTP improves shift adherence” claims because the link is usually presented as intuition, not as reconciled, auditable data tied to cost and productivity outcomes. CFOs change their mind only when OTP and shift adherence are shown as hard, repeatable relationships that reconcile cleanly with HRMS, transport logs, and financial impact.
CFOs are accountable for cost transparency, audit integrity, and predictable unit economics like Cost per Employee Trip and Cost per Kilometer. Subjective narratives about “happier employees” or isolated anecdotes do not survive scrutiny during audits or budget reviews. A common failure mode is fragmented data, where transport vendors show OTP percentages, HR shows attendance complaints, and Finance cannot trace any of it back to payroll, productivity, or trip-level costs.
Finance leaders respond when commute data is fused with HRMS and operations data in a governed way. They look for evidence that higher OTP correlates with fewer late logins, lower no-show rates, and more stable shift productivity. They place high weight on outcome-linked KPIs such as cost per trip, trip fill ratio, dead mileage, and exception-closure times.
The proof that typically shifts a CFO’s view includes:
- Time-series comparisons showing OTP% vs. late logins and no-show rates across similar sites or timebands.
- Before/after analyses where route optimization or centralized command-center monitoring lifted OTP and simultaneously reduced overtime, exception cabs, or make-up trips.
- Trip-level and shift-level reconciliations where vendor logs, HRMS attendance, and billing match, demonstrating that improved OTP reduced leakage and rework.
- Documented outcome-based contracts where payouts are indexed to OTP, incident rates, and exception-closure SLAs, creating a defensible financial narrative.
In practice, a CFO’s stance changes when OTP improvements are expressed as a verified reduction in CET/CPK, fewer exception payments, and more predictable rosters—not as a standalone operational KPI but as a driver of cleaner books and smoother audits.
For measuring whether routing changes reduced late logins, when should we use pre/post vs matched cohorts, and when is each good enough for leadership?
B0104 Pre/post vs matched cohorts — In India shift-based Employee Mobility Services (EMS), how does a basic pre/post analysis differ from a matched-cohort comparison when measuring whether routing changes reduced late logins, and when is each approach credible enough for leadership decisions?
In shift-based Employee Mobility Services in India, a basic pre/post analysis tests whether late logins changed after a routing change, while a matched-cohort comparison tests whether late logins changed for “similar” employees or routes that did and did not receive the change. A basic pre/post view is usually enough for quick operational decisions and early SOP tuning, while matched-cohort evidence is needed when leadership will tie budgets, contracts, or policy changes to those results.
A basic pre/post analysis compares late-login rates before and after the routing change across the same operation. This approach is fast and easy to run from existing EMS trip and attendance logs. It works best when nothing else material changed in the period, when the organization only needs directional evidence, and when the decision is localized, such as adjusting seat-fill targets, buffer times, or vendor allocations within one site.
A matched-cohort comparison constructs two comparable groups. One group is exposed to the new routing logic or fleet mix, and the other continues on the old pattern. Each cohort is matched on factors like shift window, route length, time band, vendor, and employee mix. This approach reduces bias from external changes such as traffic patterns, hybrid-work attendance shifts, or vendor performance. It is credible for leadership when EMS results will influence contracts, penalties or incentives, EV adoption decisions, or multi-city rollouts.
Matched-cohort methods demand better data quality and governance. They need stable integration between routing engines, HRMS attendance, and command-center logs, along with clear KPI definitions for on-time performance and late logins. Basic pre/post methods are appropriate when transport heads need a quick read to calm operations, but leadership should insist on matched cohorts before claiming structural improvement or baking outcomes into SLA-linked commercials.
What data do we need to join from HRMS, attendance, and access control to link commute reliability to attendance, and where do these joins usually break?
B0105 Critical HRMS-attendance-access joins — In India enterprise-managed employee transport, what specific data joins between HRMS, attendance, and access-control logs are usually required to attribute commute reliability changes to attendance outcomes, and what are the common failure points in those joins?
In India enterprise-managed employee transport, organizations usually need to join trip-level commute data with HRMS master data, shift/roster records, attendance logs, and physical access-control logs on a per-employee, per-shift basis to attribute commute reliability changes to attendance outcomes. The joins that matter most are employee-identity joins, shift-window joins, and site/route joins, and the common failure points are inconsistent IDs, misaligned timestamps, and missing or siloed data between transport, HR, and access systems.
The primary join is an identity join between the mobility platform’s rider ID and the HRMS employee ID. This join lets organizations link each trip or route manifest to a specific employee record, which is required to compare transport KPIs like on-time performance with HR-linked KPIs like attendance or attrition. A second join is a shift/roster join between the transport roster, the HRMS shift schedule, and the attendance system’s expected in/out times. This join allows comparison of planned pickup/drop windows with actual trip times to see if late arrivals correlate with late logins or early logouts. A third join is a site/access join between the transport drop location, the employee’s mapped work site, and access-control entry/exit events, so that trip timestamps can be validated against actual gate swipes or entry logs.
Common failure points include inconsistent or duplicated employee identifiers across systems, which break the identity join and force manual reconciliation. Timestamp misalignment across trip logs, HRMS shift definitions, and access-control systems often makes it hard to decide whether a delay is operational or just a clock-skew artifact. Data silos, where transport vendors, HR, and access-control providers hold their own partial datasets without a shared schema, frequently block end-to-end attribution. Another frequent issue is incomplete event capture, such as missing no-show flags, unlogged manual trips, or gaps in access logs, which leads to biased or inconclusive correlations between commute reliability and attendance changes.
How do we account for seasonality, site ramp-ups, and hybrid policy changes when we try to link OTP improvements to attendance or shift adherence?
B0106 Controlling confounders in EMS — In India corporate Employee Mobility Services (EMS), how do you control for confounders like seasonality, site ramp-ups, and hybrid WFO/WFH policy shifts when attributing a change in OTP to a change in attendance or shift adherence?
In India EMS programs, attribution between On-Time Performance (OTP) and attendance or shift adherence is only reliable when operations teams explicitly normalize for demand, capacity, and policy shocks. Confounders such as seasonality, site ramp-ups, and hybrid WFO/WFH shifts need to be modeled as separate control variables before linking OTP movements to changes in login adherence or absenteeism.
Most mature operators treat OTP and attendance as correlated but distinct outputs. They create a canonical data layer where roster data, trip logs, and HRMS attendance sit together, and then segment performance by site, timeband, and policy regime. Without that segmentation, a genuine OTP gain can be mistaken for improved attendance when the real driver is a temporary demand dip, a hiring slowdown, or a policy change that reduced the number of commuters.
A common failure mode occurs when buyers track only headline OTP and monthly attendance. This approach hides the impact of seasonal weather, exam periods, festival calendars, project go-lives, and ramp-downs. It also ignores how hybrid policies reshuffle who is eligible for cabs, which days are “peak commute,” and how seat-fill and dead mileage behave. In practice, EMS teams that control for confounders rely on shift windowing, trip-level adherence logs, and explicit tags for special conditions such as ramp-up weeks, BCP events, or temporary routing rules.
Practical control steps that operators use include: - Tagging each week or month with demand context such as headcount changes, new-project onboarding, or known low-volume seasons. - Comparing OTP and attendance at the level of consistent cohorts, such as the same process, site, or timeband, before and after operational changes. - Anchoring OTP and attendance analysis to a stable baseline period, then treating policy changes like WFO mandates or EV-routing pilots as discrete interventions.
In an RFP, what proof should we ask for when a vendor says their routing/NOC will cut attrition or late logins, without making it overly complex?
B0107 RFP proof for causality claims — In India corporate ground transportation procurement, what attribution evidence is reasonable to demand in an RFP when a vendor claims their routing or NOC will reduce attrition and late logins, without creating an unrealistic “science project” evaluation?
In India corporate ground transportation, buyers should demand attribution evidence that links routing or NOC improvements to late-logins and attrition through traceable operational proxies, not broad HR outcomes. The most reasonable approach is to insist on auditable baselines, KPI deltas, and simple comparative designs that can run inside normal operations without becoming a separate “science project.”
Vendors should first show how their routing engine and 24x7 NOC improved core commute KPIs in comparable environments. Relevant evidence includes changes in on-time performance, trip adherence, no‑show rate, seat fill, and exception closure time, ideally with before/after data or six‑month trend views. For EMS, this often ties to dynamic routing, live GPS tracking, and command‑center alert supervision rather than generic “AI” claims.
The RFP can then require vendors to map those commute KPIs to HR-facing indicators in a light-touch way. Reasonable asks include correlation to late login counts by shift band, attendance volatility in high‑dependence transport sites, and commute-related grievance volume, with clear definitions and time windows. HRMS–transport integration is important here, but the expectation should be a pragmatic link, not a full-blown analytics lab.
To avoid an unmanageable evaluation design, most organizations run simple A/B or phased rollouts instead of experimental trials. A practical RFP condition is a three-to-six-month pilot on selected routes or sites, comparing OTP, exception rates, and commute complaints before and after vendor onboarding. Vendors who already operate centralized command centers and incident-ready NOCs can also be asked to share anonymized case studies where improved OTP and safer routing coincided with better employee satisfaction scores.
This structure keeps attribution grounded in transport-controllable variables, allows HR, Transport, and Finance to read the same numbers, and still gives CHROs a defensible narrative about reduced late logins and transport-linked attrition without over-promising causal precision.
Which outcomes are actually defensible to link to commute improvements—attendance, late logins, shift adherence, retention—and which ones usually don’t pass Finance scrutiny?
B0108 Defensible outcomes for attribution — In India enterprise employee transport, what are the most defensible outcome metrics to attribute to commute improvements—attendance stability, late login minutes, shift adherence, retention—and which of these typically fail attribution scrutiny with CFOs?
In India enterprise employee transport, the most defensible outcome metrics are those that sit closest to raw operational logs and HRMS data. Attendance stability, late-login minutes, and shift adherence are usually defensible if they are tied directly to HRMS time stamps and trip logs. Retention uplift is where attribution usually fails CFO scrutiny because too many non-transport variables influence it.
Attendance stability is defensible when HRMS swipe / SSO login events are correlated with routed employees and shift-wise route rosters. Late-login minutes are defensible when trip ETAs and actual drop times are mapped to application login windows for commute-tagged employees. Shift adherence is defensible when on-time arrival (OTP%) and Trip Adherence Rate are stored as audit-ready metrics in a command center dashboard.
Retention improvements usually fail CFO scrutiny. The failure mode is that HR cannot isolate transport from compensation changes, manager behavior, role changes, or macro labor-market shifts. Overall employee satisfaction or NPS also fails scrutiny when it is not commute-specific or when survey methodology is weak.
The CFO lens favors outcome metrics that can be reconciled with Finance and HR data. Cost per employee trip, cost per kilometer, and exception-to-closure SLAs are easier to defend than “culture” or “morale” outcomes. Commute-linked attendance deltas at specific sites or time bands are more credible than broad claims like “lower attrition due to better transport.”
CFOs usually require three conditions before accepting attribution. The baseline and post-change periods must be clearly defined. The commuter cohort must be explicitly tagged and stable. The explanation of confounding factors must be documented, not ignored.
images:
How can we figure out whether late logins are due to routing/dispatch vs employee readiness, gate delays, or access-control delays before we blame the vendor?
B0109 Diagnose causes of late logins — In India shift-based EMS operations, how can a Facilities/Transport Head diagnose whether late logins are caused by routing/dispatch issues versus employee readiness, gate delays, or access-control bottlenecks before blaming the mobility vendor?
In Indian shift-based EMS operations, a Facilities or Transport Head can separate routing/dispatch faults from employee or access-related delays by building a simple, evidence-based comparison between planned trip data and site-side events for every late login incident. The core principle is to timestamp each handover in the chain and then see where the first deviation appears.
First, the transport team should lock a standard “trip lifecycle” view for each shift. This view should cover roster freeze time, vehicle reporting time at origin, actual pick-up times, gate-in at the site, and employee login time. A centralized command center or NOC dashboard with real-time GPS, alert supervision, and route adherence monitoring gives early visibility of whether the cab actually ran late or reached on time and queued at the gate. When GPS logs show on-time arrival at the facility and the delay appears only between gate entry and system login, the root cause usually lies in access-control queues, lift congestion, or internal walk time rather than routing.
Second, the Facilities or Transport Head should correlate mobility data with non-transport systems. HRMS or attendance logs indicate when swipe or OTP-based login actually occurred. Access-control and security data show queue lengths or screening delays. If the routing engine, driver app, and command center data consistently show on-time performance but HRMS shows scattered late logins from the same drop, the pattern points to employee readiness or internal process gaps rather than vendor OTP failure.
Third, the team should standardize a short investigation SOP for each late login escalation. The SOP should define which reports to pull, time-window thresholds, and who validates each segment of the journey. Key checks include whether the roster was published before cut-off, whether the employee boarded at the scheduled stop, whether any geo-fence or route-deviation alerts fired, and whether there were known gate, lift, or security slowdowns recorded by facilities or security teams. Over a few weeks, this creates a pattern library that clearly separates routing or dispatch issues from gate and readiness bottlenecks.
A simple triage checklist can help the Transport Head maintain control-room calm and avoid blame loops: - Compare planned ETA versus actual GPS ETA at campus or gate. - Compare gate-entry timestamp versus system login or workstation-ready time. - Check for app or GPS downtime in the same window in the command center logs. - Overlay incident notes from security and access-control teams for that shift.
images:
If we change a transport policy (pickup windows, escort rules, etc.), how do we measure the impact credibly without creating a ‘Big Brother’ feeling for employees?
B0110 Policy change comparisons without backlash — In India corporate Employee Mobility Services (EMS), what does a credible “policy change comparison” look like—for example changing pickup windows or women-safety escort rules—and how do you isolate mobility impact without triggering employee backlash about surveillance?
A credible “policy change comparison” in Indian Employee Mobility Services compares old and new rules on a small, controlled slice of operations, shows clear before–after impact on OTP, safety incidents, and cost per trip, and does this using auditable transport data rather than broad employee tracking. A defensible comparison isolates mobility variables like pickup windows, routing logic, and escort deployment while keeping HR, legal, and Security satisfied that employee privacy and consent are respected.
A robust comparison starts from a clearly defined policy lever. Typical levers in EMS include pickup windows, night-shift routing rules for women, guard or escort requirements, and seat-fill thresholds. Transport heads usually test one lever at a time. They then track deltas in On-Time Performance, Trip Adherence Rate, incident reports, dead mileage, and cost per employee trip. Command center dashboards and route-level analytics provide this evidence, with SLA-linked KPIs such as OTP% and exception-closure times making the comparison objective.
To avoid surveillance backlash, most organizations limit measurement to trip and vehicle data. They anchor all tracking in trip manifests, GPS device feeds, routing engines, and SOS or alert systems rather than continuous user location. HR and Security frame the change as safety and reliability improvement, not behavior policing. Privacy-sensitive practices include time-bounded location use during active trips, role-based access to data, and clear retention rules aligned with incident investigation and compliance needs under India’s data protection context.
In practice, operations teams often run short pilots on selected shifts or sites. They keep core controls constant, such as driver KYC, vehicle compliance, and night-shift women-safety protocols, while changing only one variable. They then benchmark pilot routes against matched control routes. Facility heads watch for failure modes like increased no-shows, driver fatigue, or new safety complaints, using command center alerts and user feedback to decide whether the new policy becomes standard or is rolled back.
images: 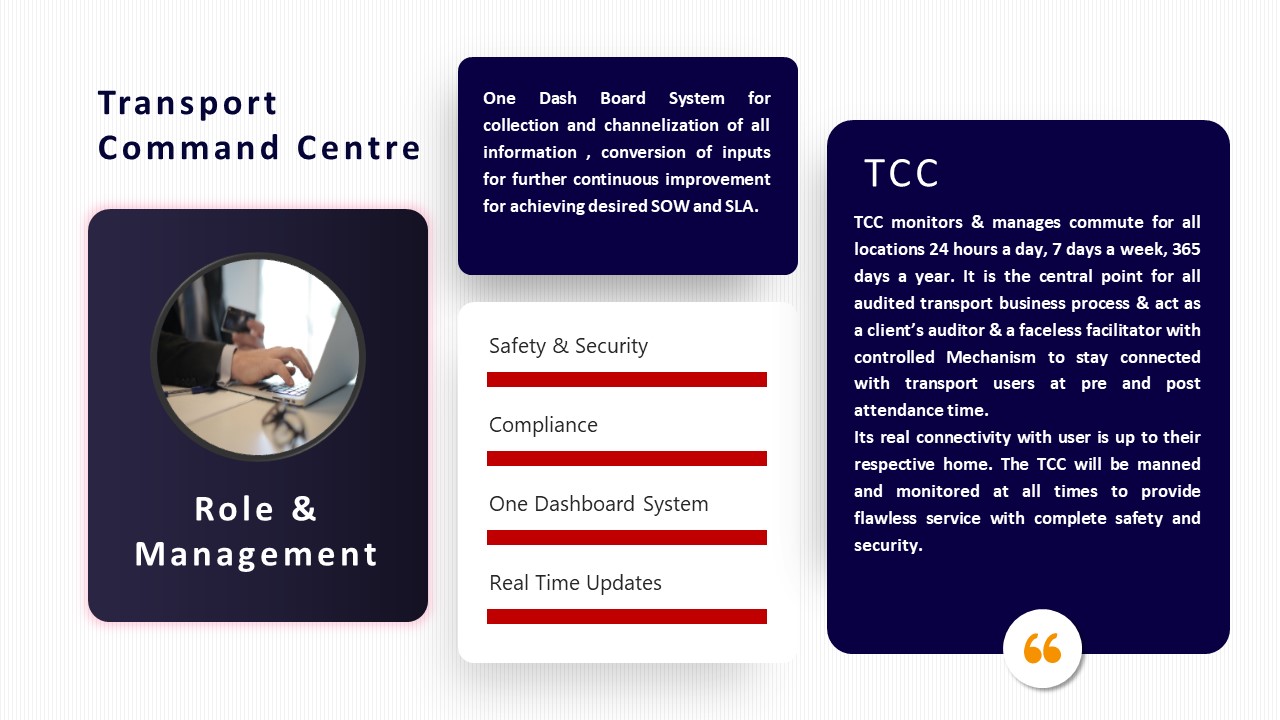
If we link trip GPS logs with HRMS and attendance for analysis, what’s the minimum we should do for DPDP privacy and consent so we don’t get into trouble?
B0111 DPDP-safe data joins for analysis — In India corporate mobility programs governed under DPDP Act expectations, what minimum privacy and consent practices are needed when joining commute telemetry (GPS/trip logs) with HRMS and attendance data for causality analysis?
In India corporate mobility programs that fall under DPDP Act expectations, organizations need explicit, purpose-specific consent, strict data minimization, and role-based technical controls before joining commute telemetry with HRMS and attendance data for causality analysis. They also need documented legal basis, retention limits, and audit-ready logs that show who accessed what joined data and why.
Organizations should first define a narrow, written purpose for the data join, such as reliability and safety analysis, cost optimization, or ESG reporting. The same telemetry and HRMS data should not be repurposed silently for performance appraisal or disciplinary action. Any new purpose requires fresh notice and, where appropriate, fresh consent.
Employee-facing notices should clearly describe what telemetry is collected, what HRMS/attendance fields are linked, why the linkage is done, and how long the combined dataset is retained. Consent should be specific and informed, not bundled into generic “terms,” and employees should have a simple way to withdraw consent for non-essential analytics without losing basic commute entitlements.
Only the minimal fields needed for causality analysis should be used. For most mobility KPIs, pseudonymous identifiers and shift windows are sufficient instead of full names or detailed PII. Analysts should work on de-identified or aggregated datasets whenever possible, reserving identifiable views for exception handling with clear SOPs and approvals.
Joined datasets should be protected with role-based access control, encryption, and well-defined approval workflows. Access, exports, and downstream sharing should be logged to create an audit trail that can be shown to internal audit, regulators, or data protection officers. Retention schedules should delete or irreversibly anonymize raw trip logs and HRMS-linked datasets once the analysis window or statutory requirement ends.
Organizations should also document a privacy impact assessment for the combined telemetry–HRMS processing. This assessment should explicitly consider risks like employee surveillance, profiling, or discrimination. Controls and SOPs should ensure that safety and reliability analytics do not become covert monitoring of individual productivity, which would increase DPDP and employee-trust risk.
How do we keep an audit-ready trail so our claims (like OTP improved shift adherence) don’t fall apart when audit asks for reconciliation?
B0112 Audit-ready attribution evidence — In India enterprise EMS, how do you set up an “audit-ready” evidence trail so that attribution claims (like OTP improved shift adherence) don’t collapse during an internal audit because the underlying trip logs or attendance records can’t be reconciled?
In India enterprise EMS, an audit-ready evidence trail is built by treating every commute event as a single, reconciled “trip record” that links trip logs, GPS data, and HR attendance in one governed flow. The core rule of thumb is that shift adherence claims must be reproducible from raw trip logs forward and from attendance records backward, with no manual edits that break traceability.
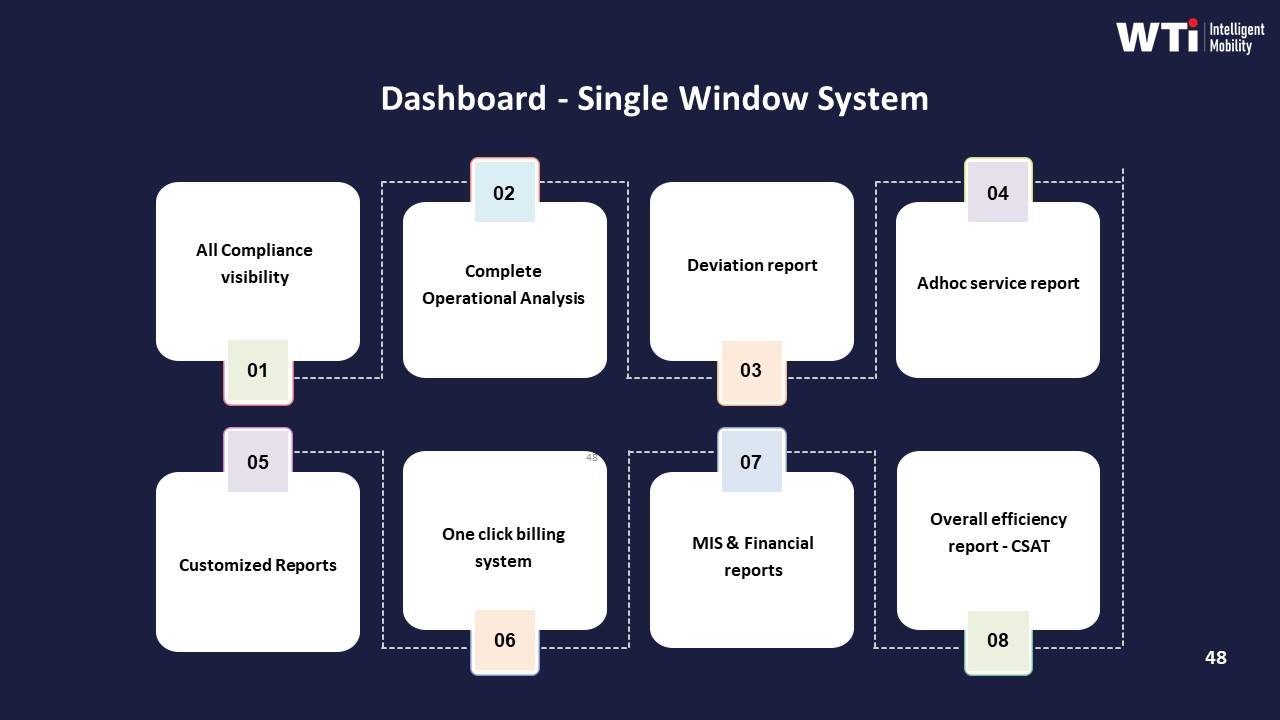
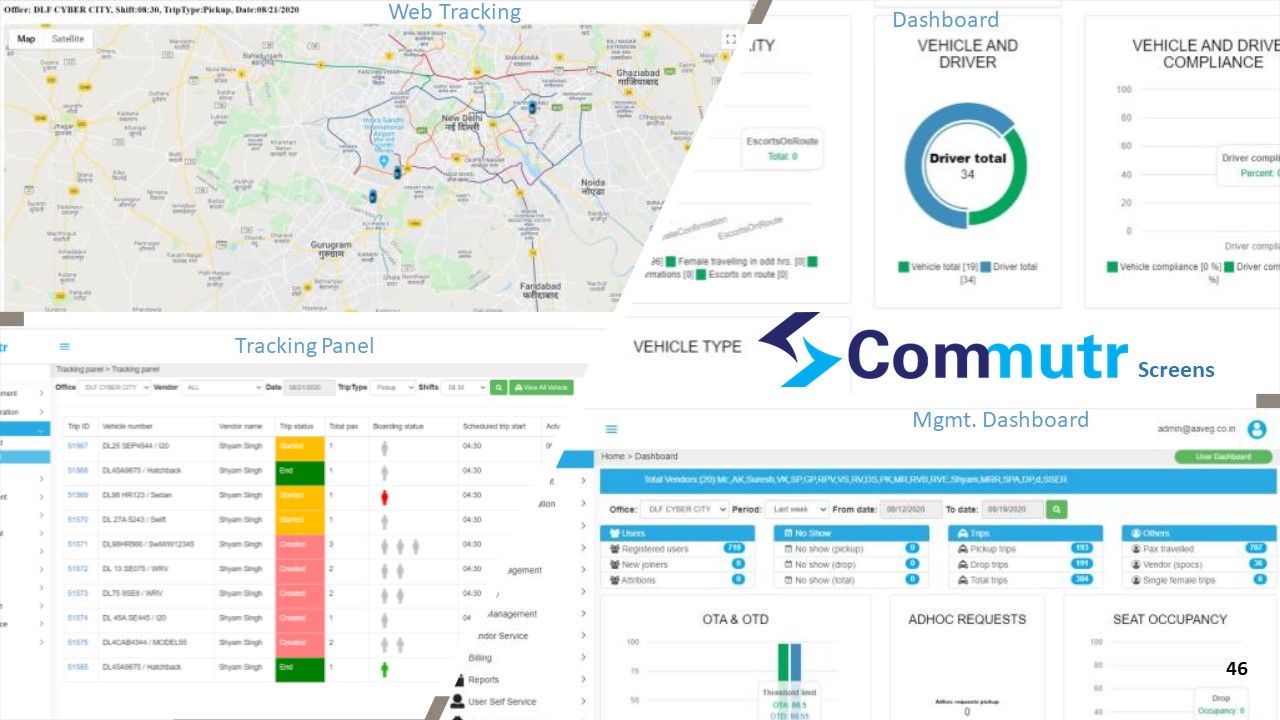
A robust setup starts with a centralized command center and ETS platform that captures trip creation, routing, and closure in a single system. Each trip receives a unique ID that is consistently used across driver app, employee app, GPS feed, billing, and MIS reports. Trip-level data includes planned vs actual times, route, vehicle and driver identity, employee manifest, and SOS or safety deviations. Systems like Commutr and the WTi Mobility dashboard are positioned to provide such single-window visibility and trip lifecycle management.
Audit resilience increases when this mobility data is integrated with HRMS and attendance so that login times, shift rosters, and commute trips share reference IDs or time-keyed joins. Evidence dashboards such as the “Measurable Sustainability Outcomes” and “Dashboard – Single Window System” models show how CO₂ reduction and SLA metrics are backed by trip-level data and summarized in a governed KPI layer.
To prevent attribution claims from collapsing under audit, organizations typically enforce:
- Immutable or versioned trip logs with maker–checker policies for changes, as illustrated in fleet and billing compliance collaterals.
- Clear KPI definitions (OTP, Trip Adherence Rate, CEI) and consistent calculation logic in data-driven insights platforms.
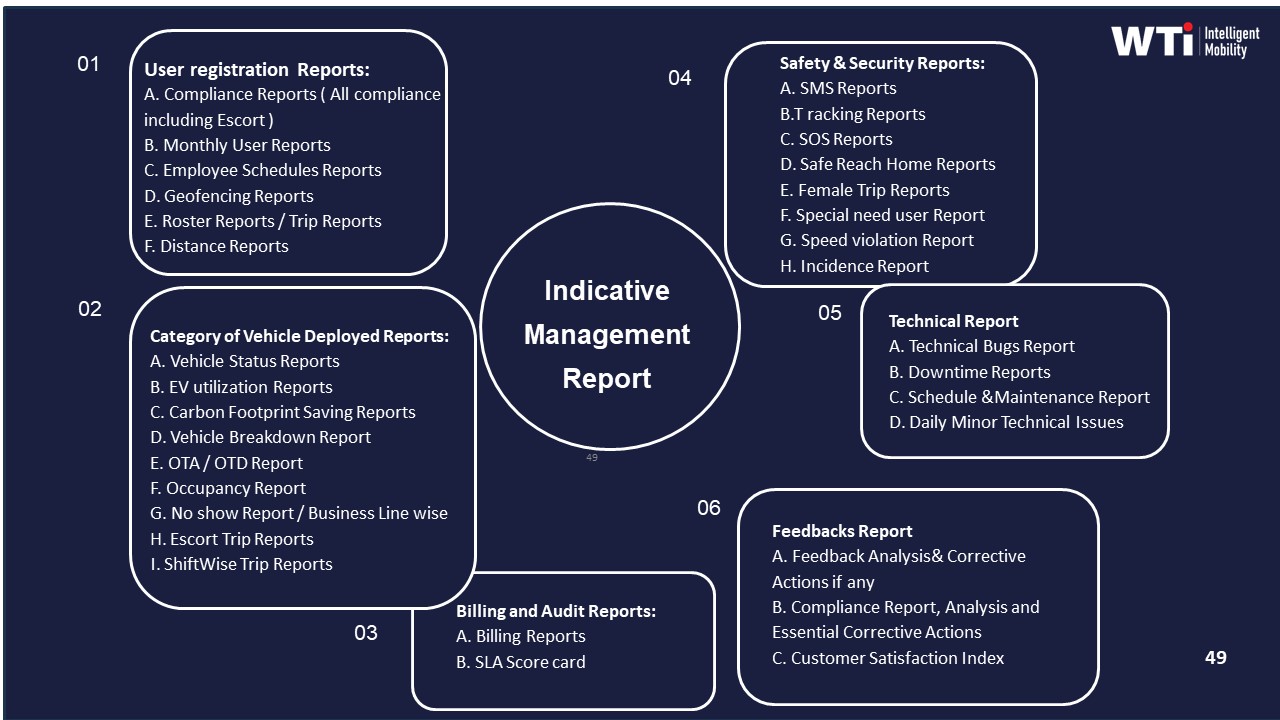
- Cross-system reconciliation between ETS operation cycles, billing systems, and HR-linked rosters, supported by centralized billing and indicative management reports.
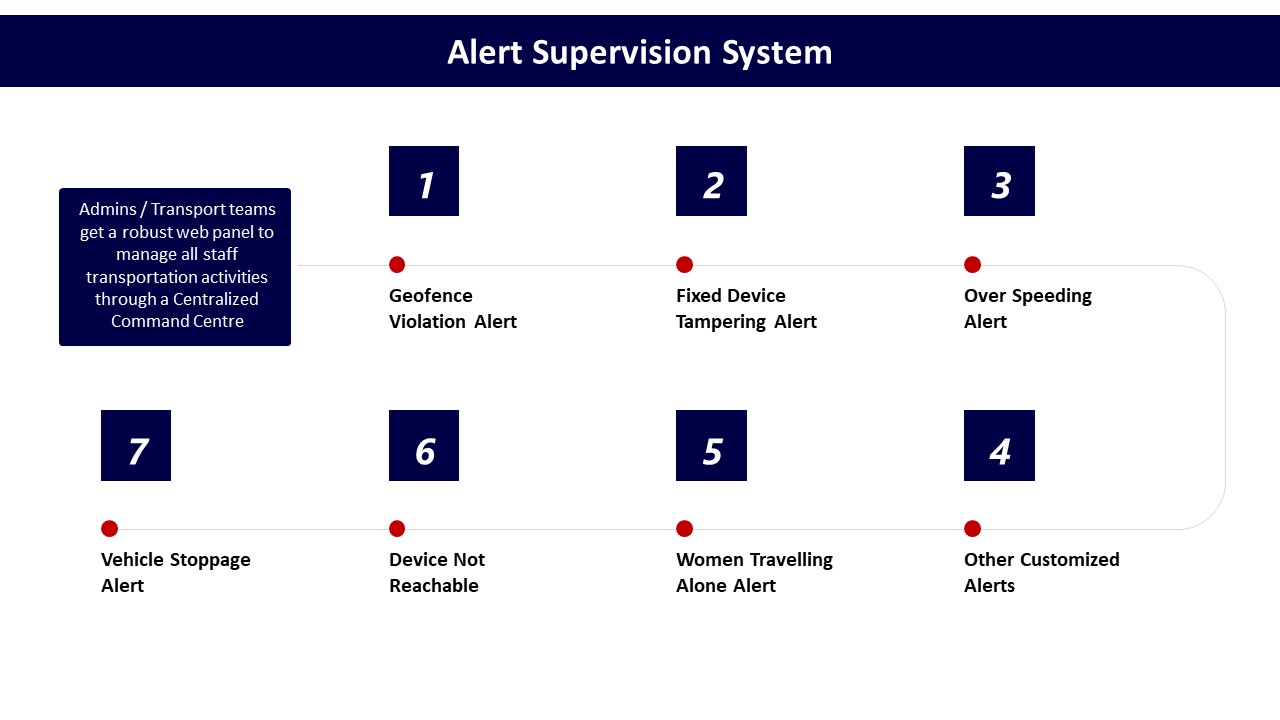
- Documented SOPs for incident handling, safety audits, and route adherence checks, as shown in safety, compliance, and command centre governance materials.
Failure modes usually occur when multi-vendor or fragmented tools are used without a unified command center, when manual rosters are not synchronized with trip systems, or when billing and ESG dashboards are built from separate spreadsheets instead of the primary trip ledger.
Before HR presents a ‘transport improved outcomes’ story to the CEO, what sanity checks should we do so it doesn’t look like dashboard storytelling?
B0113 HR credibility checks before CEO — In India corporate Employee Mobility Services (EMS), what practical thresholds or confidence checks should HR use before presenting a causality narrative to the CEO—so it doesn’t feel like “dashboard storytelling” and damage HR credibility?
In India EMS, HR should only present a “cause–effect” story to the CEO when the patterns are repeatable, cross-validated across systems, and tightly scoped to specific variables like OTP, safety incidents, or attendance. HR credibility improves when commute → outcome narratives are framed as “evidence-backed hypotheses with known limits,” not as absolute claims.
HR teams should first check that core EMS metrics are stable and clearly defined. On-time performance, trip adherence rate, no-show rate, incident rate, and seat-fill or utilization should be measured the same way every month with consistent cut-offs. HR should avoid building narratives on a one-week spike, first-month after go-live, or festival/monsoon periods because EMS operations are inherently volatile in those windows.
A basic threshold is to look for the same directional trend over at least 8–12 weeks for any claimed link, such as “improved OTP has reduced late logins.” This pattern should appear across multiple sites or shifts, not just a single outlier location or team. HR should check that sample sizes are meaningful and that the effect is not driven by one large account, one vendor, or a single high-volume shift.
HR should also cross-check with at least one independent system outside transport dashboards. For example, any claim that “better commute reliability improved attendance” should be supported by HRMS attendance data sliced by shift bands where EMS is actually used. Any claim that “safer night commutes improved women’s retention” should be cross-checked with attrition and complaint data, and with Security or EHS incident logs rather than only vendor reports.
Before talking about causality, HR should test a “confounding factors” checklist. Demand changes from hybrid work, policy changes, salary revisions, project ramp-ups or ramp-downs, and manager-level interventions can all move attendance, attrition, or NPS in the same period. If multiple levers moved together, HR should downgrade the language from “caused by EMS improvement” to “likely contributed, alongside X and Y.”
It is safer to present “causal weight” as ranges or scenarios. For example, “Where OTP improved from 85% to 95% over 3 months on night shifts, late logins dropped by 20–25% for the same employee cohort, with no changes in shift policy.” HR should avoid making this claim where EMS coverage is partial, or where large teams do not depend on EMS for commute.
Practical confidence checks before going to the CEO can be framed as a short internal SOP:
- Has the metric trend held for at least 2–3 reporting cycles with the same definition?
- Is the data reconciled between vendor dashboards, HRMS, and, where relevant, Finance or Security logs?
- Can the same pattern be reproduced on at least one more site, shift band, or time-period?
- Have obvious confounders (policy changes, pay cycles, major org events) been identified and disclosed?
- Is the statement framed as “contribution” or “correlation” unless a controlled pilot or A/B pattern exists?
HR can strengthen the narrative by using “before–after in comparable cohorts” rather than global averages. For example, compare teams where EMS routing was changed or EV fleets introduced to similar teams where nothing changed in the same quarter. Narrower, well-controlled slices reduce the risk of overclaiming.
Finally, HR should always bring caveats and residual risks into the CEO conversation. A short “what we know / what we don’t know yet” slide protects HR from appearing to oversell dashboards. CEOs tend to trust narratives that explicitly name data gaps, acknowledge operational noise in EMS (traffic, weather, vendor changes), and propose next steps such as running a defined pilot or formalizing outcome-linked SLAs, rather than treating one quarter’s trend as permanent proof of causality.
If ROI is uncertain, how should Finance protect downside—phased rollout, outcome-linked pricing, clawbacks—without pushing vendors to game the data?
B0114 Downside protection without data gaming — In India corporate ground transportation, how should a CFO structure “downside protection” if mobility ROI claims are uncertain—e.g., phased rollout, outcome-linked commercials, or clawbacks—without creating perverse incentives that distort operations data?
In India corporate ground transportation, a CFO should structure downside protection by phasing commitments, tying a limited portion of payouts to clearly defined mobility outcomes, and hard‑wiring data integrity rules that make KPI manipulation costly for all parties. The protection has to sit in contract design, not in ad‑hoc negotiation, and it must separate “service reliability and safety baselines” from “stretch ROI claims” like aggressive cost or EV benefits.
A pragmatic starting point is phased rollout with explicit gates. The first phase should be a limited pilot across a few sites or one service vertical such as Employee Mobility Services or Corporate Car Rental Services. Contract language should cap spend, freeze commercials for the pilot, and require a baseline KPI pack for OTP, Trip Adherence Rate, Cost per Kilometer, Cost per Employee Trip, incident rate, and EV utilization ratio before any scale‑up. Progression to the next phase should trigger only when both operations and Finance agree the data is stable and reconciled to Finance systems.
Outcome‑linked commercials work best when applied to a modest band of spend. A CFO can keep a fixed “floor” for essential services and apply incentives or penalties to 10–20% of monthly value indexed to OTP, safety incident rate, seat‑fill, and dead mileage. Reliability, women‑safety compliance, and incident response SLAs should remain non‑negotiable baselines, and only efficiency deltas such as route cost reduction or improved fleet utilization should carry upside or downside. This reduces pressure on vendors to over‑optimize one visible metric at the expense of hidden risks.
To avoid perverse incentives and distorted data, the contract should define a data governance spine. The CFO should insist on API‑level access to raw trip, GPS, and billing data, clear event definitions for each KPI, and a right to independent route adherence audits. Exception closure SLAs should be tracked in the same system that generates invoices, and any KPI used for payouts should be traceable from raw trip ledgers to Finance reconciliation. Random Route Audits and cross‑checks between HRMS attendance logs and transport data help prevent “ghost trips” or manipulated OTP reporting.
Clawbacks should be reserved for structural mis‑reporting, not normal variance. A well‑designed clause can state that if later audits find material gaps between reported KPIs and raw trip evidence over a defined threshold, previously paid incentives can be adjusted or recovered. This protects the enterprise from long‑term overpayment without forcing continual micro‑disputes. It also encourages vendors to maintain internal controls around Audit Trail Integrity, not just surface dashboards.
A CFO can further cap downside risk through lock‑in and exit design. Multi‑year contracts should include annual break options tied to transparent KPI scorecards rather than vague dissatisfaction. Data portability and open APIs should be mandatory, so that if the organization exits a vendor, historical trip and cost data remains usable for rebids and benchmarking. This reduces the fear of being trapped in a weak ROI situation as commute patterns, hybrid work, or EV economics change.
Finally, commercial structures should avoid single‑metric obsessions. CFOs should insist on a balanced KPI basket that spans reliability (OTP%, exception closure time), cost (CPK, CET), safety/compliance (incident rate, credential currency), and experience (complaint closure SLA). Each KPI should carry limited commercial weight, with an aggregate service level compliance index driving incentives. This approach protects downside exposure while preserving truthful operations data, because no one metric is worth gaming at the expense of overall performance.
In a multi-site setup, what are common false wins when we try to attribute improvements, and how can we spot them early?
B0115 Common false wins in attribution — In India multi-site EMS, what are the most common “false wins” in attribution—like improvements that are really due to site ramp-downs, manager strictness, or access-control changes—and how do you detect them early?
In multi-site Employee Mobility Services in India, the most common “false wins” happen when core KPIs improve on paper but are actually driven by external changes such as headcount shifts, policy tightening, or access-control tweaks instead of better transport operations. These false wins usually show up first in reliability, cost, and safety metrics that improve faster than routing quality, driver behavior, or vendor performance.
A frequent false win is an apparent jump in on-time performance that is mainly caused by laxer measurement. This happens when sites start using broader grace windows, treat late but allowed gate entries as “on time,” or stop logging early-route deviations. A second pattern is cost-per-trip reductions that are actually the result of ramp-downs at expensive sites, removal of difficult remote drops, or stricter booking eligibility by managers. A third pattern appears in safety statistics, where incident rates fall sharply after changes in access control, female-escort rules, or complaint logging channels, even though underlying route risk and driver fatigue indices remain unchanged.
Early detection of false wins relies on tying each KPI to a stable denominator and cross-checking against adjacent operational signals. Transport teams can watch for mismatches between OTP improvement and static or worsening dead mileage, trip-fill ratios, and driver attrition. They can compare cost-per-km and cost-per-employee-trip trends with seat-fill and attendance by shift window. They can benchmark incident reductions against unchanged geo-fencing alert volume, SOS activations, and night-shift route density.
The most practical safeguards are simple and repeatable. Operations can lock metric definitions in SOPs so sites cannot quietly change what counts as “on-time” or “incident.” They can tag dataset snapshots by site, timeband, headcount, and policy version so trend lines are always read in context of ramp-ups, ramp-downs, and access rule changes. They can institute exception reviews whenever any metric improves by more than a defined band without parallel improvement in routing efficiency, fleet uptime, or employee satisfaction scores.
Useful signals to monitor include: - Sudden metric improvements coinciding with site closures, large WFH shifts, or removal of remote locations. - Better KPIs where routing complexity, night-shift exposure, and traffic conditions have not changed. - Divergence between dashboard metrics and floor feedback, such as persistent complaints despite “green” OTP.
By treating OTP, CET, safety incidents, and employee feedback as a connected set of indicators rather than isolated scores, organizations can spot attribution errors early and avoid over-crediting short-term policy or footprint changes as sustainable EMS performance gains.
images: 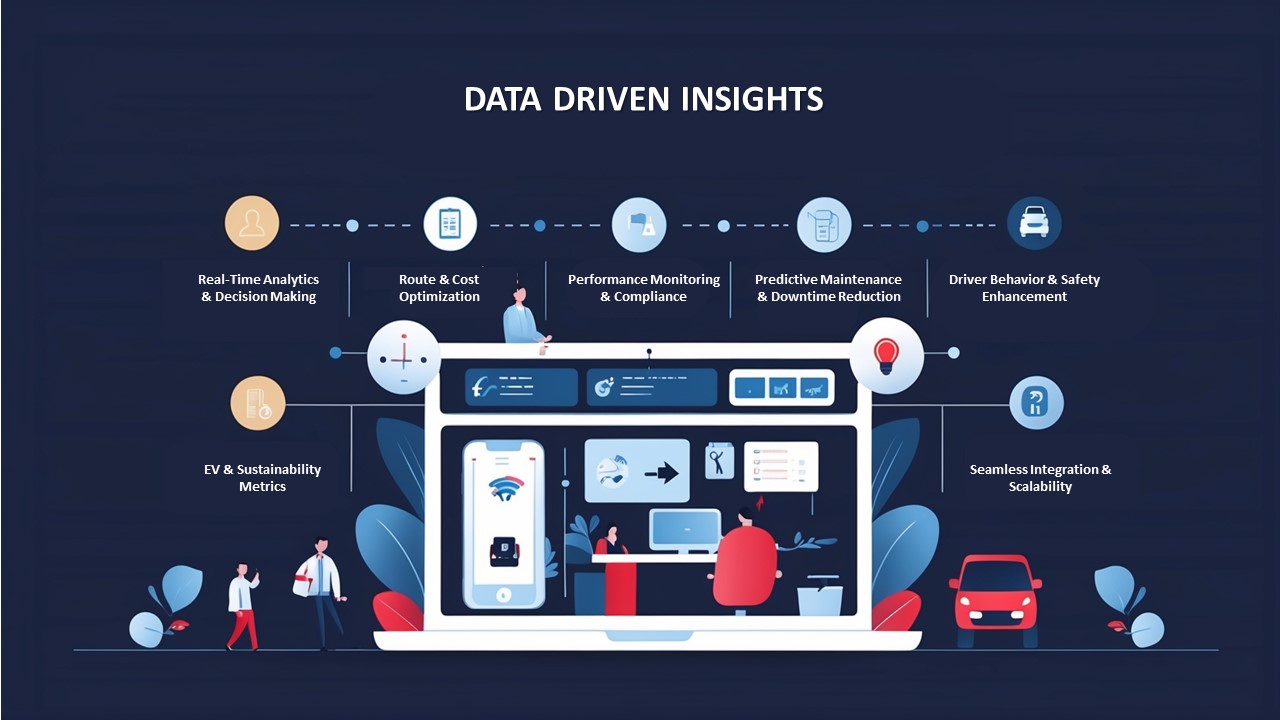
Retention is influenced by so many things—pay cycles, ramps, managers—so how can we credibly link any retention change to commute improvements, and what’s realistic to claim?
B0116 Attributing retention to commute — In India shift-based employee transport, how do you attribute retention changes to commute improvements when attrition is influenced by compensation cycles, project ramps, and manager behavior, and what level of attribution is realistically defensible?
In India shift-based employee transport, organizations can link commute improvements to retention only at a directional and contributory level, not as a single precise percentage driver of attrition. The defensible position is that better mobility improves attendance stability, perceived safety, and commute experience, which in turn reduces avoidable attrition risk, but compensation, project volatility, and manager behavior will always remain dominant co-drivers.
A realistic approach is to treat transport as one controllable factor in a multi-factor environment and benchmark only those deltas that can be tightly tied to mobility data. Organizations can compare teams or sites with similar pay bands and projects but different commute conditions, and they can track changes in attendance patterns, no-show rates, and commute-related complaints before and after mobility interventions such as route optimization, EV introduction, or safety enhancements. When employee surveys explicitly include commute satisfaction questions, movement in those scores alongside stable pay and policy conditions becomes a stronger, though still not exclusive, indicator.
The most defensible attribution level is usually “commute as a secondary but material driver.” In practice, organizations can credibly say that improved EMS reduced transport-frustration exits and night-shift drop-offs, especially among women employees, rather than claiming that transport alone “reduced attrition by X%.” A conservative narrative is to show that commute improvements correlate with better attendance, safety perception, and employee satisfaction scores, and to position retention benefit as a supported hypothesis rather than a mathematically isolated effect.
What’s a realistic minimum setup we can deliver in 4–8 weeks to do basic causality analysis, without launching a full data lake project?
B0117 Minimum viable causality setup — In India enterprise mobility analytics, what is a realistic “minimum viable” causality setup that IT can deliver in 4–8 weeks—data sources, joins, and basic controls—without building a full data lake program?
In India enterprise mobility, a realistic “minimum viable” causality setup in 4–8 weeks focuses on a narrow trip-level spine, 3–4 core source systems, and simple, auditable joins rather than a full data lake program. IT teams can deliver useful cause–effect views on reliability, cost, safety, and emissions by standardizing a canonical trip ID, enforcing basic quality checks, and exposing a handful of governed KPIs in a lightweight analytics layer.
The practical anchor is a single trip lifecycle table. This table should hold trip IDs, timestamps, route and shift data, vehicle and driver tags, and employee or cost-center identifiers taken from the mobility platform’s trip ledger and routing engine. IT can then join this spine to HRMS for shift windows and attendance, to ERP or finance for tariff and billing attributes, and to telematics feeds for GPS and EV battery telemetry where available. This enables basic causality such as “routing pattern → OTP%,” “seat-fill → cost per employee trip,” and “EV utilization → CO₂ intensity per pax-km.”
Minimum controls should include validation of timestamp order within each trip, referential checks for driver and vehicle compliance status, and simple outlier rules for distance and duration. Governance can rely on a small semantic layer defining terms like On-Time Performance, Trip Adherence Rate, Cost per Kilometer, and Emission Intensity per Trip in a consistent way. This approach improves observability and supports outcome-based procurement while avoiding the complexity of a full mobility data lake or advanced anomaly detection engine.
images:
If OTP improved, how do we separate what came from better NOC incident response vs what came from routing changes?
B0118 Separate NOC vs routing impact — In India corporate EMS with a centralized NOC, how do you separate the impact of better incident response (faster escalations) from the impact of routing optimization when attributing improvements in OTP and shift adherence?
In India corporate EMS with a centralized NOC, organizations separate the impact of better incident response from routing optimization by defining different KPI “families,” tagging every trip with event data, and attributing improvements based on when issues are detected and resolved versus when they are avoided by design. Routing optimization shows up in fewer exceptions and structurally better ETAs, while NOC-driven incident response shows up in faster closure times and reduced impact when exceptions still occur.
Routing optimization is primarily a planning and dispatch lever. It changes baseline ETA predictions, dead mileage, seat-fill, and route structure before the trip starts. Its effect on OTP and shift adherence is visible when there are no major disruptions, and when shift windowing and dynamic route recalibration still deliver on-time performance under normal traffic and demand patterns. Improvements from routing are quantified through metrics such as Trip Adherence Rate, Trip Fill Ratio, and reductions in planned versus actual variance on routes without NOC interventions.
Centralized NOC impact is operationalized through real-time monitoring and exception handling. The NOC uses alerts, escalation matrices, and incident workflows to detect deviations early, triage them, and minimize passenger and shift impact. Its value appears in shorter exception detection-to-closure times, lower SLA breach rates for trips that had disruptions, and a higher proportion of “saved” trips that would otherwise have missed shift windows. OTP improvements here come from containment of issues, not from route design itself.
To separate impacts in practice, organizations typically:
- Segment trips into “clean” trips with no exception events and “exception” trips where the NOC intervened.
- Attribute OTP gains on clean trips and reductions in dead mileage predominantly to routing optimization.
- Attribute improved OTP and reduced shift-impact within the exception segment to faster detection, escalation, and closure controlled by the NOC.
- Use pre/post analyses for NOC maturity and routing engine changes separately, avoiding overlapping rollouts where possible.
After a pilot that claims attendance improvement, what’s a practical rule for when we have enough evidence to scale without over-committing?
B0119 Scale decision rule after pilot — In India corporate ground transportation governance, what should be the decision rule for “enough evidence to scale” after a pilot that claims attendance improvement—so HR doesn’t over-commit and Operations doesn’t get stuck with an unproven rollout?
In corporate ground transportation in India, “enough evidence to scale” exists only when HR and Operations have hard, jointly-owned proof across attendance, reliability, safety, and cost—not just a lift in attendance or positive anecdotes. A practical decision rule is to gate any scale-up on a minimum set of quantified outcomes, traceable data, and repeatable SOPs, tested over at least one full roster cycle including night shifts and peak-disruption periods.
HR and Transport leaders should first insist that attendance gains are explicitly linked to commute KPIs. Attendance improvement should correlate with better on-time performance, fewer no-shows, and reduced escalations, rather than coinciding with HR policy changes or seasonal demand dips. This requires a single-window dashboard with auditable trip logs, as seen in WTi’s command center, real-time tracking, and ETS operation cycle collaterals. Evidence must be exportable and verifiable by Finance and Internal Audit, not locked in vendor slides.
A common failure mode is scaling on soft feedback without stress-testing operations under bad weather, driver shortages, or technology glitches. Operations should therefore demand proof that the pilot held its OTP and safety incident rates during at least one disruption scenario, supported by clear BCP playbooks and alert supervision outcomes. HR should also insist that women-safety protocols, SOS flows, and compliance checks worked end-to-end in real trips, with audit-ready logs.
Before committing to wider rollout, decision-makers can use a simple go/no-go checklist: - Attendance and OTP: Attendance uplift is ≥ a pre-agreed threshold, and OTP/route adherence meet target bands with WTi-style “Management of on Time Service Delivery” reporting. - Safety and compliance: Zero serious safety incidents, full driver and fleet compliance documentation, and working SOS/women-safety mechanisms, supported by central compliance dashboards. - Operational stability: Command-center workflows, escalation matrix, and BCP steps were actually used during the pilot and reduced firefighting, not just documented. - Cost and leakage: Cost per trip and per km are stable or improving, and billing data reconciles cleanly with trip logs and Finance, using the kind of centralized billing models and reports shown in the billing collaterals. - Repeatability: SOPs for routing, driver management, and shift briefings are written, trained, and followed in at least two locations or teams, so the model is not dependent on a single “hero” manager.
Only when these conditions are met, and when HR, Transport, Finance, and Security each sign off on their slice of evidence, does a pilot move from “promising” to “proven enough to scale” without over-committing HR or overloading Operations.
causality framing & governance for leadership credibility
Define attribution versus correlation, agree on pre/post windows and confounders, and set governance so CFOs and executives trust the analysis.
How do we manage the HR vs Finance conflict when HR wants EX-based impact stories but Finance only trusts hard metrics like OTP and cost per trip?
B0120 Resolve HR-Finance attribution conflict — In India employee transport programs, how do you handle stakeholder conflict when HR wants to attribute improvements to “employee experience” initiatives while Finance insists on hard operational metrics like OTP and cost per trip?
In Indian employee transport programs, stakeholder conflict between HR’s “employee experience” narrative and Finance’s OTP and cost-per-trip focus is best handled by designing one shared measurement framework where experience outcomes and hard ops metrics are explicitly linked instead of competing. The transport or facility head usually stabilizes this by running a command-center style operation with common KPIs, clear SOPs, and a single source of truth that both teams can defend during reviews and audits.
Most organizations reduce friction when they treat commute experience as an output of governed operations rather than a parallel initiative. HR’s commute NPS, satisfaction scores, and complaint trends sit on the same dashboard as OTP%, Trip Adherence Rate, seat fill, dead mileage, and cost per employee trip. This allows HR to show that “experience” improved after concrete levers such as routing optimization, driver training, business continuity playbooks, and centralized alert supervision were tightened. It also allows Finance to see that better experience coincides with higher fleet uptime, lower incident rates, and more predictable billing.
A common failure mode is when HR runs narrative-led “experience” programs without access to trip-level data, while Finance blocks investments because improvements are not tied to CO₂ reduction, cost per km, or SLA performance. A shared transport command center with real-time visibility, integrated HRMS rosters, and measurable safety controls gives both sides what they need. HR gets auditable proof on safety, women-centric protocols, and satisfaction lifts. Finance gets reconciled OTP and cost baselines, automated billing logic, and clean audit trails.
In practice, conflict eases when quarterly reviews are reframed around a small, agreed set of joint KPIs, for example:
- Reliability KPIs owned by Ops but reported to both HR and Finance.
- Safety and women-safety KPIs co-owned by HR and Security.
- Cost and utilization KPIs owned by Finance but explained with operational context.
Once those links are visible in one dashboard, HR can legitimately attribute improvements to “employee experience” while Finance remains comfortable that every claim is backed by operational and financial metrics that are continuously monitored and auditable.
What metric definitions do we need to lock upfront (late login, no-show, pickup OTP, gate time) so later analysis doesn’t become a definition fight?
B0121 Lock metric definitions upfront — In India corporate mobility contracting, what operational data definitions must be agreed upfront (late login, no-show, pickup on-time, gate time) so that later causality analysis isn’t derailed by arguments about metric definitions?
In India corporate mobility contracts, organizations need explicit, written operational data definitions for each trip milestone and exception before go-live. Clear, time-stamped definitions prevent blame-shifting and make root-cause analysis and penalties auditable instead of negotiable after incidents.
The core principle is that every KPI must be linked to a precise “clock” (which system time, which event), a location reference (gate, GPS point, or app event), and a responsibility boundary (vendor vs employee vs client-side infra). Ambiguity at any of these three layers later turns into disputes between HR, Transport, vendors, and Finance when reconciling OTP, billing, and safety escalations.
At minimum, the following should be contractually defined and system-implemented as fields in the trip lifecycle:
- Pickup On-Time. Define the pickup time reference (scheduled roster time vs revised time after official change). Define the tolerance band (e.g., +/– X minutes). Specify which timestamp is authoritative (driver app “arrived at pickup” event vs employee boarding time) and how GPS/device failures are treated.
- Employee No-Show. Define the exact cut-off window (e.g., driver waits Y minutes from scheduled time or arrival, whichever is later). Define required driver actions (call attempts, app status update, photo/log). Specify when the trip converts from “delay” to “no-show” and who bears cost and SLA impact.
- Late Login / Late Logout. Clarify whether “late login” is measured against shift start or contracted buffer (e.g., employee must be at gate Z minutes before shift). Define which system is the source of truth (HRMS access log vs manual attendance) and how transport-caused vs employee-caused lateness will be distinguished during RCA.
- Gate Time / Campus Time. Define “gate-in” and “gate-out” as specific GPS or access-control points. Decide whether OTP is measured to gate entry, building entry, or seat-at-desk and which is in vendor scope. Capture separate timestamps for gate arrival vs actual drop so traffic vs internal campus delays can be separated.
- Trip Start and Trip End. Define when trip start time is recorded (engine on, driver swipe, first pickup boarded, or gate exit). Define trip end as last drop, gate entry, or engine off. These anchors drive per-km billing, dead mileage classification, and utilization metrics.
- Routing & Deviation. Define “approved route” (system-generated vs transport-approved manual route). Specify what counts as a “route deviation” (distance or time threshold) and how exceptions for diversions (police barricades, road closures, monsoon detours) are logged and exempted from penalties.
- Vehicle Reporting Time. Define when a vehicle is considered “reported” for duty (arrival at client-designated point vs first pickup). This underpins standby payments, buffer fleet usage, and event/project SLAs.
- Cancellation & Cut-off. Define employee, admin, and vendor-side cancellation cut-off times and the status codes (auto-cancel, chargeable cancel, system error). This is crucial to avoid later disputes about whether a missed pickup is a no-show or an approved cancellation.
- Incident & SOS Event. Define what constitutes a “safety incident” vs a “service complaint” and the required data elements (time, location, vehicle/driver ID, trip ID, SOS trigger). This separation is essential for Safety/EHS investigation versus routine service reviews.
A robust practice is to maintain a shared “Trip Data Dictionary” between client, vendor, and command center. This dictionary should map every event code and timestamp to a business meaning, a system of record, and SLA/commercial impact. Without this shared schema, causality analysis across HRMS, transport apps, and billing becomes opinion-driven and undermines both OTP governance and outcome-based contracts.
If our sites have different shifts, gate processes, and vendor mixes, how do we design matched cohorts that aren’t biased from the start?
B0122 Matched cohorts across diverse sites — In India corporate EMS, how do you design a matched-cohort study when different sites have different shift timings, security gate processes, and vendor mixes, so the comparison is not fundamentally biased?
In India corporate employee mobility services, a matched‑cohort study remains unbiased only when cohorts are defined at the same “operational grain size” and are matched on the variables that actually drive reliability, cost, and safety. The design must therefore match at the level of shift‑window, route‑type, and operational model, not at the level of whole sites or vendors.
A common failure mode is comparing “Site A vs Site B” when Site A has different shift bands, security gate dwell, and vendor capabilities. That approach confounds core EMS outcomes such as on‑time performance, seat fill, and incident rates. A more reliable design isolates comparable commute patterns by stratifying the population first and matching only within those strata.
In practice, organizations typically stratify routes by shift window, urban context, and security process complexity. They then define matched cohorts as routes or employee groups that share similar timebands, route lengths, and gate requirements, while holding women‑safety rules, escort policies, and compliance baselines constant. Vendor mix differences are treated as an exposure variable only inside these tightly matched buckets, and outcomes such as OTP, cost per employee trip, incident rate, and complaint closure time are then compared within each bucket.
To guard against residual bias, most teams use centralized command‑center telemetry to standardize measurement definitions across sites. They also ensure consistent data capture for GPS traces, roster patterns, gate dwell times, and safety incidents before drawing any conclusions about the impact of a new routing engine, vendor mix, or EV penetration on service reliability or cost.
What are signs vendors or ops teams might game the metrics (like calling delays ‘no-shows’), and how do we catch it early?
B0123 Detect gaming in attribution data — In India corporate employee mobility, what are the operational signs that an attribution model is being “gamed” (for example, marking trips as employee no-shows to protect OTP), and how should governance catch that early?
In India corporate employee mobility, “gaming” an attribution model usually shows up as patterns that protect vendor SLAs on paper while real on-ground reliability or safety is deteriorating. Governance needs to treat OTP, no-shows, routing, and incident data as a single audit trail, not isolated metrics that vendors can manipulate.
Operational gaming often appears as abnormal label patterns in trip data. A common example is a rising “employee no-show” rate on certain routes or timebands while HR attendance data does not show corresponding absenteeism. Another pattern is trips marked “on time” even though drivers or employees report late actual arrival, which can be detected by comparing GPS traces, app check-in times, and access-control or HRMS punch-in logs. Frequent last‑minute route changes or manual overrides that conveniently restore OTP on dashboards while complaint volume or escalation calls increase is another strong signal.
Governance should design the command center, routing engine, and billing workflows so no single party can change attribution outcomes without leaving an auditable trace. The command center can run periodic route adherence audits that cross-check OTP and no-show tags against raw telematics, SOS events, and complaint tickets. HR, Finance, and Transport can review exception reports jointly so misalignment between reported OTP, billing claims, and employee feedback is surfaced early.
Practical controls include: - Threshold alerts when “no-show” or “trip cancelled by employee” rates spike for specific shifts, vendors, or locations. - Randomized route and trip audits with playback of GPS and app logs to verify the assigned attribution tag. - Outcome-linked commercials that use blended metrics such as OTP, complaint closure SLAs, and Trip Adherence Rate rather than a single OTP percentage. - Clear SOPs for when a trip can be labelled “no-show” or “cancelled” and mandatory evidence (timestamps, call logs, screenshots) stored in a central mobility data lake.
images:
How do we share results with employees/managers using GPS and access-control data without it feeling like surveillance?
B0124 Communicate results without surveillance optics — In India enterprise mobility analytics, how do you communicate attribution results to employees and managers in a way that improves trust—especially when GPS and access-control data are involved—so it doesn’t feel like surveillance?
In India enterprise mobility analytics, trust improves when organizations frame GPS and access‑control attribution as a safety and service tool with strict boundaries, not as individual surveillance, and then prove those boundaries through transparent policies, limited metrics, and visible benefits for employees. Trust collapses when commute data is used opaquely, or when managers infer performance or discipline decisions from location traces without clear consent and governance.
Communication works best when it follows a few clear rules. Organizations should explain in plain language what trip data is captured from the employee app, driver app, IVMS, and access control systems and why it is needed for OTP, roster accuracy, women‑safety compliance, and business continuity. They should state explicitly what the data will never be used for, such as individual productivity scoring, informal attendance policing outside agreed HRMS rules, or any non‑transport purpose, and then align this with documented HSSE and compliance frameworks. This approach mirrors how centralized command centers, alert supervision systems, and safety dashboards are presented as safeguards and audit tools rather than spy layers.
Attribution dashboards for managers should be designed at the level of routes, shifts, vendors, and fleets, not at the level of named individuals unless a safety or incident investigation SOP is triggered. Employees should see their own trip history, SOS logs, and “safety proof” (for example, time‑stamped pickup/drop and escort compliance), so that the same data that protects the organization also protects the rider in case of disputes. When presenting results, transport teams should talk in terms of service KPIs like on‑time performance, seat fill, CO₂ saved through EVs, or incident‑free night shifts, rather than “who was where at what time.” This reinforces that analytics are being used to improve routing, uptime, and safety protocols, similar to how EV dashboards and CO₂ reduction reports are used for ESG and CSR transparency rather than for individual monitoring.
Clear SOPs and escalation matrices are essential. A documented process should define who can see identifiable GPS and access‑control data, under what conditions, and for how long it is retained, keeping chain‑of‑custody and auditability in mind. Safety and compliance teams should anchor communications in existing frameworks such as centralized compliance management, women‑centric safety protocols, and business continuity plans, demonstrating that data access is exception‑based and logged, not discretionary. Regular floor connects, shift briefings, and “safety first” sessions give employees a forum to ask questions about how attribution works and to see that controls like SOS panels, geo‑fencing alerts, and command centers are active safeguards.
When attribution insights are shared with leadership, they should stay aggregated and outcome‑linked. For example, organizations can show that dynamic routing during monsoon conditions improved OTP to 98%, that EV adoption reduced carbon emissions compared to diesel baselines, or that safety inspection checklists and driver training led to lower incident rates. This positions mobility analytics as part of operational excellence and ESG commitments rather than as an HR surveillance channel. Over time, consistent behavior—using data to fix routes, adjust vendor capacity, and invest in safety tools, instead of to micro‑monitor individuals—is what ultimately convinces employees and managers that enterprise mobility analytics serves their interests as much as the organization’s.
How can Internal Audit validate a claim like reduced late logins using trip logs and attendance data, without disrupting daily operations?
B0125 Audit validation without operational disruption — In India corporate ground transportation, what’s the best way for Internal Audit to validate a causality claim (like reduced late logins) using traceable trip logs and attendance records without disrupting daily EMS operations?
The most reliable way for Internal Audit to validate a causality claim such as “improved transport reduced late logins” is to run a controlled, evidence-backed time-series analysis that links immutable trip logs to HR attendance data, while keeping all checks off the live EMS workflow and using read-only data access.
Internal Audit should first treat the EMS platform and command-center stack as the system of record for trip events. Trip-level logs, GPS traces, route adherence reports, OTP% and exception tickets form the auditable evidence pack for “service reliability.” HRMS attendance and login data form the independent evidence pack for “employee punctuality.” Causality is validated only when patterns in these two data sets move together in a consistent and time-aligned manner.
The least disruptive approach is for Internal Audit to request a fixed look-back window, for example three to six months, covering “before” and “after” a transport change such as a new routing engine, EV fleet deployment, or vendor transition. Data extraction should be done via read-only dashboards or exports from the EMS command center and HRMS, without pausing or altering live rosters, routing, or driver apps.
For each day in scope, audit can construct a linked, depersonalized table with:
- a transport-side view with route ID, shift window, scheduled vs actual pickup/drop times, OTP flag, and any incident or exception code
- an HR-side view with shift code, planned start time, actual login timestamp, and late-login flag as per policy
The link key should be an anonymous employee identifier and shift date, so privacy and DPDP principles are respected while preserving analytical integrity.
Auditors can then segment the time-series into “pre-change” and “post-change” periods and compute:
- change in OTP% and Trip Adherence Rate (transport KPIs)
- change in late-login rate and average login delay (attendance KPIs)
A causal claim gains strength when improved transport KPIs and improved attendance KPIs align in time, are consistent across multiple weeks, and hold across major routes or sites, not just a single corridor.
To avoid disrupting daily EMS operations, Internal Audit should:
- use the existing command-center dashboards, deviation and service reports, and mobility data lake views as primary evidence
- align with the transport head on audit windows and sampling, so route planners and dispatch teams are not asked for ad-hoc manual data during peak shifts
- rely on already-configured indicative management reports, compliance dashboards, and ETS/EMS operation cycle logs rather than introducing new manual reporting
A common failure mode is to accept correlation at face value without checking for confounders like shift-pattern changes or HR policy tweaks. Internal Audit should therefore cross-check with HR and Transport for any parallel changes in hybrid-work rules, shift definitions, or leave policies during the same window, and explicitly document these as part of the causality assessment.
After an incident, how can HR quickly answer ‘how often does this happen?’ using joined HRMS, trip, and attendance data without contradicting ops logs?
B0126 Panic-button reporting after incidents — In India corporate EMS, when an auditor or leadership asks “How often does this happen?” after a commute incident, how can HR use the same joined datasets (HRMS + trips + attendance) to answer quickly and consistently without contradicting Operations’ incident logs?
In Indian corporate EMS programs, HR can answer “How often does this happen?” reliably only when HRMS, trip data, attendance, and incident logs are treated as one governed dataset with a shared definition of incidents and a single reporting pipeline. The core principle is that HR, Transport, and Security must read from the same “source of truth” KPI layer instead of maintaining parallel spreadsheets or ad-hoc reports.
The first requirement is a unified trip lifecycle record. Each trip needs a unique ID that is consistent across the EMS platform, the command centre dashboard, driver apps, and HR-linked systems. Incident flags, SOS activations, geo-fence violations, delays, and safety non-compliances must be attached to that trip ID rather than stored as free-text narratives. Operations incident logs then become metadata on the same record, not a separate narrative system.
The second requirement is HRMS-attendance linkage at employee-trip level. Each employee’s trip manifest should be linked to rostered shifts and actual login/logout data in HRMS. This linkage allows HR to distinguish between commute-related issues and unrelated attendance variance. It also supports repeatability, because HR can define standard ratios such as “incident rate per 1,000 trips” or “late arrivals explicitly tagged as commute-related.”
The third requirement is a canonical KPI and definition library. HR, Transport, and Security must agree on precise definitions for an “incident,” “near miss,” “safety violation,” “SLA breach,” and “commute-related late login.” These definitions must be encoded in the reporting logic, so that dashboards, management reports, and audit extracts always compute the same numbers. This reduces the risk of HR presenting softer counts while Operations shows a stricter log.
To operationalize this, organizations typically centralize observability in a command centre or NOC. Trip events, alerts, and closures are streamed into a mobility data store that also receives HRMS roster data and basic attendance fields. A governed semantic layer on top of this store then exposes agreed metrics: total trips, trips with any safety flag, SOS usage, verified women-safety escorts, on-time performance, and commute-linked late logins. HR can then answer leadership and auditors using these metrics without manual reconciliation.
A disciplined incident management workflow is also critical. Each incident should move through a standard cycle of detection, triage, escalation, investigation, closure, and preventive action, all time-stamped against the trip ID. Operations teams continue to work in their native consoles, but the status and categorization fields they update feed directly into the shared dataset. HR can then report how many incidents occurred, how many are closed, and what corrective actions were implemented, using the same numbers that Operations uses for SLA reviews.
To make this usable for HR in real time, three practical outputs are helpful:
- A standard “Commute Incident Summary” view that shows counts and rates over any selected period, segmented by site, shift band, gender, vendor, and route cluster.
- A simple filter for “safety-critical” versus “service-quality” events, so HR can immediately separate reputationally sensitive cases from routine delays.
- Drill-through capability from aggregate numbers to anonymized trip-level entries for audit discussions, while keeping personal data governed under privacy rules.
When this structure is in place, HR can respond to “How often does this happen?” with stable, repeatable metrics such as “X safety incidents per 100,000 trips in the last quarter, all investigated and closed,” instead of ad-hoc counts. Operations’ logs no longer contradict HR, because both teams are consuming different views of the same joined dataset. This reduces defensive conversations, supports audit readiness, and lets leadership see commute safety and reliability as governed, rather than anecdotal.
What review cadence works best so attribution insights actually lead to policy changes and don’t become a report nobody trusts?
B0127 Governance cadence for attribution learning — In India enterprise employee transport, what governance cadence (weekly ops review vs monthly steering committee) best supports attribution learning—so insights turn into policy changes instead of becoming a report nobody trusts?
In India enterprise employee transport, a weekly operational review paired with a monthly cross-functional steering committee creates the strongest attribution learning loop, because it separates fast, data-driven troubleshooting from slower policy and commercial decisions. Weekly reviews keep OTP, safety, and cost signals close to the ground, while monthly governance turns repeated patterns into contract terms, routing policies, or SOP changes.
A weekly cadence works best when it is transport-led and NOC-anchored. It should focus on a tight KPI set such as OTP%, Trip Adherence Rate, exception closure time, seat-fill, incident logs, and driver fatigue or absenteeism patterns. The goal of this forum is not to “explain” performance but to agree on specific corrective actions for routes, vendor shifts, driver coaching, or app workflows. Weekly reviews fail when every metric is debated and no owner or closure SLA is assigned.
A monthly steering committee is most effective when HR, Finance, Procurement, Transport, Security/EHS, ESG, and IT participate. This forum should only discuss items that have appeared multiple weeks in a row in the ops reviews. It can then safely adjust policies such as escort rules, hybrid-work routing norms, vendor tiers, EV vs ICE fleet mix, or outcome-linked commercial levers. Monthly governance fails when it re-questions the underlying data instead of using weekly evidence packs from the command center.
The most reliable pattern is:
- Weekly: command-center–driven service review with root causes, actions, and owners.
- Monthly: steering committee that only consumes pre-validated weekly trends and converts them into policy, contract, or technology roadmap changes.
What should HR leadership ask to make sure our causality analysis doesn’t expose PII or create a DPDP issue when we join HRMS and trip data?
B0128 CHRO checks for PII risk — In India corporate Employee Mobility Services (EMS), what should a CHRO ask to ensure a causality analysis won’t accidentally expose sensitive PII or create a DPDP compliance incident while joining HRMS and trip telemetry?
In India EMS programs, a CHRO should insist that any causality or correlation analysis between HRMS data and trip telemetry is designed so that the analytics team never needs raw, directly identifiable employee data and that every data join is governed by explicit legal basis, minimization rules, and technical controls aligned to the DPDP Act.
The CHRO should first ask for a written description of the exact data fields that will be pulled from HRMS and from the transport platform. The CHRO should require that the vendor or internal team justifies why each field is needed for the analysis and confirms that directly identifying fields such as full name, personal phone number, or government IDs will not be used. The CHRO should also ask whether pseudonymized or tokenized employee IDs will be used for joining HR and trip data instead of direct identity fields.
The CHRO should ask how consent or legitimate purpose for this specific analysis is documented. The CHRO should also ask how long the joined dataset will be retained and whether it will be stored separately from production HRMS and mobility systems. The CHRO should require clarity on who can access this joined dataset and whether role-based access and audit logs are enabled for every query that touches joined HR–telemetry data.
The CHRO should ask how incident reconstruction and safety analytics will be handled without exposing unnecessary PII, and how the team will prevent “function creep,” such as using commute telemetry for performance evaluation without policy approval. The CHRO should also ask IT and Security to confirm that the architecture uses an integration layer or data lake with governed schemas rather than ad-hoc exports, so that any future analyses remain within an auditable, DPDP-aligned framework.
When evaluating vendors, how do we tell who can really support causality (clean exports, consistent IDs, explainable methods) vs who just has nice dashboards?
B0129 Separate real causality from dashboards — In India corporate mobility vendor evaluations, how can Procurement distinguish between vendors who can truly support causality (clean data exports, consistent IDs, explainable methods) versus vendors who only provide attractive dashboards?
Procurement can distinguish causality-capable mobility vendors by forcing the conversation away from dashboards and into data structures, exportability, and method transparency. Vendors who support causality provide clean, reconcilable trip data with stable IDs, raw exports, and documented calculation logic, while “dashboard-only” vendors resist detail and rely on screenshots or PDFs.
A practical test is to ask each vendor to walk through their trip data model. A causality-ready vendor can show how employee, vehicle, driver, route, and trip records are linked through consistent primary keys over time. A weak vendor talks about “views” and “charts” but cannot describe how a specific trip ID flows from roster creation to invoice and ESG emission output. Procurement can then require sample anonymized raw exports that include trip lifecycle timestamps, vehicle tags, and fare components. Causality-supporting vendors can provide these in CSV or via API with a clear schema and data dictionary.
Procurement should also insist on explainable KPIs and emission metrics. Strong vendors can show formulae for OTP, Cost per Employee Trip, EV Utilization Ratio, and emissions per trip, and can reconcile an on-screen number back to underlying trips. Dashboard-only vendors struggle to explain how figures are derived and cannot support audit trails.
Concrete checks Procurement can embed in RFPs include:
- Mandatory raw-data export formats and frequency.
- Stable ID requirements for employees, vehicles, drivers, and trips.
- Sample reconciliation: “Prove this monthly OTP and CO₂ number from 10 sample trips.”
Vendors that welcome these tests typically support causality. Vendors that defer, generalize, or restrict access usually only sell attractive dashboards.
For our shift commute program, how do we prove OTP improvements actually led to better attendance and shift adherence, and it’s not just seasonality or roster changes?
B0130 Proving OTP caused attendance gains — In India-based Employee Mobility Services (EMS) for shift commutes, how can an HR leader credibly isolate whether improved on-time pickup (OTP) actually caused better attendance and shift adherence, rather than being driven by seasonality, roster changes, or site ramp-ups?
In India-based Employee Mobility Services, an HR leader can credibly test whether better on-time pickup (OTP) caused improved attendance and shift adherence by treating OTP changes as a measurable “intervention” and comparing outcomes against clean baselines and control groups, while controlling for roster, seasonality, and ramp-up effects in the underlying data.
First, HR leaders need access to joined, time-stamped data from EMS and HR systems. Shift-wise OTP, trip adherence, and exception logs must be aligned to attendance, late-login markers, and no‑show records. Mobility operations already generate telematics and OTP metrics, and HRMS provides attendance and shift adherence data, so integration is primarily a data-joining and timestamp-alignment exercise.
Next, HR can use quasi-experimental comparisons instead of raw correlations. One common pattern is to compare similar shift windows or sites where routing, vendor governance, or command-center controls significantly improved OTP, against sites or timebands where operations remained stable. Another pattern is to compare pre/post windows for a routing or vendor-change rollout, holding attendance policy and roster rules constant.
HR should also explicitly control for confounders that are common in Indian EMS environments. Seasonality can be addressed by comparing like-for-like periods across years for the same sites and shift windows. Roster changes and site ramp-ups can be controlled by segmenting analysis by team, process, or headcount band, and by tracking when new lines of business or locations went live.
A practical approach is to define a small set of diagnostic views:
- Shift-level panels that show OTP%, attendance, and late-login rates over time for a fixed set of employees.
- Site or process comparisons where routing and OTP improved but roster rules and workforce size remained stable.
- Exception-focused cuts that track employees most exposed to delayed trips and test whether their attendance moves with OTP changes.
Centralized command-center operations and data-driven insights platforms already used in EMS can support these diagnostics by surfacing trip adherence, OTP, and exception-closure SLAs in a single window. When those operational metrics are consistently aligned with HRMS-attendance improvements in controlled comparisons, HR can more credibly argue that OTP reliability is a primary driver of better attendance and shift adherence, rather than a side effect of unrelated changes.
images:
If we change routing or pooling, what’s a practical way to do pre/post analysis on late logins using HRMS and attendance data without over-claiming impact?
B0131 Pre/post design for policy changes — In India corporate Employee Mobility Services (EMS), what is a practical pre/post analysis design to measure the impact of a route optimization or pooling policy change on late logins, using HRMS and attendance data without over-claiming causality?
A practical design is a before–after cohort analysis around the go‑live date, anchored on clear operational hypotheses, with tight controls for confounders and explicit limits on causal claims. The analysis should treat “late logins per shift” and “share of employees late due to transport” as primary outcomes derived from HRMS and attendance logs.
First, operations and HR should jointly define a clear intervention window. The organization should select a go‑live date for the new routing or pooling policy and freeze other major changes to shifts, work‑from‑home policy, and vendor mix during a short observation window around it. The team should create stable employee cohorts by including only employees whose shift pattern, location, and entitlement rules remain unchanged across pre and post periods.
The pre period should typically span 4–8 weeks of stable operations before the change. The post period should match this duration after a short stabilization buffer, for example excluding the first 1–2 weeks after go‑live while drivers and employees adapt. Attendance and HRMS data should be used to compute per‑day, per‑shift metrics such as percentage of employees logging in late, average delay minutes among late employees, and late incidence for employees tagged as using EMS versus those not using EMS.
The analysis should group shifts and locations that share the same routing change. It should compare pre/post trends within these “treated” groups and simultaneously use internal comparison groups unaffected by the policy, for example sites or shifts where routing is unchanged. This creates a difference‑in‑differences style comparison without claiming full experimental control.
The transport and HR teams should annotate a timeline of external events. They should mark festival periods, local disruptions, weather events, or policy changes like new hybrid‑work rules. Daily or weekly trend charts should be overlaid with these annotations so that visible jumps can be visually linked to either the routing change or to clearly independent shocks.
To reduce noise, the facility team should align EMS operational logs with HRMS data. They should segment outcomes by route and timeband. They should build route‑level views of on‑time pickup performance and journey duration before and after the change, then correlate these movement patterns with shift‑level late login patterns. They should not treat correlation as proof of causation but as operational evidence that better pooling or shorter detours coincide with fewer or shorter delays.
For internal credibility, the analysis should be framed as an operational impact assessment and not an academic causal study. The report should explicitly state that late login trends are “consistent with a positive effect” of route optimization, conditional on no other major changes in the comparison groups. The team should show absolute numbers and percentages, confidence intervals for key deltas where practical, and simple sensitivity checks such as excluding days with extreme disruptions.
Finally, the results should be converted into control‑room SOPs rather than a one‑time deck. The same pre/post structure can become a standard template for future changes. Transport heads can use it to run short A/B style pilots across select hubs, log every policy change, and repeatedly check whether late login trends follow the intended direction before scaling the change further.
How can we set up matched cohorts so we can compare outcomes for employees using corporate cabs vs not, without the analysis being biased?
B0132 Matched cohorts without biased conclusions — In Indian enterprise-managed employee transport (EMS), how do you build matched cohorts (e.g., similar employees, similar shifts, similar sites) to compare attendance and attrition outcomes between employees who use corporate cabs versus those who don’t, without creating biased or misleading conclusions?
In enterprise-managed employee transport in India, matched cohorts should be built by explicitly controlling for work, site, and schedule conditions before comparing attendance or attrition between cab users and non‑users. Organizations should first fix core comparability variables such as role, shift window, location, and manager, and only then define “treated” (cab) and “control” (non‑cab) groups to avoid biased conclusions.
A common failure mode is to compare all cab users to all non‑users without matching job family, tenure, shift pattern, and city. This pattern confounds the impact of EMS with differences in workforce mix, hybrid-work norms, and local labour markets. Most organizations benefit from creating narrow, like‑for‑like slices, for example “voice‑process employees in Mumbai, night shifts, same BU, similar tenure band,” and then checking cab vs non‑cab outcomes only inside each slice.
Risk of bias also increases when cab eligibility is policy‑driven. Senior or night‑shift employees are more likely to be EMS users than junior or day‑shift employees, so raw differences in attendance or attrition often reflect policy and career stage rather than transport itself. Matching on grade, function, contract type, and shift window reduces this selection bias.
Operational data should be joined carefully. HRMS and attendance systems define headcount, tenure, and absence patterns. EMS platforms define cab usage, route and OTP. Combining them with clear primary keys and time windows is critical, because mismatched or partial data can exaggerate the apparent impact of EMS on absence or exits.
Practical matching variables usually include: - Role, BU, and job family. - Grade or level and employment type. - Site or city and commute catchment. - Shift band (day/evening/night) and hybrid‑work pattern. - Tenure band and prior attendance history.
Even after matching, interpretation should remain cautious. Centralized command‑center quality, vendor mix, and route reliability differ across sites and time. Comparative analysis should therefore be run repeatedly across cohorts, time periods, and locations, and treated as evidence of directional impact rather than a final causal claim.
What HRMS, attendance, and access-control data do we need to join to link late arrivals to commute delays, and where do these joins usually fail in practice?
B0133 Data joins needed for attribution — For India-based Employee Mobility Services (EMS), what data joins are typically required between HRMS, attendance systems, and access control logs to attribute late arrivals to commute delays, and where do these joins commonly break in real operations?
For India-based Employee Mobility Services, reliable attribution of late arrivals to commute delays typically depends on joining four data streams at the individual-trip level. These streams are the transport roster and trip logs, the HRMS master data, the attendance or swipe data, and the site access control logs. Each stream must be consistently keyed and time-aligned to build a defensible narrative of “planned vs actual” arrival.
A stable join usually starts with HRMS as the master reference. HRMS provides the employee ID, shift pattern, cost center, and official shift start time. The transport routing or dispatch system then generates a trip manifest that maps each employee ID to a specific cab, route, and planned pickup and drop time. The attendance or time-tracking system records the “on-shift” timestamp, which may be a biometric swipe, login time, or attendance event associated with the same employee ID. Access control systems add the actual entry time into the facility, often using card-swipe or gate logs keyed by card ID that must be mapped back to the HRMS employee ID.
In practice, joins break most often at the identity and time-granularity layers. Identity breaks occur when HRMS employee IDs are not consistently used in transport manifests, attendance logs, or access control, or when contractors and temporary staff are managed in parallel systems without common keys. Time alignment failures arise when shift definitions, roster windows, and “acceptable arrival” thresholds differ between HR, transport, and security, making it hard to distinguish a genuine commute delay from a late departure or lenient grace period. Joins also fail when GPS trip data is incomplete, trip manifests are not frozen before dispatch, or when manual overrides and last-minute seat swaps are not captured in the system, which leaves no authoritative mapping between a given employee and a specific vehicle on that day.
Common operational weak points include inconsistent handling of exceptions such as no-shows and mid-route reassignments, fragmented data ownership between HR, Transport, and IT, and a lack of a governed semantic KPI layer that standardizes definitions like “on-time arrival” across systems. When these failure modes occur, leadership questions like “How many late logins were due to commute delays last month?” cannot be answered with audit-ready evidence.
If attendance improved but we also changed our hybrid/RTO policy, how should Finance interpret any ‘mobility impact’ claim?
B0134 Separating mobility impact from RTO — In India corporate shift transportation (EMS), how should a CFO interpret an ‘attendance improvement’ claim if the same period also had a hybrid policy shift (RTO increase/decrease) that changes baseline attendance behavior?
In India EMS, a CFO should treat “attendance improvement” claims during a hybrid/RTO policy shift as non-attributable to transport alone unless the vendor can isolate policy-driven effects and provide counterfactual evidence. The CFO should only credit a portion of the uplift to EMS when there is a clear, data-backed separation of what changed due to commute reliability versus what changed because more or fewer people were simply required on-site.
During an RTO increase, raw attendance will usually rise even if transport quality is unchanged. A CFO needs pre/post comparisons normalized for “expected to be in office” headcount, not just “actually came” counts. Similarly, when RTO relaxes, attendance may drop for reasons unrelated to EMS reliability, so stable or slightly improved “show-up vs scheduled” ratios may actually indicate a transport-driven gain hidden under a softer policy baseline.
A robust interpretation relies on transport-specific metrics that are adjacent to attendance but not policy-driven. Key examples include no‑show rate for scheduled trips, OTP% for first pickups and gate arrivals, trip fill ratio, and complaint/incident rates for commute. If those metrics improve while hybrid policy changes in either direction, the CFO can argue that EMS performance improved even if absolute attendance is noisy.
The CFO should also expect the vendor and HR/Transport team to present cohort-based views. This means comparing like-for-like groups, such as employees who remained shift-bound across the period, or specific sites that did not change RTO mandates. Without such stratification, any “attendance improvement” headline is essentially conflating policy, seasonality, and transport.
Practically, CFOs can ask three specific questions to de-risk interpretation:
- “Show me attendance as a percentage of employees rostered to be on-site, before and after the EMS change, by policy phase.”
- “Show me how OTP%, no‑show rate, and commute complaints moved over the same phases.”
- “Which sit es or teams had stable RTO policy, and what was the attendance delta there?”
If the only visible change is in raw attendance while EMS reliability and commute experience indices are flat, the uplift should be attributed primarily to hybrid policy, not to EMS. If EMS KPIs improve in parallel, the CFO can reasonably attribute a share of the attendance gain to commute reliability, but should still avoid over-claiming causality without stratified and time-phased evidence.
Ultimately, in EMS procurement and governance, “attendance improvement” is best treated as a joint HR–Transport outcome. For financial defensibility, CFOs should lean on transport-native KPIs, normalized attendance ratios, and audit-ready time-series rather than single top-line percentages when RTO policies are in flux.
When we claim mobility improves retention, what usually messes up the analysis (wage changes, manager churn, ramp-downs), and how do we control for it without a huge data science effort?
B0135 Controlling confounders in retention claims — In Indian enterprise EMS, what confounders most often invalidate causality claims about mobility improving retention (e.g., wage changes, manager churn, project ramp-downs), and how should an HR analytics team control for them without a full-scale data science program?
In Indian enterprise employee mobility services, most causality claims that “better commute improved retention” are invalidated because other strong drivers of attrition move at the same time as transport changes. HR analytics teams need to treat mobility as one of several parallel interventions, and control for obvious confounders using simple, auditable methods rather than complex models.
Key confounders typically include wage and benefit changes, manager or leadership churn, project ramp‑up or ramp‑down, policy shifts around hybrid work, and major safety or reputation incidents. Each of these factors can change attendance, morale, and exit decisions independently of the commute experience, so any “post‑go‑live retention bump” is ambiguous if these are not controlled.
A practical HR analytics approach is to build a small, stable indicator set around each obvious confounder and to apply basic comparison logic. HR teams can tag cohorts by project, manager, wage band, and work pattern, then compare retention deltas between groups that received the mobility change versus similar groups that did not. They can run pre/post windows that explicitly exclude periods with known shocks, such as large increments or re‑orgs, and they can track commute‑linked metrics like on‑time arrival, no‑show rate, and complaint volumes alongside attrition rather than only looking at headcount churn.
Simple techniques like difference‑in‑difference on Excel, careful cohorting, and explicit “event calendars” for major HR and business changes are usually sufficient to avoid the most common errors. HR should insist on traceable data from mobility platforms, including trip adherence, safety incidents, and complaint closure SLAs, and then anchor any retention narrative to both operational improvement (OTP, safety, experience) and controlled comparisons across similar employee groups.
How do we put a real cost number on poor OTP—escalations, supervisor time, shift disruption—so it doesn’t get dismissed as just HR complaints?
B0136 Costing the hidden operational drag — In India corporate employee transport (EMS), how do you quantify the operational cost of poor on-time performance—like supervisor time, escalations, and shift disruption—so Operations and Finance don’t dismiss it as ‘soft’ HR noise?
In Indian corporate employee transport, the cost of poor on-time performance becomes “hard” when it is translated into time, headcount, and unit economics at trip and shift level. Operations and Finance stop seeing it as “soft HR noise” when OTP failures are tied to CET (Cost per Employee Trip), CET-per-no-show, and measurable productivity loss per delayed shift.
A practical approach is to build a simple cost model around a single missed or late trip. Each late pickup is first mapped to concrete effects such as delayed logins, rework in rostering, re-dispatch of cabs, and additional supervisor handling time. These effects are then monetized using standard internal rates like average fully-loaded salary cost per hour, average billing or productivity value per hour for the function, and any overtime or make-up trip costs.
The cost model gains credibility when it aligns to existing EMS KPIs and commercial constructs. For example, OTP% can be correlated with Trip Adherence Rate, exception detection-to-closure time, and no-show rate. This allows teams to compute an “OTP failure cost per 1,000 trips,” which includes direct transport wastage (duplicate trips, dead mileage) and indirect costs (supervisor hours, escalations, complaint handling).
To move from anecdotes to accepted numbers, organizations usually define a fixed set of parameters for every exception log. Typical parameters include impact on shift adherence, incremental cab or reroute usage, supervisor and helpdesk time spent, and whether senior leadership or HR was involved in escalation. Over a month, this data feeds into a consolidated view of “OTP-linked overhead,” which can be expressed as a percentage of total EMS spend.
Once this envelope is visible, it can be folded back into procurement and vendor governance. Outcome-based contracts can then explicitly link payouts and penalties to OTP, exception-closure SLA, and no-show rate. Finance teams are more likely to accept the model when it is grounded in existing EMS metrics, supported by trip logs from the command center, and periodically reconciled to invoice data.
images:
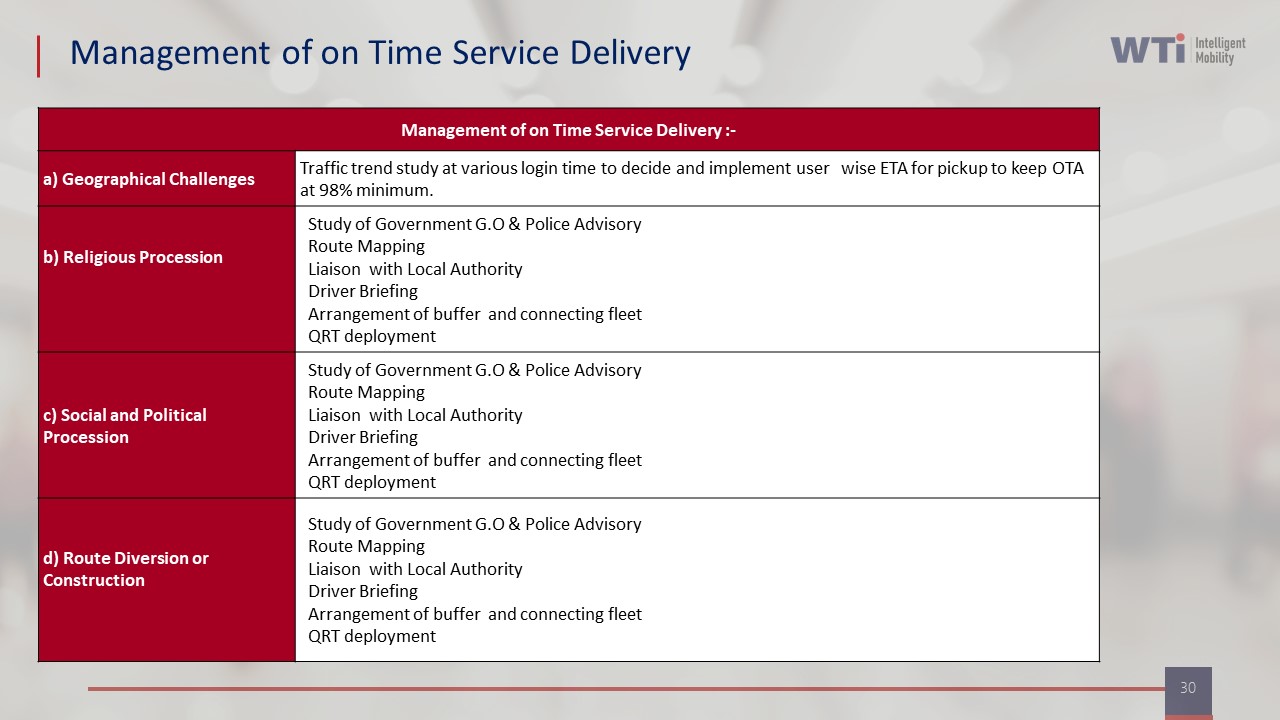
If we changed shift start times or added pickup points, how can we still measure the impact of commute interventions on shift adherence in a defensible way?
B0137 Attribution amid shift schedule changes — In India-based Employee Mobility Services (EMS), what is a defensible way to attribute changes in shift adherence to commute interventions when the organization simultaneously changed shift start times or added new pickup points?
In India-based Employee Mobility Services, the only defensible way to attribute changes in shift adherence to commute interventions is to isolate commute-controlled variables in the data model and treat shift-policy changes (new start times, new pickup points) as explicit covariates, then compare like-for-like cohorts and time windows rather than topline averages. Any approach that blends pre/post data without normalizing for new shift windows or catchment areas will overstate the impact of transport changes and fail audit scrutiny.
Most organizations need to rebuild their analysis around trip- and employee-level records with clear tags. Shift adherence should be measured as a per-employee, per-shift outcome linked to the underlying route, vehicle, and policy context, not as a single global “OTP” or “on-time login” number. New shift start times, additional pickup points, or changed route geometries should be encoded as discrete attributes in the dataset so that analysts can segment and control for them when calculating adherence deltas.
A defensible pattern is to define stable comparison groups. Transport teams can compare employees on unchanged shifts and unchanged pickup clusters before and after a specific commute intervention to estimate its pure operational effect, while treating employees affected by shift-time or network redesign as a separate cohort. For the redesigned cohort, organizations can evaluate whether, after adjusting for the new shift window, the distribution of arrival lead/lag improved relative to distance bands or traffic patterns typically seen in that city.
Successful EMS programs typically rely on a centralized command center and a mobility data lake to preserve trip logs, route plans, and roster data with audit trails. When incident reviews or ESG-linked reporting bring scrutiny, the ability to show adherence changes normalized for new shift windows, route layouts, and service catalogs is what differentiates credible, outcome-linked procurement from optimistic narratives about “improved punctuality.”
operational guardrails & incident playbooks
Document exact steps for critical failures (driver no-show, GPS/app outage, vendor delays), plus defined fallback routes and recovery procedures to keep operations in control.
What’s a ‘good enough’ standard that HR and Internal Audit can agree on for causality in board-level reporting, so it holds up later?
B0138 Audit-aligned causality standard — For Indian enterprises running EMS, how can HR and Internal Audit agree on a ‘good enough’ causality standard for board-level reporting on attendance and retention impact, so the analysis doesn’t collapse under scrutiny later?
For Indian enterprises running Employee Mobility Services, HR and Internal Audit usually achieve a “good enough” causality standard when commute–attendance–retention links are based on a consistent hypothesis, cleanly defined data cuts, and repeatable rules rather than one‑off narratives. A workable standard relies on directional, multi-period evidence with disclosed assumptions, not on claiming perfect scientific proof.
A stable causality narrative starts with an explicit logic chain that both HR and Audit endorse. HR can define the commuting hypotheses in plain language. HR might state that chronic late pickups and safety concerns increase no-shows, late logins, and eventually attrition in night-shift and women employees. Internal Audit’s role is to insist that each step in this chain is testable using EMS data, HRMS attendance records, and retention outcomes.
Internal Audit will usually accept HR’s impact story when the underlying EMS data is structured, reconciled, and scoped clearly. Trip and OTP data from the mobility platform should be aligned with HRMS shift rosters and attendance, with exclusions documented for partial data or pilot sites. The joint standard improves when both teams agree on time windows, site selections, and persona cohorts before any analysis starts.
The board-level narrative becomes defensible when HR and Audit jointly define “good enough” statistical signals. These signals often include pre/post comparisons around EMS changes, consistent patterns across multiple months, and stronger effects in segments most exposed to commute risk, such as night shifts. Internal Audit does not need laboratory-grade causality if the analysis is transparent, replicable, and honest about its limits.
A resilient approach usually includes three practical safeguards. First, HR and Audit should publish a short methods note with every board update that lists data sources, matching logic, and exclusion rules. Second, both should pre-agree thresholds for “meaningful” effects, such as minimum deltas in late login rates or attrition for EMS-exposed groups. Third, they should distinguish between hard facts, such as OTP trends, and interpreted links, such as commute-driven attrition, so that scrutiny later does not undermine the overall credibility of the ESG and employee-experience story.
When a vendor claims ‘AI routing improves attendance,’ what should Procurement ask to confirm it’s repeatable and measurable, not just a one-off case study?
B0139 Testing vendor causality claims — In India corporate mobility programs (EMS/CRD) where vendors pitch ‘AI routing improves attendance,’ what questions should Procurement ask to test whether the vendor can demonstrate repeatable, measurable causal impact rather than a one-off case study?
Procurement teams should force vendors to connect “AI routing” to hard baselines, live controls, and audit-ready evidence. The core test is whether the vendor can show stable, repeatable improvements in OTP, seat-fill, and cost per trip that reconcile back to Finance and HR data, not just a single success story.
Procurement should first anchor on measurement discipline. Vendors should be asked how they define and calculate On-Time Performance, Trip Adherence Rate, Trip Fill Ratio, Cost per Employee Trip, and no‑show rate. Vendors should explain what baselines they use, which period they compare against, and how they separate AI routing gains from other changes such as fleet additions, policy tweaks, or shift rationalization. A common failure mode is “before/after” slides that do not control for volumes, city mix, or hybrid-work patterns.
Commercial and governance questions should test for causality and repeatability. Vendors should be asked if they are willing to index part of their payouts to OTP and CET targets. Vendors should also specify how often they run route adherence audits and how exception-detection and closure times are tracked in the command center. Outcome-based contracts help expose whether the routing engine is robust across monsoon, elections, and night shifts, or only in ideal conditions.
Data and integration questions should validate traceability rather than dashboards alone. Procurement should ask how the routing engine consumes HRMS rosters and attendance data, and how trip logs reconcile with billing and Finance systems. Vendors should also describe how they expose raw trip and telematics data, what audit trails exist for route changes, and how they handle fragmented supply or app downtime. A vendor who cannot give Procurement verifiable data flows, schema clarity, and audit hooks is unlikely to offer truly repeatable, measurable impact.
If attendance and access-control logs don’t match because of biometric issues or overrides, how do we still do attribution and give leadership a single reliable answer?
B0140 Dealing with conflicting source systems — In India EMS operations, how do you handle attribution when employee attendance records and access control logs disagree (e.g., biometric failure, tailgating, manual overrides), but leadership still wants a single answer on commute impact?
In India EMS operations, most mature organizations treat commute impact attribution as a governed, evidence-based process instead of a single “system-of-truth” toggle between HRMS and access control. Operations teams reconcile multiple logs under clear rules of precedence, classify each case, and then surface one auditable attribution outcome for leadership.
A common failure mode is trying to force either attendance systems or access control to be the only truth source. This fails when there are biometric failures, tailgating, manual overrides, or app downtime. The more reliable approach is to define a standard playbook where trip telemetry, command center records, roster data, and access logs are compared and then resolved into a small set of commute‑impact categories.
Most EMS buyers already link payments and vendor performance to outcomes like on-time performance, trip adherence and exception closure time. In this environment, commute attribution is treated like any other SLA decision. Transport teams rely on real-time tracking, command center observability, and incident tickets as primary evidence. Attendance and access logs become corroborative inputs rather than sole determinants.
For leadership reporting, organizations compress this complexity into three or four clear buckets. Typical examples are: “Delay clearly caused by commute,” “Delay clearly employee‑driven,” “Shared/indeterminate cause,” and “Non‑commute operational issue.” Each bucket is backed by traceable data from the mobility platform and command center, so the Facility or Transport Head can answer the question “Was this a transport failure?” with a defensible yes/no plus a category.
This approach improves trust with HR and Finance. HR gains confidence that commute‑related attendance volatility is quantified and not mixed with access‑control anomalies. Finance can safely use the categorized data in outcome‑linked contracts and penalty models, because each disputed case is grounded in trip logs, driver and rider app data, and command center records instead of unverified manual overrides.
For women’s night shifts, how do we show safety outcomes improved due to our policy changes, without the program feeling like surveillance to employees?
B0141 Safety attribution without surveillance backlash — In India shift-based Employee Mobility Services (EMS), what is a realistic way to attribute improvements in women’s night-shift safety outcomes (incidents, escalations, SOS response) to policy changes, without creating ‘Big Brother’ backlash from employees?
In India shift-based Employee Mobility Services, the safest way to attribute better women’s night‑shift safety outcomes to policy changes is to treat every trip as an auditable “event” with minimal personal data, then compare pre‑ and post‑policy patterns on those events rather than on individual women. The organization should link changes in escort rules, routing, driver compliance, and SOS workflows to shifts in clearly defined metrics such as incident rate, escalation closure time, and route deviations, while keeping monitoring focused on trips and vendors instead of employees.
A practical pattern is to use the existing command‑center stack as the measurement engine, not a new “surveillance” layer. Organizations can log geo‑fenced route adherence, panic/SOS triggers, escort allocation, and driver credential currency through systems similar to the Alert Supervision System and centralized compliance dashboards described in the collateral. Outcome metrics can include women‑only or women‑first trip cohorts, but analysis should aggregate them by route, timeband, vendor, and driver pool, rather than by named employees, which lowers perception of personal tracking.
A common failure mode is mixing safety analytics with HR performance management. This creates “Big Brother” anxiety and leads to under‑reporting of near misses and reluctance to use SOS features. A better approach is to publish a narrow, explicit charter for safety data use that excludes individual productivity evaluation and focuses on route risk scoring, driver training needs, and vendor governance.
To make attribution credible, transport and security teams can run stepped changes and A/B comparisons. For example, they can introduce women‑centric safety protocols, escort rules, or revised routing on selected night‑shift clusters and then compare on‑time performance, SOS response times, and incident logs against untreated clusters over the same period. Case studies in the collateral that show 98% on‑time performance and improved satisfaction after safety changes illustrate how such before/after comparisons can be structured without exposing personal data.
For employee trust, organizations should over‑communicate SOPs, not algorithms. Women employees need to see that GPS tracking, SOS controls, and command‑center monitoring exist to protect them, as in the women‑centric safety protocols and SOS control panel solutions, and that there are clear deletion policies and access limits on trip data. In practice, most organizations have found that when employees understand that logs are used to enforce chauffeur screening, vehicle compliance, and real‑time response—not to watch their every move—adoption of safety tools rises and “Big Brother” resistance falls.
images:
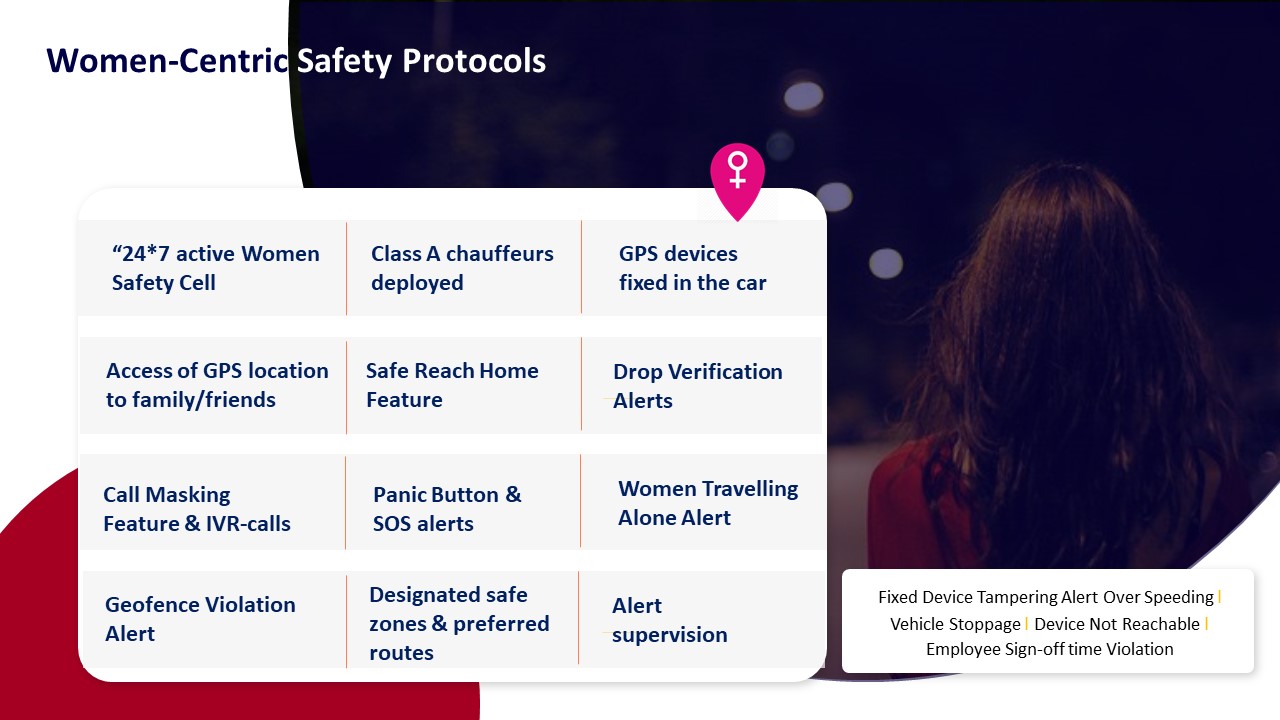
After a major incident, how can HR explain what caused what to the CEO when the data isn’t perfect and everyone wants answers immediately?
B0142 Causality narrative under incident pressure — In Indian corporate employee transport (EMS), how can a CHRO explain causality to the CEO after a high-visibility incident—when the data is incomplete, confounders are obvious, and everyone wants a clear narrative fast?
In Indian corporate employee transport, a CHRO should frame causality to the CEO as “governed probabilities backed by evidence,” not as a single perfect cause, especially when data is incomplete and confounders are visible. The CHRO’s job is to separate what is known, what is uncertain, and what will change in the operating model so leadership can act without waiting months for a forensic answer.
A clear explanation usually has four layers that are each explicitly separated.
First, the CHRO should define the incident in operational terms instead of emotion-led stories. The description should reference shift, route, escort or women-safety provisions, vendor type, and timeband. This aligns the discussion with EMS concepts like SLA breaches, route adherence, and night-shift safety norms.
Second, the CHRO should present what the current data can support. This includes trip logs, GPS traces, driver credentials, roster snapshots, and command-center alerts if those exist. The CHRO should be explicit about gaps in telemetry and audit trails, because incomplete evidence is itself a governance finding in EMS.
Third, the CHRO should distinguish between direct causal factors and systemic contributors. Direct factors are specific failures like a missed escort rule, an unvetted driver, or a routing override. Systemic contributors include fragmented vendor management, manual rostering, weak geofencing, or lack of a centralized command center, which the industry brief identifies as common EMS pain points.
Fourth, the CHRO should move quickly to controlled corrective actions. These can cover safety SOP tightening, vendor governance changes, shift-window routing rules, and accelerated deployment of command-center monitoring and SOS controls. Each action should be linked to a measurable EMS KPI such as OTP%, incident rate, or audit-trail completeness, instead of generic “training” promises.
- The CHRO should clearly say which conclusions are high-confidence, which are provisional, and what new data collection will close the gaps.
- The incident narrative should be tied to existing EMS risks like fragmented supply, manual controls, or missing real-time observability, rather than presented as a freak event.
- The CHRO should commit to a time-bound follow-up report that uses better trip-level and safety telemetry to refine the causal picture.
This approach gives the CEO a defensible story that is honest about uncertainty but firm on governance failures, aligns with how EMS risk is understood in India, and creates a bridge from one incident to structural improvements in safety, command-center operations, and vendor control.
How do we set up attribution so we can generate audit-ready proof quickly—assumptions, cohorts, time windows—when auditors ask on short notice?
B0143 Panic-button audit-ready attribution — In India-based EMS, how should a mobility team design an attribution approach that can produce ‘panic button’ audit-ready outputs (assumptions, cohorts, time windows) when auditors ask for proof of attendance or compliance impact on short notice?
An effective attribution approach for India-based Employee Mobility Services should pre-define what “proof” means, and continuously generate a small, fixed set of linked, time-bounded evidence packs that can be exported on demand. The mobility team should treat attendance, safety, and compliance attribution as a standing data product, not an ad-hoc analysis.
The foundation is a governed schema that links trip lifecycle data, HRMS attendance, and compliance/status logs using stable keys. Each trip record should carry employee ID, shift code, route ID, vehicle and driver IDs, plus timestamps for booking, dispatch, pickup, drop, and any exception events. HRMS should supply a daily attendance and shift-allocation snapshot for the same employees and time windows. Compliance systems should provide credential-validity flags and audit-log timestamps.
The mobility team should define a small library of standard cohorts and time windows upfront. Typical cohorts include by site, business unit, shift band, gender, and vendor. Typical windows include daily, weekly, month-end, and special-event ranges. Each cohort–window pair should have a canned “evidence view” that computes On-Time Performance, Trip Adherence, seat-fill, incident count, and a simple attendance-alignment index.
To be “panic button” ready, the command center should maintain pre-aggregated, immutable audit views with clear assumptions. Each view should explicitly state matching rules, such as allowed time skew between drop time and HRMS login, and how no-shows or cancellations are treated. These assumptions must be versioned, so that any later re-run can reproduce the same answer.
When auditors ask for proof, the team should be able to pull a parameterized evidence pack rather than build a new model. A typical pack should contain a summary table of KPIs for the requested cohort and window, a line-level extract of trips and attendance matches with reasons for any mismatches, and a compliance appendix listing driver and vehicle credential status with validity dates.
When HR says mobility improved retention and Finance disputes it, what usually goes wrong politically, and how do we pre-agree on attribution rules to avoid a credibility fight?
B0144 Avoiding HR–Finance attribution fights — In India corporate Employee Mobility Services (EMS), what are the most common political failure modes when HR claims mobility improved retention but Finance challenges the math, and how can leaders pre-agree on attribution rules to avoid a credibility fight?
In Indian corporate Employee Mobility Services, the most common political failure mode is HR making broad retention claims based on commute improvements while Finance sees no clean, auditable link between EMS data, attendance, and actual attrition metrics. This gap creates a credibility conflict where HR appears anecdotal and Finance appears obstructive, even when both are reacting to the same noisy, fragmented data.
The conflict usually starts when HR attributes lower attrition or better attendance to a new EMS program without defining baselines, cohorts, or control periods. Finance then finds that mobility costs, trip volumes, and headcount have all changed simultaneously, so any retention “impact” looks like correlation without causation. A second failure mode arises when EMS data, HRMS data, and payroll or exit data are not synchronized, so simple leadership questions like “for which roles and sites did commute changes affect resignation rates?” cannot be answered cleanly. A third pattern appears when ESG or employee-experience narratives are pushed without unit-economics context, which triggers Finance skepticism about “soft benefits” that are not reconciled to cost per employee trip or cost per kilometer.
Leaders can avoid these credibility fights by pre-agreeing on explicit attribution rules before EMS changes go live. The rules should define which HR outcomes can be linked to mobility, which cannot, and what evidence is required for each. The rules should also specify the shared data model, including which fields must align between EMS platforms, HRMS, and Finance systems to support any attribution claims.
Practical guardrails that leadership teams can codify up front include:
- Define specific KPIs that are legitimately “commute-sensitive,” such as late logins, no-show rates, commute-related grievances, and night-shift resignation rates, instead of broad overall attrition.
- Agree cohort-based baselines, for example by role, site, and shift band, over a fixed lookback window before EMS changes are introduced, so that any improvement is measured against a known starting point.
- Set simple experimental designs where possible, such as piloting improved EMS in selected sites or shifts first and comparing commute-sensitive KPIs with similar control groups that do not receive the change during the same period.
- Standardize how Finance and HR will convert operational changes into economic terms, for example by linking improved on-time performance and reduced absenteeism to cost per employee trip, overtime, and replacement hiring costs.
- Agree documentation expectations in advance, including periodic joint HR–Finance reviews of EMS data, HRMS attendance, and attrition, with clear rules on how long a trend must persist before it can be cited as an outcome.
When HR, Finance, and Transport teams jointly define these attribution rules, HR gains a defensible narrative, Finance gains traceable numbers, and EMS initiatives are evaluated on pre-agreed evidence rather than post-hoc persuasion.
How can we measure whether commute improvements reduced manager complaints and escalations, especially if escalation logs aren’t consistent?
B0145 Measuring reductions in escalations — In Indian enterprise shift transport (EMS), how do you measure whether commute improvements reduced manager complaints and operational escalations, and what proxy signals are credible when escalation logging is inconsistent?
In Indian enterprise shift transport, organizations measure whether commute improvements reduce manager complaints and operational escalations by tying transport metrics to HR and operations KPIs rather than relying only on raw complaint counts. When escalation logging is inconsistent, credible proxy signals come from patterns in attendance, on-time performance, app usage, and ticket-closure behavior that reflect whether managers are still firefighting or have returned to “business as usual.”
Organizations that treat EMS as a governed service measure reduction in noise at the “shop-floor” level. They correlate transport reliability with fewer late logins, lower no-show rates, and more stable shift adherence. Facility and transport heads track whether night-shift disruptions, driver shortages, and routing changes still translate into last-minute manual interventions. A common failure mode is staring at an underused escalation log and assuming problems are solved, even when managers are still resolving issues via calls and informal channels.
A more reliable approach is to monitor operational and HR-linked proxy indicators that move only when complaints genuinely reduce. These proxies are most useful when they are observed together rather than in isolation.
Key proxy signals include: - Improvement in on-time performance and trip adherence rates during peak or night shifts. - Reduction in exception-to-closure time for SOS alerts, routing changes, or no-show replacements. - Stabilization of attendance and fewer “transport-related” late login patterns within shift windows. - Fewer ad-hoc manual trip requests compared to scheduled, app-based bookings. - Increase in use of standard digital workflows versus off-system calls to command centers. - Higher employee satisfaction scores specific to commute questions in pulse surveys. - Flatter escalation patterns in centralized command-center dashboards, even during events like weather disruptions.
These signals allow facility and transport heads to demonstrate that EMS improvements are reducing operational noise, even when traditional escalation logs do not fully capture incident volume.
If we use location tracking and trip logs to prove impact, what DPDP/privacy red flags should Legal and IT call out so we don’t face a ‘surveillance’ allegation later?
B0146 DPDP risks in causality analytics — In India corporate mobility programs (EMS), when a vendor proposes to use location tracking and trip logs to prove causality, what privacy and DPDP Act concerns should Legal and IT flag to prevent a future ‘surveillance’ allegation?
In India EMS programs, Legal and IT should flag any location-tracking design that goes beyond what is necessary for safety, routing, and audit, or that lacks explicit employee understanding and control, because such designs are what later get labelled as “surveillance” under the DPDP Act and in employee forums. Legal and IT need to ensure that every element of trip logging, geo-fencing, and telematics is tied to a clear lawful purpose, minimal data capture, limited retention, and transparent governance, not open-ended monitoring.
Legal should scrutinize the claimed purposes for location tracking and trip logs. Legal should require that each purpose be specific and granular, such as safety compliance, route adherence, incident reconstruction, or SLA verification, rather than vague labels like “productivity monitoring” or “behavioural analytics.” Legal should insist that any new analytic use, such as driver scoring or geo-AI risk scoring, be separately assessed and not treated as an implied extension of the original consent. Legal should check that DPDP-compliant notices explain what will be collected, when, how long it will be kept, and who can see it.
IT should examine the technical architecture for unnecessary continuous tracking. IT should differentiate between shift-window trip telemetry needed for EMS command-center operations and always-on background tracking that might continue outside duty windows. IT should push for designs where location capture is bounded by rostered trip lifecycle events and where off-shift tracking is technically prevented, not just contractually “forbidden.” IT should verify that role-based access, audit logs, and retention policies are implemented in the platform so that historic location data cannot be mined informally over long periods.
Both functions should stress data minimization and retention control. They should ensure that only data elements required for OTP, route adherence audits, incident response SOPs, and billing are stored in the trip ledger. They should challenge the storage of raw high-frequency coordinates if aggregated or event-level logs are enough to prove causality. They should define strict retention periods for detailed GPS traces and require automatic deletion or irreversible aggregation, keeping only what is necessary for auditability and legal defence.
They should also address context-specific sensitivity, especially for women’s night-shift routing. Legal should ask how escort compliance, geo-fencing, and panic/SOS APIs will be demonstrated without enabling continuous behavioural tracking of individual women employees. IT should check that dashboards used by command centers, security, and HR operations expose only operationally relevant views, not employee-level movement histories that managers could repurpose for performance or attendance policing outside formal HRMS workflows.
Finally, Legal and IT should jointly test for repurposing risk and vendor lock-in. They should ensure contracts and APIs maintain data ownership with the enterprise and restrict vendors from using employee location data for unrelated analytics or commercialisation. They should require clear offboarding and deletion procedures so that historic trip data does not remain in multiple unaudited copies. These controls reduce both DPDP exposure and the perception, internally and externally, that the mobility system is a covert surveillance layer rather than a governed safety and reliability tool.
How do we do reliable causality analysis when data is messy—missing punches, manual roster changes, and mismatched employee IDs across systems?
B0147 Causality under messy data conditions — In India-based Employee Mobility Services (EMS), how do you design a causality approach that still works when data quality is messy—missing attendance punches, manual roster changes, and inconsistent employee IDs across HRMS and transport systems?
In India-based Employee Mobility Services, causality models remain usable under messy data when organizations treat “data hygiene” as a controlled variable, not a precondition, and design the logic to tolerate gaps through redundancy, explicit rule hierarchies, and audit-focused reconciliation. Causal inference should lean on stable operational controls such as trip logs, GPS traces, and shift windows, then progressively reconcile back to noisy HRMS signals like attendance punches and employee IDs.
A practical pattern is to anchor causality on the most reliable transport-side events. Trip start–end timestamps, route manifests, and GPS-derived on-time performance usually have higher integrity than attendance swipes. These signals can define primary cause–effect chains, such as how roster adherence drives OTP and how OTP influences shift adherence, even while attendance and ID fields are partially missing.
When employee IDs are inconsistent across HRMS and transport systems, an explicit identity-resolution layer is required. This layer can use composite keys such as mobile number, email domain, home-location cluster, and usual shift band to map multiple IDs to a single operational persona. The mapping rules should be versioned and auditable so that Finance, HR, and Audit can see how individuals were linked at any point in time.
Messy manual roster changes should be treated as first-class events in the causality design, not as noise to be ignored. Each change request, approval, or override can be logged as a distinct step in the trip lifecycle. The causal model can then attribute specific delays or no-shows to late roster changes, capacity constraints, or routing decisions, based on which event occurred last in the chain before a miss.
To keep causality robust, organizations can define a small, fixed set of precedence rules. For example, if GPS and driver app status disagree on whether a pickup occurred, the system can always trust the signal with higher historic accuracy for that corridor. If HRMS attendance and trip logs conflict on presence, investigations can prioritize trip evidence while flagging the case for HR validation.
A staged approach helps when data quality is highly variable across sites. Organizations can start by building site-level models that only use consistently available fields such as OTP%, Trip Fill Ratio, and dead mileage. Over time, as identity resolution and HRMS integration improve, the same models can be extended with attendance deltas, attrition flags, or commute experience indices, without discarding earlier baselines.
Transport heads and facility managers benefit when the causality design feeds directly into command center operations. Early-warning rules can fire when repeated manual roster changes, unusual GPS gaps, or rising exception closure times predict future OTP dips. This shifts operations from reactive firefighting toward predictable exception management, even if underlying HRMS data remains imperfect.
For Finance and Procurement, the same causal layer can support outcome-linked contracts without demanding perfect data. Payments can be indexed to trip-level SLAs like OTP and route adherence, which are observable from transport systems, while more complex metrics that require clean employee IDs can be used only for analysis and not for billing.
Safety and ESG teams also gain from this approach. Incident causality can rely on chain-of-custody trip logs, geo-fencing events, and SOS activations, which are less dependent on clean HRMS data. Emission-intensity estimates can be tied to route and vehicle telemetry, then reconciled with headcount only where identity resolution is strong enough to withstand audit scrutiny.
In practice, most organizations succeed when they explicitly document three elements. They define which signals are considered “source of truth” for each causal question. They maintain a catalog of known data gaps and workarounds by site or vendor. They ensure that every causal metric in dashboards or reports includes a data-quality confidence score, so leadership understands where decisions are robust and where they are indicative only.
For retention/attrition impact, what’s the minimum time window we should look at, and how do we stop leadership from drawing conclusions from just one month?
B0148 Minimum window for retention attribution — In India corporate EMS, what minimum time window is typically needed to claim that a commute intervention affected attrition or retention, and how do you avoid executives pushing for conclusions from a single month of data?
In India corporate employee mobility, most organizations need at least 3–6 months of stable EMS operations before linking a commute intervention credibly to attrition or retention. One month of data is useful for service stabilization and OTP tuning, but it is not sufficient to attribute changes in exit rates or engagement to transport changes alone.
A 3–6 month window captures repeated shift cycles, seasonal disruptions such as monsoon traffic, and bedding-in of new routing, apps, and driver behavior. This period is also when command-center processes, safety protocols, and business continuity playbooks become consistent enough that commute reliability is a real employee “constant” rather than a moving target. Attrition and retention decisions are influenced over multiple pay cycles and review discussions, so they lag behind operational changes such as improved OTP, better night-shift safety, or EV deployment.
To avoid executives drawing conclusions from a single month, transport teams typically separate “stabilization metrics” from “people metrics.” In month 1–2, they report hard operational indicators like OTP, incident rate, complaint closures, and app adoption. Only after 3–6 months do they start correlating commute data with HR indicators such as attendance stability, no-show reduction, and survey-based commute satisfaction. Framing EMS dashboards this way helps leadership see that immediate gains belong in the operational reliability domain, while retention impact requires a longer, trend-based review rather than one-month spikes or dips.
How can Ops prove that fewer delays and route deviations actually reduced overtime or backfill costs, and not just shifted costs somewhere else?
B0149 Linking delays to overtime costs — In India shift-based employee transport (EMS), how can Operations prove that fewer route deviations and delays actually reduced overtime or backfill staffing costs, instead of those costs shifting elsewhere in the system?
In India shift-based employee transport, Operations can prove that fewer route deviations and delays truly reduced overtime or backfill costs by tightly linking trip adherence data to HRMS time-stamps, roster plans, and payroll outcomes over a defined baseline vs post-improvement period. The proof comes from comparing planned vs actual shift start–end times, headcount on floor, and overtime payouts, while holding roster size and production targets constant so savings cannot be “explained away” as a shift elsewhere.
Operations teams need a governed data spine that joins EMS trip logs, GPS route adherence, and OTP% with HRMS attendance and payroll. Trip-level adherence and OTP from the command centre must be mapped to each employee’s actual login time and to process-level staffing requirements. If planned headcount and production volumes are unchanged, but late-logins, understaffed intervals, and overtime payouts drop in parallel with improved OTP and lower deviation counts, the causality is strong and auditable.
A common failure mode is only showing better OTP% without reconciling it to finance systems. That creates suspicion that costs simply moved into buffers, idle time, or vendor minimum guarantees. Operations should instead agree in advance with HR and Finance on a small KPI set such as OTP%, Trip Adherence Rate, late-login count, overtime hours, and Cost per Employee Trip. These metrics should be tracked in an integrated dashboard, with six-to-twelve-week before/after comparisons and no material changes to roster policy, vendor mix, or production targets in that window.
To avoid claims of cost shifting, Operations should explicitly document any parallel changes such as fleet mix, seat-fill, or dead mileage caps and quantify their effects separately. Centralized billing, standardized commercial models, and auditable trip ledgers make it easier for Finance to confirm that reduced overtime is not offset by hidden charges, utilization losses, or emergency deployments elsewhere in the ecosystem.
If we improve our NOC escalation process and SLA governance, how do we isolate its impact on attendance and shift adherence versus vendor staffing or traffic changes?
B0150 Isolating NOC process impact — In India corporate Employee Mobility Services (EMS), what’s the best way to isolate the impact of a new NOC escalation process or tighter SLA governance on attendance and shift adherence, versus improvements coming from better vendor staffing or traffic changes?
In India EMS programs, the impact of a new NOC escalation process or tighter SLA governance is best isolated by treating it as a controlled operational experiment with clean baselines, sharply defined KPIs, and explicit separation of “governance levers” from “capacity levers” such as vendor staffing or fleet size. The key is to change governance rules in a limited, well‑instrumented slice of operations while keeping supply, routing, and demand assumptions as constant as possible, then compare against a matched control.
A common failure mode is to roll out new escalation matrices, command-center playbooks, and vendor staffing changes together. This makes it impossible to attribute attendance or shift-adherence gains to the NOC process itself. Most organizations also lack pre-implementation baselines for OTP, Trip Adherence Rate, and No-Show Rate broken down by site, timeband, and vendor, which prevents credible before/after analysis.
A more reliable approach is to define a test cell and a control cell mapped to similar shift patterns, geographies, and vendor mixes. The test cell receives the new NOC escalation SOPs, tighter SLA tracking, and incident-closure rules, while vendor staffing levels, routing logic, and fleet mix remain unchanged for an initial observation window. Attendance, OTP%, Trip Adherence Rate, and exception-closure latency are then tracked at a per-shift and per-route level, using the same HRMS and transport data feeds across both cells.
Operations leaders should explicitly log any concurrent changes that would confound results, such as driver additions, major route redesigns, or structural traffic disruptions. These changes can then be excluded from the analysis window or flagged in the KPI timeline. This allows attendance stability and shift adherence to be correlated with governance changes rather than with added capacity or exogenous factors like festivals or monsoon extremes.
Useful practical signals include: a reduction in exception-closure time without a corresponding increase in active vehicles, an improvement in OTP% and Trip Adherence Rate on unchanged routes, and fewer HR or floor-level escalations despite flat vendor headcount. When these operational shifts precede any later changes in fleet or staffing, they provide stronger evidence that the NOC and SLA governance mechanisms are driving the improvement, rather than expanded supply or temporary traffic relief.
How do we avoid cherry-picking the best sites to ‘prove’ commute impact, and what controls keep our reporting honest?
B0151 Preventing cherry-picked impact claims — In Indian enterprises using EMS, how do you prevent ‘selective storytelling’ where HR highlights only the best-performing sites to prove commute impact, and what governance controls help keep causality reporting honest?
In Indian enterprises using Employee Mobility Services, selective storytelling reduces when commute impact is reported on a standardized, system-driven basis instead of being manually curated by HR. Causality stays honest when KPIs, data sources, and governance rights are defined upfront across HR, Transport, Finance, ESG, and IT, and when the command center, not a single function, owns the primary evidence trail.
A strong EMS platform already captures granular data such as OTP%, fleet uptime, incident logs, and employee satisfaction scores across all locations. When these metrics are surfaced through a centralized, single-window dashboard with uniform definitions and automated reports, it becomes harder for any one function to present only high-performing sites. Real-time dashboards used in command centers and transport control rooms, combined with tech-based measurable and auditable performance frameworks, make “cherry-picking” visible because outliers and gaps are exposed alongside success stories.
Governance improves further when there is a formal operating model that separates data generation, analysis, and narrative. Transport and the command center own trip logs and alerts. Finance validates cost and utilization. ESG and Sustainability leads check CO₂ and EV metrics against defined calculation logic. HR interprets impact on attendance, attrition, and satisfaction but does not control the raw data or filters. Periodic audits, indicative management reports, and account management frameworks add an external check by comparing reported outcomes with SLA performance, compliance dashboards, and business continuity metrics.
Organizations can codify this into SOPs by:
- Defining a fixed KPI catalog for EMS (OTP, incident rate, CET, EV utilization, CEI) with standard formulas and system-of-record ownership.
- Publishing cross-site scorecards automatically from the mobility platform, with no manual exclusion of low-performing branches.
- Linking QBRs and governance committees to full-network views, not hand-picked case studies.
- Requiring that any claimed causal link (e.g., “commute improved retention”) be backed by joint HR–Transport–Finance data cuts over the same period and population.
These controls preserve HR’s ability to tell compelling stories but anchor them in auditable, enterprise-wide evidence rather than isolated best sites.
How can we check that an attribution approach won’t add extra work for the ops team—like more tagging, reason codes, or exception categorization?
B0152 Avoiding ops burden from analytics — In India corporate shift transport (EMS), what should a Transport/Facilities head ask to validate that a proposed attribution model won’t increase cognitive load on the operations team with extra tagging, manual reason codes, or exception categorization?
A Transport or Facilities head should probe whether the attribution model is driven by data the system already has, or whether it depends on new manual inputs that will slow dispatch and shift control-room work.
They should ask very specifically how delay reasons, exceptions, and SLA breaches will be captured and categorized without extra effort by supervisors, routers, or drivers. They should insist that most attribution be derived automatically from GPS traces, trip timelines, HRMS rosters, and existing event logs from the NOC or command center. They should also ask whether the model can run in the background and generate dashboards without adding new mandatory forms, free-text fields, or multi-step reason-code selection screens in driver, dispatcher, or admin apps.
Key questions to reduce cognitive load include: - “Which attribution fields come from telemetry and system logs, and which require a human to choose a code or enter text?” - “Can the routing and command-center tools infer 80–90% of causes from timestamps, geo-fencing, and trip states, so my team only validates edge cases?” - “Will driver and admin apps stay usable during peak and night shifts, or are you adding new mandatory screens or reason codes to close trips and exceptions?” - “How are exception categories and OTP/OTA breach reasons configured and updated, and who owns that maintenance in practice?” - “Can we see a live flow for a delayed trip: exactly what an agent or driver has to click, and how long it takes, when your model attributes the cause?” - “If GPS or app connectivity fails, what is the minimal manual backup process, and how many additional steps are added for my team to keep attribution usable?” - “How will the model surface attribution in dashboards for HR and Finance without my team having to ‘clean up’ or re-tag data at the end of every shift?”
If we switch vendors and there’s short-term disruption, what’s a fair way to compare before/after attendance and shift adherence without blaming the wrong thing?
B0153 Causality during vendor transition — In India corporate Employee Mobility Services (EMS), what is a fair way to compare attendance and shift adherence before and after a vendor changeover when the transition itself causes short-term disruption and learning effects?
A fair comparison of attendance and shift adherence around an EMS vendor change in India must isolate the “transition shock” period, normalize for roster and policy changes, and use like‑for‑like cohorts and time windows. Organizations should avoid judging the new vendor on the first few turbulent weeks and instead compare stabilized periods with matched conditions and clearly defined KPIs.
A common failure mode is to treat the immediate post‑go‑live weeks as representative performance. Transition inherently creates disruption due to new apps, changed routing, driver familiarization, and command center learning curves. Most organizations therefore treat an initial “stabilization window” as a separate phase and exclude it from strict before/after comparisons. This helps facility and transport heads avoid being unfairly blamed for predictable early variance and keeps leadership expectations realistic.
A more robust approach is to define a baseline period with the old vendor, then compare it to a matched period once the new operating model, routing engine, and command-center processes have settled. Comparison should control for confounders such as shift mix, hybrid work patterns, and policy changes that influence attendance beyond transport. It is also important to separate reliability metrics like on‑time performance and trip adherence from people outcomes such as attendance, no‑show rate, and HR‑tracked attrition to avoid misattributing effects.
In practice, transport leaders can frame an internal SOP that specifies transition phases, frozen KPIs, and review cadences. This SOP can link EMS operations, centralized command center data, and HRMS attendance logs into a single view. A clear review structure with defined escalation rules, business continuity playbooks, and indicative transition plans helps ensure that post‑transition performance assessments are grounded in stable data rather than in short‑term turbulence.
If IT won’t share HRMS data widely, what data minimization or anonymization options still let us do credible causality analysis on retention?
B0154 Causality with minimized HR data — In India enterprise-managed EMS, when HR wants to prove commute impact on retention but IT is reluctant to share HRMS data widely, what data minimization or anonymization approaches still allow credible causality analysis?
In India enterprise-managed employee mobility, HR teams can still test commute–retention links credibly by using privacy-preserving joins, aggregation, and controlled pseudonymization instead of sharing raw HRMS data widely. The core idea is to move from person-identifiable views to policy-safe, cohort-level analytics with clear role-based access and audit trails.
HR and IT can agree a minimal shared schema that excludes names, contact details, and exact addresses. The shared schema can use stable but non-identifying keys, basic demographics (e.g., band, function, gender), and high-level location tags. The employee mobility platform can then ingest only this reduced dataset via an API-first connector, aligned to DPDP’s data minimization expectations. A data protection impact assessment can document lawful purpose, retention, and access roles.
Causality analysis can rely on pseudo-anonymous keys and time-bound joins. A salted employee ID can enable linking trip history, OTP%, safety incidents, and no-show rates to tenure and attrition flags. Analysts can test relationships between commute reliability and exits while never exposing identity in their working tables. IT can keep the mapping between salted and real IDs inside HRMS, not in the mobility platform.
Most modelling can be done on cohorts rather than individuals. Teams can group employees by site, shift band, gender, transport policy, or route type, and then compare attrition and attendance deltas across cohorts with different OTP, seat-fill, or safety profiles. This satisfies HR’s need for proof and ESG-style credibility while aligning with role-based access, auditability, and mobility data lake governance.
images:
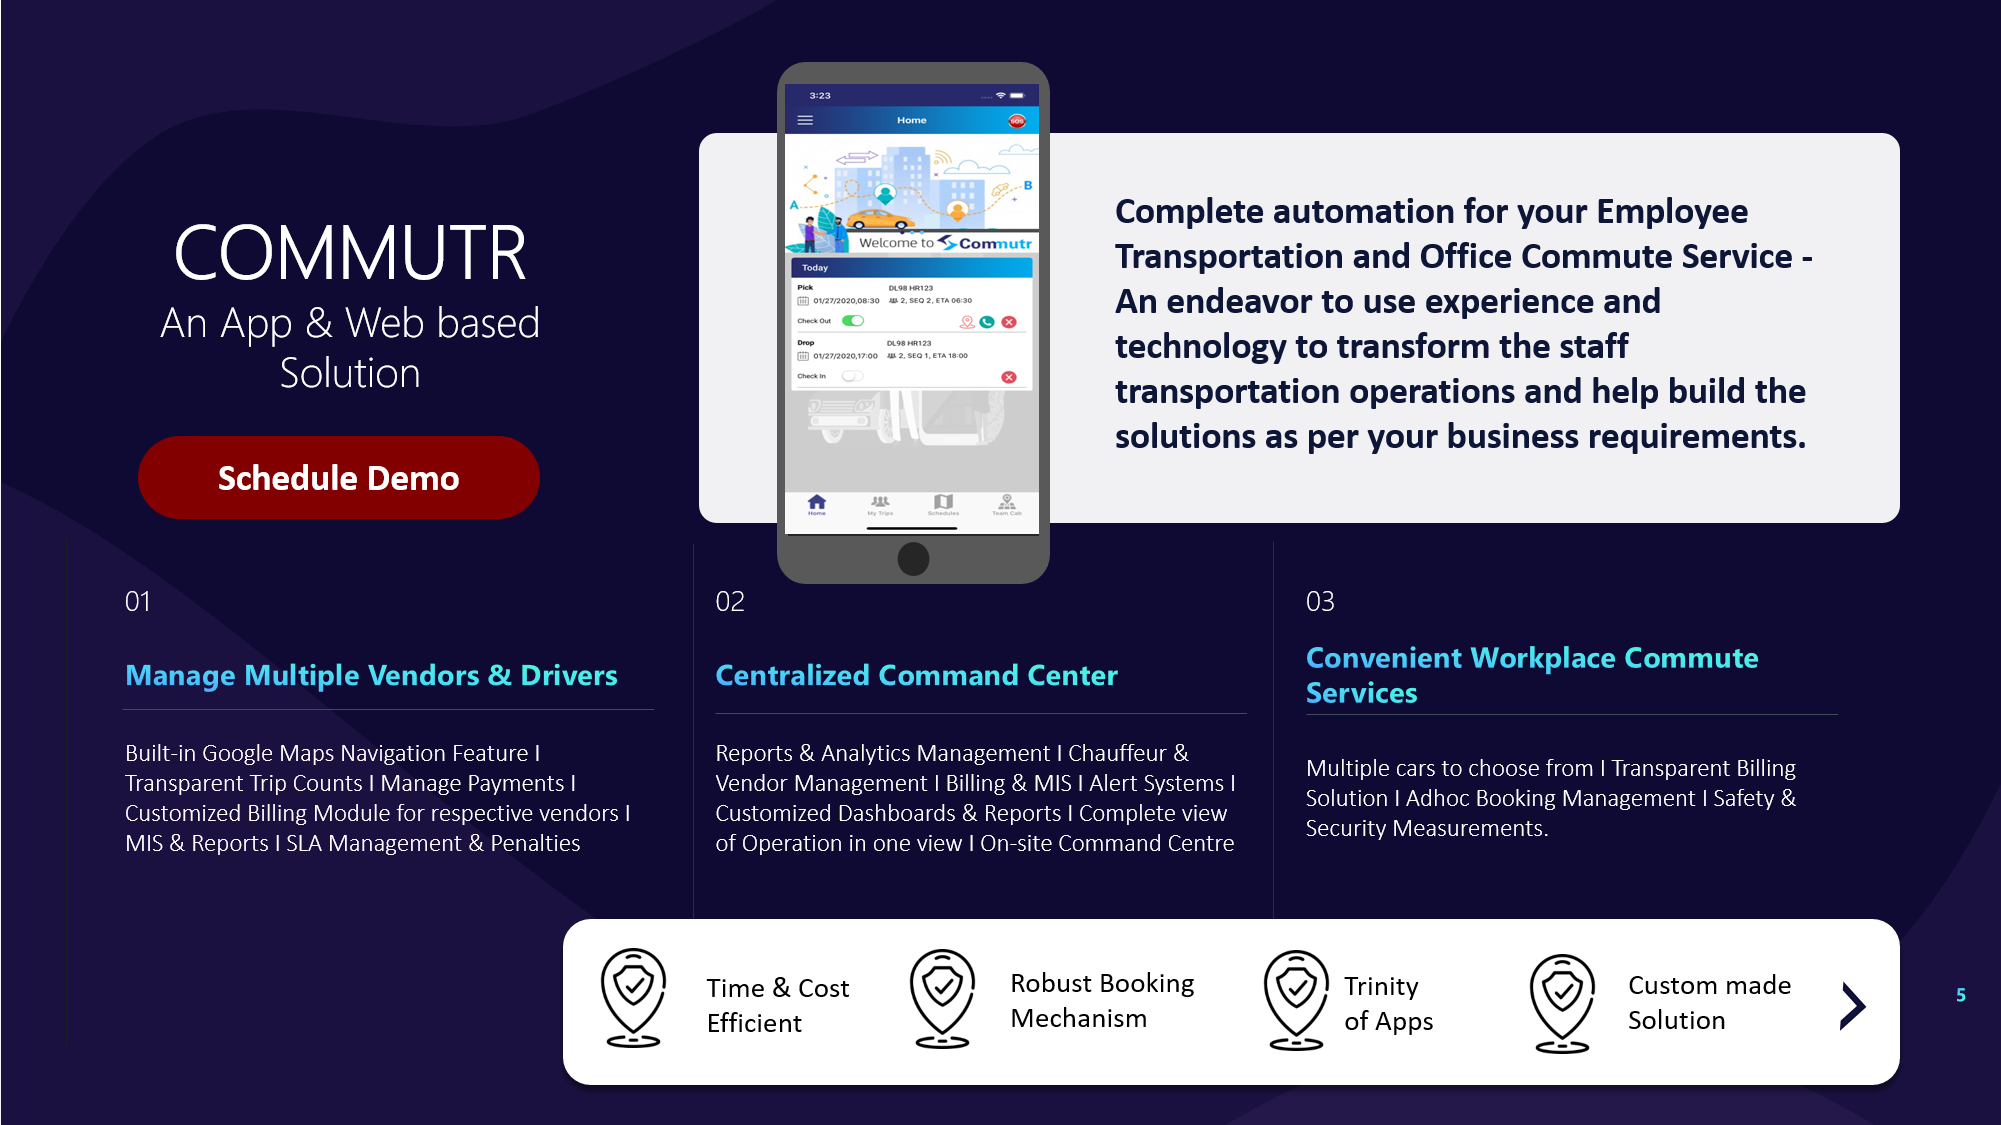
What leading indicators can we track now (like NPS or grievance closure) that predict retention improvement later, and how do we avoid confusing correlation with causation?
B0155 Leading indicators vs true causality — In Indian corporate employee transport (EMS), what are credible leading indicators that a commute intervention will improve retention later (e.g., NPS, grievance closure), and how do you avoid mistaking correlation for causation?
In Indian corporate employee transport, the strongest leading indicators for retention are those that link commute reliability and safety directly to day‑to‑day employee friction and to how fast issues are resolved. Metrics such as commute NPS or a Commute Experience Index, on‑time performance (OTP%), grievance closure SLA adherence, no‑show and cancellation patterns, and safety incident rates are credible early signals that an EMS intervention is likely to improve retention later, provided they are tracked in a way that can be tied back to HR outcomes like attendance, shift adherence, and exit reasons.
Reliable leading indicators usually sit in four clusters. Operational stability indicators like OTP%, Trip Adherence Rate, exception detection‑to‑closure time, and dead mileage influence whether employees reach work smoothly and on time. Safety and compliance indicators like incident rate, credentialing currency, women‑safety protocol adherence, and SOS/escalation performance affect whether employees and HR trust the commute system. Experience indicators such as commute NPS, complaint volume per 1,000 trips, grievance closure SLA performance, and adoption of employee apps or booking features reflect whether the service is “invisible” and hassle‑free. Policy and usage indicators like trip fill ratio, hybrid‑work attendance patterns by route, and mobility entitlements by persona show whether the service design matches real demand instead of forcing workarounds.
Avoiding correlation–causation mistakes requires treating EMS data and HR data as a single system. Organizations need to integrate trip and telemetry data with HRMS attendance, performance, and attrition records, then evaluate changes using before‑after baselines and consistent control groups across comparable sites, shifts, or business units. A common failure mode is to implement multiple changes at once (for example, new routing plus a policy change plus an incentive) and then attribute all positive retention movement to transport, when the underlying driver might be workload, compensation, or manager behavior. A disciplined approach uses outcome‑linked procurement and governance, where commute interventions are tested in defined pilots, with clear hypotheses, a limited set of changed variables, and pre‑agreed KPIs for OTP, safety, and complaint closure, and only then scaled once repeated measurement shows that improved EMS indicators precede and align with better attendance and lower transport‑tagged attrition.
images:
escalation, vendor coordination & response timing
Isolate NOC improvements from routing, tie SLAs to observable outcomes, and establish escalation paths and log custody to support audits.
If our analysis shows better attendance but transport costs didn’t drop, how should Finance talk about ROI when leadership wants one ‘savings’ number?
B0156 ROI framing when costs don’t drop — In India-based Employee Mobility Services (EMS), how should Finance structure ROI conversations if the attribution model shows improvements in attendance but not necessarily reductions in transport cost per trip, and leadership still expects a single ‘savings’ number?
Finance should frame ROI for Employee Mobility Services in India as a combined “cost of transport + cost of attendance volatility” equation, and then convert improved attendance, lower attrition, and fewer escalations into a rupee-equivalent that can sit alongside traditional per-trip transport cost. Finance should avoid forcing all value into cost-per-trip reduction and instead present a primary unit-cost view plus a secondary “protected value” view that links mobility reliability to workforce stability and ESG commitments.
Finance teams in EMS often find that optimized routing, safety protocols, and command-center monitoring stabilize operations without obviously lowering cost per trip. In that situation, the most robust approach is to hold CPK/CET baselines constant and show how improved OTP, reduced no-shows, and fewer incident-related disruptions translate into fewer lost productive hours, fewer replacement shifts, and lower HR firefighting. This aligns with how Employee Mobility Services are actually valued by HR and Operations, where reliability, safety, and auditability drive behavior more than pure rupee-per-kilometer.
A practical structure is to keep three layers very distinct. The first layer focuses on “hard” mobility economics such as cost per employee trip, dead mileage, and route utilization, with clear baselines for pre- and post-EMS platformization and vendor governance. The second layer quantifies people outcomes as financial proxies using metrics like attendance stability, overtime avoided, and attrition reduction attributable to commute reliability. The third layer isolates risk and ESG impact by assigning a conservative financial proxy to avoided safety incidents, avoided reputational events, and measured carbon reductions if EV fleets are in scope.
To reconcile this with leadership’s desire for a single “savings” number, Finance can define a board-facing figure that includes only high-confidence, auditable components. This can combine verified reductions in leakage and dead mileage with a discounted portion of attendance-linked value, while keeping more speculative or long-horizon ESG benefits out of the core number and instead called out as “upside”. A common failure mode is padding the single savings number with unproven assumptions about productivity or carbon pricing, which undermines credibility in front of auditors and the board.
When presenting this, Finance should keep attribution logic transparent. This includes clearly stating how attendance changes were measured, how much of that shift is conservatively assigned to EMS reliability, and how that converts to avoided cost in overtime, backfills, or lost production. It is important to show traceability from EMS data (OTP%, Trip Fill Ratio, no-show rate) into HR metrics (attendance volatility, attrition) and then into Finance numbers. This avoids the perception of “soft” ROI and supports audit-ready narratives.
Downstream, this structure lets Procurement and HR negotiate outcome-linked contracts that are not limited to per-kilometer rate reductions. Payouts and incentives can be indexed to on-time performance, safety incident rates, and Trip Adherence Rate, with Finance using those same KPIs in the ROI model. That alignment reduces disputes over invoices and creates a closed loop between the EMS command center metrics, vendor governance, and the blended savings number leadership asks for.
What are red flags that an attribution dashboard is ‘too clean’—hiding missing data or excluding bad trips—so HR doesn’t get embarrassed in a leadership review?
B0157 Red flags in overly clean dashboards — In India corporate EMS, what are the warning signs that an attribution dashboard is ‘too clean’—masking missing data, excluding bad trips, or quietly redefining metrics—so a CHRO doesn’t get embarrassed in a leadership review?
In India corporate EMS, a commute attribution dashboard is usually “too clean” when it shows near-perfect results without exposing data gaps, exception volume, or methodology choices in a way an HR leader can defend. A CHRO should mistrust any dashboard that reports high OTP or safety performance but gives little visibility into no-shows, app failures, manual overrides, or how missing trips are treated in the metrics.
One warning sign is when On-Time Performance, Trip Adherence Rate, and complaint rates look flat and near-perfect across all sites and timebands. Real EMS operations see OTP swings by shift window, day of week, and weather or traffic conditions. Another red flag is when night-shift and women-safety routes show identical performance to daytime routes without separate cut views for escort compliance, SOS usage, or geo-fence violations.
A second pattern is when the attribution layer only shows app-recorded or GPS-perfect trips and silently drops trips with GPS loss, manual dispatch, or roster changes. This often hides dead mileage, driver shortages, and routing workarounds that Transport Heads deal with each night. A third signal is when definitions like “trip completed,” “on time,” or “incident-free” are not pinned down in writing or cannot be explained in one page that Finance, Security, and IT can all agree on.
To avoid embarrassment in leadership reviews, CHROs should insist on seeing:
- side-by-side metrics for total rostered trips versus trips counted in KPIs
- exception buckets for missing data, GPS failure, and manual trips
- segmented OTP and incident views for night shifts, key campuses, and women-only routes
- a simple, documented metric dictionary aligned with HRMS, Finance, and command center logs
Late logins are rising—how do we tell if it’s commute delays or gate/access-control bottlenecks using attendance and access logs?
B0158 Diagnosing late logins root cause — In Indian enterprise shift transportation (EMS), how can an HR operations analyst diagnose whether rising late logins are driven by commute delays versus access control bottlenecks at the gate, using attendance and access logs responsibly?
In Indian enterprise shift transportation, an HR operations analyst can separate commute-driven delays from gate/access-driven delays by comparing three timestamps for the same employee and shift: planned shift start time, actual gate entry time from access logs, and first system login time from attendance/HRMS. Consistent patterns where gate entry is close to shift start but logins are late point to access or workstation bottlenecks, while late gate entry aligned with rostered pickup time and route patterns usually indicates commute issues.
An effective diagnosis depends on clean, joined data from the HRMS roster, EMS trip data, and access control logs. In most EMS environments, attendance and shift rosters already sit in HRMS, while access systems and transport platforms create their own logs. A common failure mode is looking only at login or attendance data without correlating it with gate entry, which leads to subjective blame on transport or security. Another failure mode is ignoring night-shift and women-safety routing rules, where mandated detours and escort policies can legitimately extend travel time.
A practical approach is to define a simple, repeatable analysis SOP with clear responsibility boundaries. The analyst can routinely run checks such as “gate entry vs rostered shift” and “login vs gate entry” by site and timeband, then review outliers with the facility / transport head and security / access teams. Over time, these comparisons can show structural issues like inadequate gate staffing at specific peaks, suboptimal routing for particular clusters, or repeated late departure from certain routes, enabling targeted interventions without breaching data privacy or diluting safety compliance.
- Ensure data minimization and purpose limitation when using access and EMS logs, keeping analysis scoped to punctuality and not general surveillance.
- Use aggregated patterns by route, gate, and timeband as the primary decision input, and only drill to individual cases for dispute resolution or safety review.
- Align the SOP with existing EMS governance, including command center operations, incident response, and outcome-linked SLAs, so that transport vendors and access control teams see a predictable, data-backed process rather than ad-hoc blame.
If each site has different vendors and conditions, how do we attribute attendance/shift adherence changes to a central mobility policy without blaming the wrong site teams?
B0159 Attribution across heterogeneous sites — In India corporate EMS, when different sites have different local vendors and operating conditions, how do you attribute changes in attendance and shift adherence to a central mobility policy change without penalizing or rewarding the wrong site teams?
In India corporate EMS, organizations attribute changes in attendance and shift adherence to central mobility policy changes by standardizing metrics and baselines centrally, and then normalizing local results for vendor mix, route risk, and demand patterns before comparing sites. This reduces the risk of rewarding or penalizing a site team for factors driven by vendor capability, traffic, or workforce mix rather than by how well they executed the policy.
A common pattern is to define a central KPI library that links mobility to HR outcomes. Typical pairs are On-Time Performance (OTP%) and Trip Adherence Rate (TAR) against attendance stability and no-show rates. Organizations then lock baselines per site for a pre-change window. The mobility policy change is introduced with the same SLA definitions, roster rules, escort and women-safety protocols, and command-center escalation logic across all sites. This creates a comparable “before/after” view for each location, even if each uses a different vendor.
The central command center and data lake play a critical role. Telematics and trip logs are aggregated to a governed semantic layer, where OTP%, TAR, Trip Fill Ratio, and Cost per Employee Trip are computed using identical logic. Site scores are then adjusted for known structural differences such as shift windowing, peak-load intensity, hybrid-work attendance volatility, and EV vs ICE fleet mix. This allows central teams to separate three signals: the pure impact of the policy design, the quality of vendor execution, and the quality of local transport-team execution.
To avoid misattribution, most organizations add three guardrails:
- Use trend deltas within each site, not raw cross-site rankings, as the primary basis for reward or intervention.
- Cross-check EMS metrics with HRMS attendance data and security-access logs so that reported OTP or TAR changes are reconciled to actual logins and shift adherence.
- Run structured route adherence audits and exception RCA from the centralized NOC to detect when apparent “policy impact” is actually driven by local vendor failures, driver fatigue, or routing gaps.
This approach ties incentives and corrective actions to the controllable levers of each site team, while treating vendor capability and structural city constraints as separate governance dimensions rather than reasons for blame.
For our shift commute program, how do we prove OTP improvements really drove better attendance and shift adherence, and not just seasonality or RTO changes?
B0160 Proving OTP drives attendance — In India-based Employee Mobility Services (EMS) for shift commutes, how can HR and Operations credibly isolate whether on-time pickup improvements actually caused better attendance and shift adherence, rather than being explained by seasonality, traffic patterns, or a recent RTO policy change?
In India-based Employee Mobility Services, HR and Operations can credibly isolate the impact of on-time pickup improvements by treating OTP changes as a structured “intervention” and comparing outcomes against clean baselines, controls, and confounder data over time. The core principle is to link OTP shifts to attendance and shift adherence through segmented, time-bound analysis rather than simple before–after comparisons.
HR and Operations teams should first lock a pre-intervention baseline for OTP%, attendance, and late-logins across comparable weeks and shift bands. They should then introduce specific OTP-focused changes, such as routing tweaks, capacity buffers, or driver rostering changes, and measure post-intervention deltas by route, timeband, and site. This isolates the period and geography where OTP was intentionally improved.
To avoid misattributing results to seasonality, traffic, or RTO changes, teams need explicit confounder tracking. This includes tagging weeks with public holidays, monsoon peaks, election days, or major RTO/policy changes, and comparing them against similar periods in previous years or against sites where neither OTP interventions nor policy changes occurred. Seasonality and traffic patterns become explanatory dimensions in the analysis, not noise that is ignored.
A credible causal narrative also relies on cross-system evidence. Transport data (OTP%, Trip Adherence Rate, exception closure time) should be reconciled with HRMS attendance logs and shift-adherence metrics at employee-group level, using the same date and shift keys. If OTP improvement precedes and co-moves with better attendance for the same cohorts and shifts, while unchanged routes or sites do not show similar gains, the causal story strengthens.
Operations can further tighten attribution by using quasi-experimental designs. For example, route-level A/B where some corridors get dynamic routing and capacity buffers while others continue under legacy routing within the same city and season. If improved corridors show higher on-time performance and materially better attendance or lower no-show rates than unchanged corridors over the same weeks, it becomes harder to argue that external factors alone explain the uplift.
Common failure modes arise when HR and Operations rely on broad, aggregate month-on-month comparisons with no control group, no tagging of external events, and no alignment between transport logs and HRMS data. Another failure mode is changing multiple variables at once—such as OTP interventions, RTO policy changes, and shift policies—without documenting which changes applied where and when, making post-hoc attribution impossible.
A practical, low-noise approach for HR and Operations is to define a small, clearly scoped pilot cluster of routes and shifts for OTP improvement, maintain a comparable cluster without intervention, and insist on weekly, route-level dashboards that include OTP%, late-arrival rate, no-show rate, and tagged external events. Over 6–8 weeks, consistent divergence between intervention and control clusters, aligned with the intervention timeline, provides defensible evidence that OTP improvements are driving better attendance and shift adherence rather than being artefacts of external conditions.
What kind of simple pre/post setup will Finance accept to link commute changes to fewer late logins, without getting stuck on holidays or site ramp-ups?
B0161 Finance-acceptable pre/post setup — In India corporate ground transportation for Employee Mobility Services (EMS), what are the most practical pre/post analysis setups that a Finance Controller will accept to link commute program changes to measurable reductions in late logins without arguing about confounders like site ramp-ups, shift re-banding, or holidays?
A Finance Controller usually accepts pre/post analysis of EMS changes when the setup isolates comparable employee–shift cohorts, fixes the measurement window, and normalizes for planned structural changes such as ramp-ups or holiday calendars. The analysis is most trusted when it uses HRMS time-stamp data as the system of record and ties any OTP or routing improvements directly to the frequency and duration of late logins per shift.
The most practical pattern is to define a stable “like-for-like” cohort and lock it upfront. This cohort is a list of employees, sites, and shift windows that exist in both periods, with no major role or location changes. Finance teams prefer a simple rule such as “only employees who worked at least N night shifts in both baseline and post periods” because it limits debate about workforce churn.
Controllers typically want three guardrails on the time window. The first is a clean baseline of 8–12 weeks before the EMS change with the same holiday calendar as the 8–12 week post window. The second is explicit exclusion of ramp-up or ramp-down weeks flagged by HR or Projects. The third is a freeze on mid-stream policy changes such as new grace periods or re-banded shifts so that attendance rules do not move during measurement.
Finance tends to insist that the primary KPI comes from attendance or HRMS logs, not from the transport vendor. This is usually the count and percentage of late logins beyond the allowed grace period, linked to specific shift codes and locations. Transport data such as OTP% and Trip Adherence Rate is then used only as explanatory evidence, not as the core proof of business impact.
Controllers accept simple, additive normalization for known confounders rather than complex statistical models. For example, they are comfortable if the analysis shows late-login rate per 1,000 eligible shifts, and then breaks out separate series for ramped teams or new sites. They also respond well to pre-agreed exclusion rules such as “ignore first two weeks of a new process go-live” if these are documented in advance.
The most operationally feasible design is a small set of standard reports that join HRMS and EMS data on employee ID, date, and shift. One report shows daily late-login counts by site and shift window for baseline vs post. A second shows OTP% and exception closure time over the same dates. A third provides a drill-down of “transport-attributed delays” where HR, Transport, and Security jointly tag incidents as commute-related in a ticketing or incident log.
Finance Controllers are more willing to accept causality when the change being tested is discrete and time-bounded. Examples include a specific routing-optimization rollout, a switch to centralized dispatch, or an EV/ICE fleet-mix adjustment on a particular corridor. In these cases, they look for step-change patterns in late-login KPIs starting from the rollout week while other policies and rosters remain constant.
Most Controllers prefer a conservative attribution rule that avoids over-claiming impact. A common approach is to only count variance that coincides with both improved OTP and reduced commute-related incident tags. They may, for instance, attribute “up to X%” of the late-login reduction to EMS changes while leaving the rest unexplained or linked to HR policy measures such as stricter grace windows or manager enforcement.
In practice, the setups that survive scrutiny are those encoded as repeatable SOPs rather than one-off analyses. A standing “mobility impact pack” that runs quarterly and always uses the same cohort logic, windows, and exclusion rules gives Finance confidence that trends are real and not engineered. This also allows them to benchmark new EMS interventions against older ones using consistent metrics.
How do we create matched cohorts for routes/shifts to estimate mobility impact without leadership feeling we cherry-picked the data?
B0162 Matched cohorts without cherry-picking — In India EMS shift transportation, how do People Analytics teams build matched cohorts (e.g., similar employees, similar shifts, similar pickup zones) to estimate the causal impact of route changes on attendance, while avoiding accusations of cherry-picking from business leaders?
People Analytics teams in India EMS shift transportation usually build matched cohorts by pre-defining objective matching rules on shift, role, location, and baseline behavior, then applying them consistently before looking at impact metrics. They treat route changes as a “treatment,” match each treated employee to comparable “control” employees not exposed to the change, and lock these rules in advance to avoid any perception of cherry‑picking.
They first define the unit of analysis explicitly. Many teams choose “employee×month” or “employee×roster cycle” as the unit. They then specify treatment as employees whose pickup/drop pattern changed due to a routing change in the EMS system. Non-treated employees in the same time window form the initial comparison pool. This structure connects clearly to EMS realities such as shift windowing, route optimization, and command center operations.
They next design matching variables from existing EMS and HRMS data. Typical dimensions include shift band, process or department, base location or pickup zone, historical attendance or no-show rates, and tenure. Teams often use pre-change windows to calculate baseline attendance and lateness, which reflect commute stability before any routing intervention. They may also control, at a minimum, for gender and night-shift status where women-safety routing and escort policies apply.
To build matched cohorts, teams apply explicit, documented matching rules. Common approaches include exact matching on critical fields such as shift band and base location, and nearest-neighbor matching on continuous variables like baseline attendance rate. Where route-level data is available from the EMS routing engine or NOC dashboards, they may also approximate distance or travel time bands to ensure that treated and control employees previously experienced similar commute burden. Teams typically freeze these rules in a short evaluation protocol that is agreed with HR, Transport, and Finance before analysis begins.
Avoiding accusations of cherry-picking depends heavily on governance rather than just technique. Successful People Analytics teams publish a short, plain-language design note that states the time window, inclusion criteria, variables used for matching, and pre-decided outcome metrics such as attendance stability, late login frequency, and no-show rate. They also specify, in advance, how they will handle edge cases like employees changing shifts or moving locations mid-period. This mirrors the “Assurance by Design” thinking used in EMS governance, where rules and evidence are defined before outcomes are known.
They then run simple balance checks to demonstrate that treated and control cohorts look similar on key baselines. For example, they can show that pre-change attendance rates and tenure distributions match closely across groups. Many teams share these balance tables with HR and Transport Heads, turning them into a joint validation artifact rather than an internal technical step. This reduces suspicion that controls were selected only because they showed a desired effect.
When presenting impact estimates, teams usually report both simple before–after trends and matched-cohort estimates. They may also show sensitivity ranges, for example, re-running the match with slightly different windows or variable weights. Consistency of direction and magnitude across variants reassures CFOs and Procurement that the result is not an artifact of a single modeling choice. They clearly separate descriptive findings from causal interpretations, using language like “employees on the new routes improved attendance by X percentage points relative to matched peers” rather than stronger causal claims without caveats.
Clear communication is critical when talking to skeptical business leaders. People Analytics leads often frame the logic in operational terms: “We compared employees on the new routes to colleagues on similar shifts, in the same zones, with similar past attendance, over the same period.” They avoid technical jargon and relate the design back to everyday EMS constraints like hybrid-work elasticity, seat-fill optimization, and peak-load routing. They also emphasize that the same framework can be reused to test other interventions, such as introducing EV-led routes or changing pickup cutoffs, building trust that the method is a standing governance tool, not a one-off justification.
Finally, teams document every step and store the cohort definitions, scripts, and reports in an auditable repository. This aligns with the broader EMS expectations around audit trails, compliance, and data observability. If leadership or audit functions revisit the analysis months later, the organization can reproduce the matched cohorts and results exactly. This reproducibility, combined with pre-agreed rules and transparent balance checks, is what most effectively counters accusations of cherry-picking when estimating the impact of route changes on attendance.
If we want to link absenteeism changes to commute reliability, which data sources do we need to join (roster, attendance, access logs, trip logs), and what join issues usually break the analysis?
B0163 Data joins that survive audit — For India-based corporate employee transport (EMS) integrated with HRMS and attendance, what data joins are typically required to attribute changes in absenteeism to commute reliability—HRMS roster, attendance punches, access control swipes, and trip logs—and which join failures usually invalidate the analysis in an audit review?
For India-based corporate employee transport, attributing absenteeism changes to commute reliability requires clean joins between HRMS rosters, attendance/access events, and trip logs at an individual-trip level. The core requirement is a traceable chain that links a named employee’s scheduled shift, actual presence (or absence), and the exact transport events and exceptions for that shift.
The analysis typically depends on four joins.
- HRMS roster to transport roster. The employee ID and shift date-time must match to the roster used by the EMS routing engine. Any mismatch in IDs, shift windows, or cancelled/changed shifts breaks downstream attribution.
- HRMS roster to attendance punches or access control swipes. The same employee ID and shift date-time band must map to in-time and out-time, respecting grace windows and policy rules.
- Transport roster to trip logs. Each rostered pickup/drop must be linked to a specific trip ID, vehicle ID, and driver ID, with route adherence and OTP recorded.
- Trip logs to access control swipes or attendance punches. The trip completion time and location must align to entry swipes or punch times to prove that a delayed or missed cab led to late login or absence.
In audit reviews, several join failures usually invalidate the analysis.
- Inconsistent or recycled employee IDs across HRMS, EMS platform, and access control, which prevents a unique person-level chain-of-custody.
- Unaligned time references, such as different time zones, unsynchronized clocks, or missing grace rules, which makes OTP vs login-time comparisons unreliable.
- Missing or partial trip logs for no-shows, diverted routes, manual trips, or fallback vendors, which creates selection bias in the dataset.
- Rosters not updated for leave, WFH, or shift swaps, so “absenteeism” includes employees who were not supposed to travel.
- Inadequate handling of multi-modal or manual last-mile legs, where the EMS trip ends before the access gate, creating unexplained gaps.
- Lack of immutable audit trails for data corrections, which undermines trust in any reconstructed mapping.
In practice, any break in the person-level, time-aligned chain across these systems makes it hard to defend a causal link between commute reliability and absenteeism in front of auditors.
For night shifts, how do we measure whether escort/geofencing/SOS changes actually reduced women-safety incidents, not just changed how people report issues?
B0164 Causality for women-safety protocols — In India EMS for night-shift commutes, how can an EHS/Security lead measure whether women-safety protocols (escort rules, geo-fencing, SOS response) caused a reduction in incidents or escalations, rather than merely reflecting under-reporting or changed reporting channels?
In India EMS night-shift commutes, an EHS/Security lead can test whether women-safety protocols are actually reducing incidents by linking multiple independent data sources and looking for converging trends in risk signals, not just fewer complaints. The core idea is to measure upstream risk markers (route, driver and telematics behaviour) alongside downstream incident and escalation data and to verify that both improve in parallel.
A starting point is to separate three layers of data. The first layer is exposure. This includes number of women-night trips, total night kilometres, and mix of high-risk timebands or geographies as defined in escort and routing policies. A genuine safety improvement should show incident rates per 10,000 trips or per lakh kilometres decreasing even if total volume grows. A second layer is control activation. This includes how often escort rules are triggered and complied with, how many geo-fence alerts, speeding or route deviations are raised from IVMS or GPS dashboards, and how many SOS or panic events are received from the employee app or command centre. A third layer is harm and escalation outcomes, such as number of formal complaints, HR or transport escalations, and severe incidents that cross internal risk thresholds or trigger legal or disciplinary action.
A common failure mode is to celebrate lower incident counts without checking whether control-activation and risk signals have dropped or just gone quiet. If women-safety protocols are working, EHS should see a combined pattern of stable or higher reporting touchpoints, earlier and more minor escalations, and fewer high-severity events. If under‑reporting is the real driver, patterns often show lower formal complaints but unchanged or rising geo-fence breaches, unsafe driving alerts, unacknowledged SOS tests, and informal grievances captured by HR or transport desks.
Practical checks include targeted “canary” measurements. These may use anonymous pulse surveys after night shifts, random outbound calls from command centre or call centre agents to women employees on late routes, and periodic test SOS activations to measure response latency and escalation handling. EHS can compare these with system logs from the mobility platform, such as Alert Supervision System outputs, driver compliance and induction dashboards, and command centre operations records, to ensure reported confidence aligns with verified behaviour. In parallel, escort and routing compliance rates can be tracked via centralized compliance management, escort tagging in manifests, and route adherence audits so that reductions in complaints are matched by higher adherence and fewer high‑risk deviations.
To distinguish changed channels from real declines, EHS can also normalise incidents by channel and geography. For example, some portion of reports may shift from direct calls to HR into app-based SOS or platform tickets as tools like SOS control panels and employee apps are adopted. A real safety improvement is suggested when total incident density drops after re-bucketing into a unified incident ledger, while system‑generated alerts and corrective actions (such as retraining, driver off-boarding, or routing changes) are consistently executed and logged. Where possible, EHS should review women-specific safety controls, including women-centric safety protocols, chauffeur background verification, and shift‑wise briefings, to confirm that behavioural inputs (training completion, field audits, surprise checks) maintain or rise while serious outcomes decline.
If we change pickup buffers or routing, how can we roll it out in a way Operations can handle and HR can still prove impact, without employees calling it unfair?
B0165 Policy change comparisons without backlash — In India corporate ground transport (EMS), what’s the least-disruptive way to run a policy change comparison—such as changing pickup buffer times or introducing dynamic routing—so Operations can execute and HR can still claim causal impact without creating a fairness backlash among employees?
The least-disruptive way to compare EMS policy changes in India is to run short, tightly-governed operational pilots on a limited set of routes or shifts, with pre-agreed KPIs and clear communication that this is a controlled test, not a permanent rule, while keeping baseline policies intact for everyone else.
Operations teams benefit when pilots are bounded by route, time-band, and duration. This keeps rostering, command center workflows, and driver duty cycles stable. Centralized monitoring through a command centre or transport desk allows early alerts on OTP, no-shows, and incident trends, so supervisors can intervene before employee complaints escalate. Using existing EMS tools like route optimization, live tracking, and exception alerts avoids introducing new systems mid-pilot.
HR needs credible causal impact without fairness backlash. That works best when comparison groups are defined by operational logic that feels neutral to employees. For example, compare dynamic routing on a specific site or shift window, while another similar site or shift continues on fixed routing. Keep women-safety rules, escort policies, and night-shift protections identical across groups to avoid perceived dilution of duty-of-care.
Pilots work cleanly when four guardrails are explicit upfront:
- Clear KPIs that matter to both HR and Ops, such as on-time performance, employee satisfaction, and complaint volume per 100 trips.
- Fixed timebox, like 4–8 weeks, with a published review date to avoid “silent” permanent changes.
- Transparent but simple messaging to affected employees that explains purpose, duration, and how feedback will be used.
- Audit-ready data from existing dashboards, so HR can attribute impact and defend the outcome to leadership and employees.
How do we quantify the time we waste today because we can’t explain commute issues, and use that to justify better HRMS/attendance/access integration?
B0166 Quantifying operational drag of ambiguity — For India EMS shift commutes, how should a Transport Head quantify the operational drag of poor attribution—hours spent in manual reconciliations, escalations, and ‘why did this happen’ calls—and use that to justify investment in better HRMS/attendance/access-control data integration?
For India EMS shift commutes, a Transport Head should translate poor root‑cause attribution into hard hours and cost across three buckets—manual reconciliation, escalation handling, and post‑incident “what went wrong” analysis—and then show how cleaner HRMS/attendance/access‑control integration directly reduces those hours while improving OTP, safety assurance, and SLA compliance. The most defensible approach is to build a simple, recurring “ops drag” baseline, then model a conservative 30–50% reduction in that drag once data is unified and trip causality is clear.
A practical way to quantify this is to treat “attribution drag” as a hidden workload. Attribution drag typically appears when rosters, HRMS data, and access‑control logs are not synchronized with EMS routing and trip logs. Transport teams then spend time reconstructing who was rostered, who was actually present, whether no‑shows were real, and whether the delay was caused by employees, drivers, system errors, or policy gaps.
The Transport Head can run a four‑week time‑and‑motion sample. During this period, the team should explicitly log time spent on three activity types. The first activity is manual reconciliation of trips versus rosters and attendance. The second activity is escalation handling where the cause is unclear at first contact. The third activity is post‑incident investigations that require cross‑checking HRMS, attendance, and access‑control data with EMS trip logs.
For each activity type, the Transport Head can record the number of cases per shift, average minutes spent, and seniority level of staff involved. This allows conversion of time into an internal cost estimate using blended hourly rates. It also allows calculation of how many productive hours are lost per week to low‑value “forensics” instead of proactive routing, driver coaching, or exception prevention.
Once this baseline exists, the Transport Head can define a target state where the EMS platform is integrated with HRMS, attendance, and access control. In the target state, the EMS command center should see rostered employees, actual swipes, and route assignments in one place. This reduces ambiguity about whether a no‑show, delay, or route deviation was caused by attendance variance, access‑control delays, routing, or driver behavior.
The Transport Head can then build a simple justification model. The first component is hours recovered per week from reduced reconciliation and fewer multi‑party calls. The second component is avoided repeat incidents because patterns are visible earlier through unified data. The third component is reduction in disputes with HR, Finance, and employees, which otherwise consume senior leadership time and erode trust in EMS operations.
To make the case internally, the Transport Head should present this in a short, structured form. The first part is a quantified weekly drag statement showing average hours per shift lost to attribution work. The second part is a conservative reduction assumption tied to better HRMS/attendance/access‑control integration. The third part is a list of operational outcomes that matter to CHRO, CFO, and Security, such as clearer accountability on OTP failures, cleaner audit trails for safety and compliance, and decreased noise reaching senior leadership.
The Transport Head should also position this not as a technology upgrade alone but as a control‑room stabilizer. When attribution is automated through integrated data, command‑center staff get early, accurate signals. That enables proactive route recalibration, better driver fatigue and roster management, and more predictable SLA adherence across EMS operations.
In summary, the Transport Head can convert intangible “firefighting” into a measurable operational drag line item. That quantified drag then becomes a credible basis for investing in EMS‑HRMS‑attendance‑access‑control integration, framed as a way to reduce waste, improve reliability, and give every stakeholder cleaner answers when they inevitably ask “why did this happen?”
If we believe mobility improved shift adherence, how do we convert that into a Finance story (overtime/backfills/attrition) without overstating and upsetting Audit?
B0167 Finance narrative without overclaiming — In India corporate employee mobility (EMS), what is a realistic way to translate causal improvements in shift adherence into a Finance narrative (e.g., reduced overtime, fewer backfills, lower attrition risk) without overstating certainty and risking credibility with Internal Audit?
In corporate EMS in India, the most realistic way to link better shift adherence to Finance outcomes is to treat it as a disciplined sensitivity analysis, not a precise ROI claim. Finance teams respond best when transport improvements are tied to a small set of transparent assumptions, shown as ranges, and clearly separated into “hard” and “indicative” impacts with auditable baselines from HRMS and EMS data.
A practical pattern is to anchor on metrics that already exist in EMS and HR systems. These include on‑time performance, no‑show rates, late login counts, overtime usage, and attrition by shift band. Transport and HR can jointly define a “before” period and an “after” period for a specific EMS change, such as improved routing, centralized command‑center governance, or driver fatigue controls. Internal Audit will expect that any claimed causal link is shown through consistent measurement windows and controlled for obvious factors such as seasonality or policy changes.
To preserve credibility, organizations usually classify impacts into three tiers. The first tier is “direct and reconcilable” outcomes like reduced overtime hours or fewer ad‑hoc cabs due to improved on‑time performance, which can be tied back to finance and billing data. The second tier is “operational risk reduction,” such as lower incident exposure or fewer compliance breaches, where the effect is expressed as risk scenarios rather than booked savings. The third tier is “people and ESG benefits,” such as lower attrition risk or better commute satisfaction, which are shown as directional correlations alongside commute NPS or employee feedback, not as hard rupee values.
Most Internal Audit teams are comfortable when the EMS narrative documents the calculation logic, the data sources, and the limits of attribution. This means showing formulas for cost per employee trip, trip adherence rate, and overtime per late login, then explicitly flagging where assumptions are applied and where multiple factors may influence the result. A common failure mode is presenting point estimates without ranges or ignoring confounding variables like changes in workload, hiring, or broader HR policy shifts, which erodes trust.
A simple communication frame that tends to work well with Finance is to present three numbers for each EMS initiative. The first number is “baseline spend and performance” during the reference period, which is fully reconcilable to invoices and HRMS data. The second number is “observed delta” in shift adherence, late logins, and overtime, which is presented with confidence intervals rather than a single exact value. The third number is a “conservative, booked benefit” where only the portion of savings that passes an agreed materiality and attribution threshold is recognized, with the rest treated as qualitative upside.
This structure allows the Facility or Transport Head to talk about operational reliability and fewer escalations in the same language that the CFO uses for cost per kilometer and cost per employee trip. It also gives Internal Audit a clear audit trail, because every claim is tied back to defined EMS KPIs such as on‑time performance, trip adherence rate, and seat‑fill, instead of subjective impressions of “less firefighting.”
In our RFP, how do we stop vendors from making big ‘AI routing’ claims without proof, and what minimum evidence should we ask for (pre/post, cohorts, confounders)?
B0168 RFP guardrails against AI hype — In India EMS and Corporate Car Rental (CRD) programs, how can Procurement prevent vendors from claiming ‘AI routing’ impact without causality evidence, and what minimum evaluation artifacts (pre/post windows, cohort definitions, confounder list) should be required in an RFP response?
Procurement can prevent unsupported “AI routing” claims by requiring vendors to treat routing impact as an auditable experiment rather than a marketing statement. Vendors should be asked to specify baselines, controlled comparison windows, and how they isolate routing from other operational changes before any savings or OTP gains are accepted.
Vendors should be required to submit pre-defined measurement windows where input conditions are comparable. Procurement can mandate a historical pre-window that reflects current EMS or CRD operations and a matching post-window under the proposed routing engine, with the same shift mix, geography, and service catalog. Vendors should clarify whether they are measuring end-to-end Employee Mobility Services routes, Corporate Car Rental dispatch performance, or both, because the operational levers differ.
Cohorts should be explicitly defined at the route or trip level. Typical cohorts include shift-based EMS routes on specific corridors, executive CRD trips between certain airport or intercity pairs, or fleets of specific vehicle types such as EVs versus ICE vehicles that are subject to the same SLAs and command-center oversight. Procurement can insist that each cohort is tied to clear KPIs such as OTP, Trip Adherence Rate, vehicle utilization, cost per kilometer, and cost per employee trip.
A written confounder list is essential to avoid misattributing gains to “AI” that actually come from other changes. Vendors should disclose at least driver reallocations, changes in fleet mix or EV penetration, new shift patterns or hybrid-work policies, parallel safety or compliance initiatives, and any command center process changes. Procurement can require that routing impact is reported with and without such confounders, supported by trip logs and SLA dashboards, so Finance and Audit can reconcile any claimed reduction in dead mileage, cost, or exceptions back to traceable trip-level evidence.
If rosters and attendance data are messy, what proxy metrics can we use to assess mobility impact, and where do proxies usually mislead leaders?
B0169 Proxy metrics that don’t mislead — In India EMS where HRMS rosters and attendance punches are messy, what are the most reliable proxy metrics to use for causality analysis (e.g., gate swipe lateness, shift start variance) and what are the common ways these proxies mislead leadership?
In Indian employee mobility programs with messy HRMS rosters and unreliable attendance punches, the most reliable causality proxies are time-stamped transport events and security-system events that are independent of self-reporting. These proxy metrics help link commute performance to shift adherence, but each proxy can mislead leadership if used without context, normalization, and basic data hygiene checks.
The most operationally stable proxies usually come from systems that already run 24/7 for EMS: trip logs, command center data, and gate-level access systems. Transport teams can reliably mine trip start/end times, vehicle arrival versus scheduled pickup, check-in on driver and employee apps, and security gate swipe times. These sources generally have better timestamp integrity than HRMS rosters or manual attendance entries.
However, several patterns routinely distort causality analysis. Late gate swipes often reflect employees lingering at food courts or security queues, not just late vehicle arrivals. Early or manual attendance adjustments can mask true lateness and make transport look worse or better than reality. Roster sync failures between transport and HRMS create false variance, where a trip seems late against an outdated shift time. Leadership can also be misled when they compare a small, noisy subset of trips and infer patterns for the entire EMS operation.
To reduce misleading signals, transport heads should align proxy use with a few simple rules. Metrics like on-time pickup, trip adherence, and exception closure time should be computed from transport system logs first, and only then correlated with gate swipe delay bands rather than one-to-one timestamps. Outliers such as extreme traffic events or security freezes should be explicitly tagged by the command center so they do not corrupt baseline calculations. Finally, any shift-variance or “transport-caused lateness” insight presented to leadership should carry a brief explanation of data limitations and known edge cases, so HR and operations retain credibility when EMS data and HRMS data do not fully align.
When vendor trip logs, GPS, and employee check-ins don’t match, how do IT and HR agree on one source of truth so monthly impact discussions don’t turn political?
B0170 Single source of truth for OTP — In India employee transport (EMS), how do IT and HR agree on a single ‘source of truth’ for trip completion and on-time status when vendor trip logs conflict with GPS telemetry and employee check-in events, so that causality analysis doesn’t become a political debate every month?
In Indian employee transport, IT and HR align on a single “source of truth” when they define a canonical trip data model up front and enforce it through a governed platform where GPS telemetry, driver logs, and employee events are reconciled into one auditable trip ledger. Causality analysis stops being political when every trip has a shared ID, standardized timestamps, and pre-agreed precedence rules for conflicts, all surfaced through a common dashboard rather than vendor PDFs and ad-hoc Excel files.
A common failure mode is letting each vendor submit its own “truth” through siloed logs. This breaks once hybrid work, multi-vendors, and EV telematics enter the mix. The operations team is then forced to choose sides between an employee complaint, a driver duty slip, or GPS traces. IT and HR avoid this by insisting on API-first integration with HRMS, telematics, and rider/driver apps, so the platform assembles a single trip object per shift run, with immutable start/end, route, and OTP status.
Trade-offs sit in how “strict” the precedence logic is. Most organizations make server-side GPS and platform timestamps primary, with driver-entered times and manual corrections marked as secondary and always versioned. HR’s concern about fairness and grievance handling is addressed by exposing full event history for each disputed trip, including employee app check-in, SOS triggers, and command-center overrides. IT’s concern about audit and DPDP compliance is addressed by role-based access, retention policies, and a clear schema for trip and incident data.
In practice, teams that achieve operational calm treat the trip ledger like a financial ledger. They assign ownership (usually Transport under HR governance, with IT as schema guardian), define reconciliation windows and exception SLAs, and lock the data set used for billing, safety audits, and ESG reports. This is reinforced by a command-center workflow where deviations, GPS failures, or app downtime are logged in real time and appended to the trip record, not discussed anecdotally weeks later.
Concrete guardrails that typically work are:
- Single trip ID from roster creation through completion and billing.
- Standard timestamp hierarchy, e.g., platform event > GPS trace > manual entry.
- Frozen “month-end truth” after a defined reconciliation period, with any later dispute handled as a corrective credit, not a retroactive rewrite.
- Shared SLA library for OTP, TAR, incident closure time, and how they are computed from the same dataset.
When this governance is in place, monthly reviews focus on patterns like OTP%, Trip Adherence Rate, driver fatigue signals, and EV uptime, rather than arguing over whose log is right. That, in turn, lets HR talk confidently to leadership about attendance and safety, and lets IT defend the integrity of the underlying data estate.
Before we tell leadership mobility affected retention, what confounders should we document (manager/pay/site/hybrid), and how do we avoid analysis paralysis?
B0171 Confounder checklist for retention claims — In India EMS shift transport, what confounders should HR explicitly document before presenting mobility-to-retention causality to the CEO—manager change, pay revisions, site transfer, hybrid policy—and how do you keep that list from becoming an excuse to do nothing?
In Indian EMS shift transport, HR must explicitly document parallel changes that also influence retention. HR should treat these as control variables in analysis, not as reasons to abandon the link between commute reliability and attrition.
Key confounders to document are any changes that affect employee experience, income, or work patterns during the same period that transport is being improved. These include manager or team changes that alter day‑to‑day treatment, pay and allowance revisions that change take‑home incentives, site or process transfers that change commute distance or job content, and hybrid or RTO policy shifts that change the frequency of commuting.
Most organizations fail when they treat these confounders as a reason to say “it’s too complex” instead of designing a simple, auditable approach. A practical pattern is to log each confounder as a dated event at the same granularity as shift rosters and EMS usage data. HR then compares attrition and commute complaints across cohorts that did and did not experience the same change. This allows HR to show the CEO that even after accounting for pay bands, locations, and manager changes, poor on‑time performance and safety escalations still correlate with higher resignations and lower attendance.
To prevent the confounder list from becoming an excuse to do nothing, HR can define a short, fixed set of tracked variables, lock that list for at least two quarters, and agree in advance that EMS impact will be assessed “controlling for” but not “waiting for perfect data.” The control-room mindset is to get to a stable, “good enough to act” evidence pack, rather than chasing a perfect academic model while night‑shift escalations continue.
How do we share findings like ‘route changes reduced late drops’ without employees feeling we’re using tracking to police them?
B0172 Communicating insights without surveillance optics — In India EMS where unions or employee forums are active, how can HR communicate causality findings (e.g., ‘route changes reduced late drops’) without triggering a ‘Big Brother’ reaction that the company is tracking people to penalize them?
In Indian employee mobility programs with active unions or forums, HR can communicate causality findings safely by framing insights at the fleet or route level, tying them to safety and welfare outcomes, and being explicit that person-level data will not be used for discipline. HR should show that EMS analytics are used to improve OTP, women’s safety, and commute comfort, not to monitor individual behavior.
HR communication works better when it references system changes that employees can feel. For example, HR can say that dynamic routing and real-time monitoring helped achieve a 98% on-time arrival rate during adverse weather and improved satisfaction scores, as shown in WTicabs’ monsoon case study. The focus remains on reduced late drops and safer night routing as a collective win, rather than on identifying specific employees or drivers.
A common failure mode is to present dashboards and GPS capabilities without a clear data-governance boundary. Unions then assume that trip logs and telematics primarily serve surveillance or performance punishment. HR can pre-empt this by defining, in writing, which EMS data is used for safety (SOS triggers, geofencing around unsafe zones), for reliability (route optimization, standby deployment), and for ESG reporting (EV utilization and CO₂ reduction), and which is explicitly excluded from individual appraisal or disciplinary processes.
The message is more credible when HR shares aggregated indicators only. Examples include route-level late-drop reduction, seat-fill improvement, and EV uptime, as WTicabs shows with six‑month trend KPIs, instead of naming specific employees or singular incidents. HR can also invite employee or union representatives to co-review anonymized dashboards, reinforcing that the command center and alert systems exist as a “safety and continuity layer” rather than a hidden surveillance mechanism.
Over time, trust increases when causal claims are followed by visible benefits. If HR states that route changes will reduce late-night exposure for women employees and then reports fewer late drops and higher satisfaction, employees start associating EMS data with tangible safety and convenience, not with “Big Brother” oversight.
images:
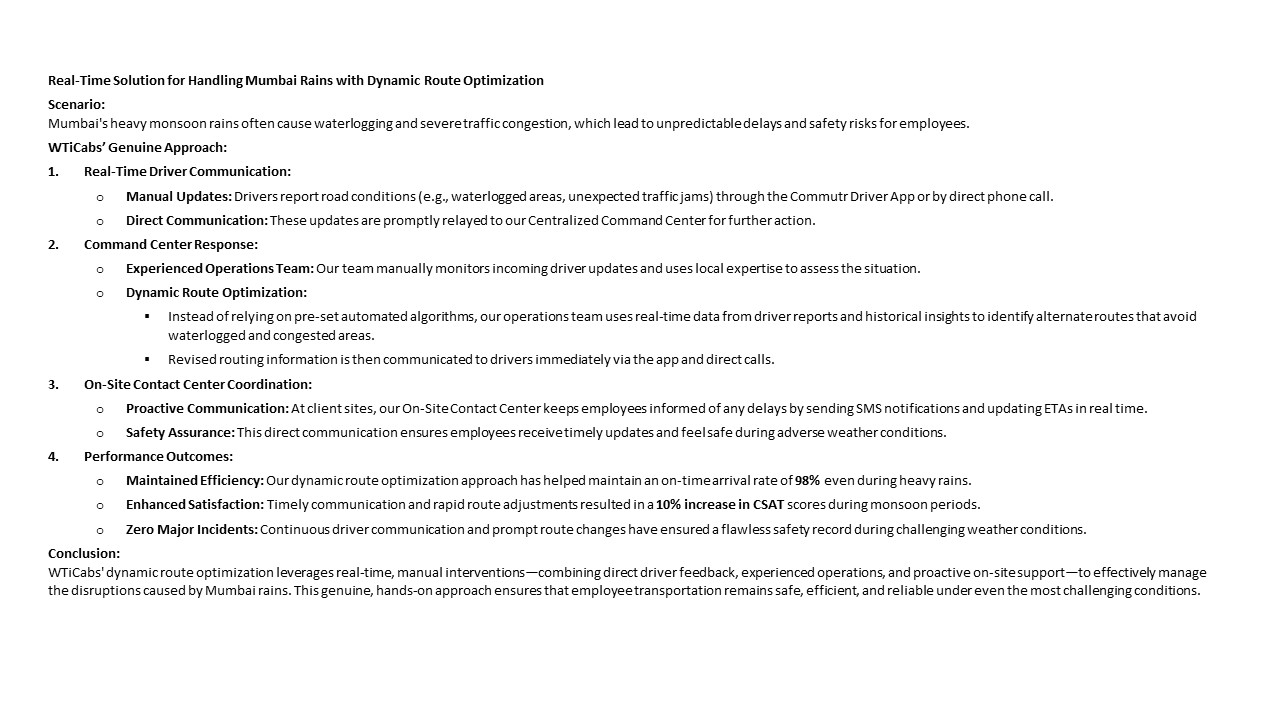
.jpg)
If an auditor shows up, what evidence pack should we generate fast to back our mobility impact claims (trip logs, access swipes, roster versions, tickets), and who owns it?
B0173 Audit-ready causality evidence pack — In India corporate employee mobility (EMS), what ‘panic button’ evidence package should HR and Compliance be able to generate during a labor or safety audit to substantiate causality claims—time-stamped trip logs, access swipes, roster versions, incident tickets—and who should own producing it?
In Indian corporate employee mobility, HR and Compliance should be able to produce a single, coherent “panic-button evidence package” that reconstructs the entire trip and incident timeline with audit-ready proof. This package should combine time-stamped mobility data, access control and roster records, and incident-management artifacts, and it should be owned end-to-end by a central transport command / compliance function, with HR as policy owner and Security/EHS as safety custodian.
What the panic-button evidence package must contain
The evidence package should allow an auditor to answer four questions clearly. The questions are “Who was where, with whom, in which vehicle, under which policy, and what happened when the panic/SOS was pressed.” The package should therefore include:
- Trip lifecycle records. Time-stamped trip creation, assignment, start, intermediate waypoints, and end. GPS traces and route adherence logs from the fleet or NOC dashboards. Trip IDs matching billing and MIS records from tools such as the Commutr dashboard and ETS Operation Cycle flows.
- Panic / SOS event data. Exact SOS trigger time, location, and device identity from the Alert Supervision System or SOS control panel. Escalation and notification logs showing who was alerted, when, and through which channel. Evidence of automated ticket creation and status updates from the SOS – Control Panel and Employee App.
- Rosters and policy context. The shift roster version in force at the time of the trip, including escort requirements and women-first or night-shift rules where applicable. Historical versions of rosters to prove no back-dating, aligned with ETS Operation Cycle and Employee Mobility – Service Overview artifacts.
- Identity, access, and attendance. Employee identity, pickup and drop locations, and any office access swipes or HRMS attendance events that corroborate boarding and de-boarding times. Where applicable, QR code boarding or ride check-in logs from employee apps.
- Driver and vehicle compliance. Current driver licensing, background verification, medical fitness, and training logs from Driver Compliance, Driver Assessment & Selection Procedure, and Driver Management & Training frameworks. Vehicle fitness, permits, and safety inspection checklist status from Fleet Compliance & Induction and Safety Inspection Checklist for Vehicle.
- Safety and women-specific controls. Evidence that women-centric protocols were in force. This includes escort deployment rules, geo-fencing, call masking, GPS monitoring, and women-safety cell coverage, as shown in Women-Centric Safety Protocols, Women Safety & Security, and Employee Safety materials.
- Incident management trail. The full incident ticket from creation to closure. This includes time-stamped actions by the command centre, escalations via the Escalation Mechanism and Matrix, communications with the employee, and final RCA and corrective actions. Artifacts from Safety & Security for Employees and Transport Command Centre should support this.
- Command-centre observability. Screenshots or exportable logs from the command centre or TCC that show real-time monitoring was active, alerts were received, and SOPs were followed. Relevant collateral includes Command Centre, Transport Command Centre, and Principle Role of Command Centre.
Who should own producing the evidence
A centralized transport command / compliance function should own the operational generation of this evidence package. HR should own policy definitions and employee communication and should sponsor requirements for audit-ready traceability. Security/EHS should own safety SOPs, incident classification, and acceptance of the final incident record for legal and regulatory defense.
IT and Data/Analytics teams should own the integrity and availability of the underlying logs and integrations. Procurement and Legal should ensure contracts mandate that mobility vendors, command-centre operators, and platform providers retain and expose these datasets in an auditable, tamper-evident form compatible with centralized compliance management and tech-based measurable and auditable performance frameworks.
measurement design, controls & ROI framing
Offer practical, repeatable analysis designs (pre/post, matched cohorts), unit definitions, window lengths, and credible proxies so outcomes are defensible and auditable.
If one site improves because the local team got stronger, how do we avoid claiming it was the mobility program and normalize results across sites and vendors?
B0174 Normalizing causality across sites — In India EMS for multi-site enterprises, how do Strategy and HR avoid false causality when a single flagship site improves (due to a new Transport Head) but other sites don’t—what’s the right way to normalize results across sites and operators?
In multi-site employee mobility, Strategy and HR avoid false causality by benchmarking each site against a normalized, like-for-like baseline instead of treating one flagship’s improvement as proof that “the model works everywhere.” Normalization means comparing sites only after adjusting for input conditions such as city, shift pattern, fleet mix, and vendor maturity, and then tying performance to a common KPI framework and observation window.
Strategy teams first need a canonical KPI set across EMS, such as OTP%, Trip Adherence Rate, Trip Fill Ratio, Cost per Employee Trip, incident rate, and EV utilization ratio. Each site is then profiled on structural variables like city traffic severity, proportion of night shifts, workforce size and hybrid-work elasticity, fleet composition, and vendor aggregation complexity. A normalized index can be built by expressing each site’s KPIs as deltas versus its own starting baseline and versus a peer group of comparable locations rather than versus the best-performing flagship alone.
A common failure mode is copying the flagship’s playbook without its enabling conditions, such as a stronger local vendor base, more experienced Transport Head, or better IT integration. Another failure mode is attributing all improvement to leadership change without isolating the impact of routing optimization, command-center observability, compliance automation, or commercial changes. Strategy and HR should therefore run controlled pilots, hold-constant governance and SLAs, and use the centralized command center and mobility data lake to compare trend lines under similar demand and policy conditions.
To keep causality honest, organizations should:
- Define site clusters (e.g., high-night-shift metros vs smaller cities) and compare only within clusters.
- Use pre/post analysis at each site with identical measurement windows and data sources.
- Tag interventions explicitly in the trip lifecycle and governance logs so changes in OTP or safety can be traced to specific operational levers rather than to “good management” in the abstract.
For night-shift escalations, how do we attribute issues to real failure modes (driver no-show, routing, app outage, security) so fixes are targeted and not just vendor blame?
B0175 Attributing escalations to failure modes — In India EMS operations, what is a practical way to attribute night-shift escalations to specific failure modes (driver no-show, routing error, app outage, security delay) so that corrective actions are targeted rather than ‘blaming the vendor’?
In India EMS night-shift operations, the most practical way to attribute escalations to specific failure modes is to turn every serious incident into a structured, time-stamped trip record that is reconciled across four data streams: command center logs, trip/app telemetry, driver-side events, and security/escort logs. This shifts conversations from vendor blame to evidence-backed root-cause codes per trip.
A workable pattern is to treat each night-shift trip as a “case” with a unique ID and a small, fixed root-cause taxonomy. Each escalation is tagged against that ID with one primary failure code such as driver no-show, routing/ETA miss, app/platform outage, or security/escort delay. Command center staff update this classification within a defined closure SLA, using GPS traces, IVMS data, SOS logs, and call records to validate what actually happened on the ground.
This approach works best when the EMS platform already maintains a trip ledger with OTP%, route adherence, and exception timestamps, and when the 24x7 NOC uses standard operating procedures for incident logging and escalation matrices. Night-shift cases can then be reviewed in weekly or monthly governance forums, where patterns across failure codes drive targeted actions such as driver fatigue management, routing-engine recalibration, app reliability fixes, or tightening of women-safety escort processes.
To keep the model robust and usable, organizations typically define a short list of mutually exclusive failure codes, enforce mandatory selection of one primary code per escalation, and separate root cause from “owning party” so that finance, HR, security, and the operator can act on the data without defaulting to generic vendor blame.
HR feels commute improvements helped retention, Finance says it’s unprovable—what level of rigor is good enough to approve the next phase budget?
B0176 HR–Finance conflict on retention attribution — In India corporate mobility (EMS), how do HR and Finance resolve the conflict where HR wants to attribute retention gains to improved commute experience, but Finance argues the effect is unprovable—what level of causal rigor is ‘good enough’ to fund the next phase?
In Indian employee mobility programs, HR and Finance typically converge on a “decision-grade” level of causal rigor, not academic proof. A change in commute experience is considered “good enough” to justify the next phase of investment when there is a stable baseline, clear before–after deltas on a few HR and transport KPIs, and a traceable logic that links those deltas to specific mobility changes rather than to generic HR noise.
HR usually starts by framing commute as one of several drivers of retention and attendance, not the only one. A common pattern is to track pre/post trends in metrics already visible to Finance and leadership, such as attrition in transport-dependent cohorts, late login and no-show rates on shift rosters, complaint volume and closure SLAs tied to transport, and commute-related NPS or satisfaction scores. When these move in the right direction in the same window as a defined EMS change—such as implementing an integrated platform, women-safety controls, or EV-based shuttle routes—and when other big HR levers (pay, policy, org changes) are relatively stable, Finance is more willing to treat commute improvement as a material contributor, even if not perfectly isolated.
Finance tends to accept causal claims when three conditions are met. There is a clearly documented “before” operating model and baseline, using transport and HRMS data that can later be audited. There is a bounded pilot or cohort comparison, for example, sites or shifts moved to structured EMS versus those still on legacy vendors, with side-by-side outcomes on OTP, complaints, and attendance. And there is a quantified business impact narrative, such as reduced absenteeism on night shifts, lower replacement and hiring costs in high-attrition teams, or measurable productivity stability in critical processes, which can be reconciled back to transport logs and billing rather than only to survey sentiment.
Most organizations do not demand randomized trials or full econometric models for EMS funding decisions. They look for converging evidence across a small set of operational and HR indicators, consistency over a few quarters, and transparent methods that Internal Audit could follow if asked. HR gets traction when it positions commute not as a stand-alone “retention product,” but as a risk-reduction and stability lever. Finance, in turn, usually considers rigor “good enough” when the commute-EX story is backed by clean trip and attendance data, clear baselines, and a simple, defensible attribution logic instead of broad, untraceable claims.
What governance should IT enforce (roster and shift-policy versioning) so our before/after comparisons don’t get invalidated by untracked changes?
B0177 Version control for roster and policy — In India EMS tied to access-control and attendance systems, what governance rules should CIOs enforce around versioning of rosters and shift policies so that ‘before vs after’ causality comparisons aren’t undermined by silent policy tweaks?
In India, CIOs should enforce strict versioning and change-governance for rosters and shift policies so that every EMS dataset is time-stamped, policy-linked, and audit-traceable before it is used for “before vs after” analysis. Causality comparisons stay reliable only when each trip, exception, and KPI is mathematically tied to the exact policy, routing logic, and attendance rule set that was active at that moment in time.
CIOs need to treat rosters, shift policies, and routing rules as governed configuration assets rather than operational spreadsheets. Each roster upload, shift-window change, escort rule tweak, or seat-fill threshold adjustment should create a new immutable configuration version. Each version should carry effective-from and effective-to timestamps and a mandatory change reason that can be used later for RCA and KPI re-segmentation.
Every trip record in the EMS platform should reference the specific roster and policy version IDs that governed that trip. This link should flow through to OTP%, Trip Adherence Rate, seat-fill, cost-per-trip, and absence or late-login analytics so that trend breaks can be distinguished from true performance changes. Silent edits to historical rosters or policies should be technically blocked and allowed only via controlled correction workflows with audit logs.
Change windows for major policy shifts such as new shift bands, female-first routing rules, escort criteria, or EV-only corridors should be explicitly defined and frozen. CIOs should require pre-change baselining and post-change tagging so hybrid-work elasticity, new routing engines, or access-control rules can be evaluated without data contamination. Integration with HRMS and access-control systems should be schema-stable, with deprecation paths for fields and flags rather than silent overwrites.
To reduce governance drift, CIOs should mandate periodic configuration audits inside the mobility command center. These audits should verify that the live roster/policy versions in the routing engine match approved governance records and that no city, vendor, or project desk is using unapproved local variants. They should also ensure that business continuity scenarios and emergency overrides are tagged distinctly so they do not pollute long-term performance or ESG trend analysis.
How do we check if better commute NPS really improved attendance/attrition, and wasn’t just a temporary service push after complaints?
B0178 Linking commute NPS to outcomes — In India Employee Mobility Services (EMS), how can a CHRO tell whether improved commute NPS actually caused better attendance and lower attrition, versus simply reflecting a short-term vendor ‘service push’ after escalations?
In India Employee Mobility Services, a CHRO can separate real impact from a short‑term vendor “service push” by testing whether commute NPS movements line up with hard HR metrics over time, under stable operating conditions, and across multiple cohorts and sites. The more that improved commute NPS consistently precedes and correlates with better attendance and lower transport‑linked attrition across different teams and months, the more likely it is causal rather than a one‑off recovery effort after escalations.
A common failure mode is reading NPS spikes that follow a major incident as “success.” These spikes often coincide with intensified vendor attention, extra standby cabs, and manual firefighting. In practice, these periods distort normal unit economics and operating patterns. A CHRO should therefore exclude the immediate post‑escalation window from causal analysis. The focus should instead be on 3–6 month trends where routing, fleet mix, SLAs, and commercials are relatively unchanged, yet commute NPS gradually improves and then is followed by fewer late logins, lower no‑show rates, and fewer transport complaints.
A stronger test is to compare matched groups. For example, compare night‑shift or high‑commute‑dependency teams on upgraded EMS (better routing, more reliable OTP, stronger women‑safety controls) versus similar teams still on legacy patterns. If the upgraded cohorts show sustained improvement in attendance volatility and a lower proportion of transport‑cited exits, while other factors (manager changes, role redesign, pay corrections) are controlled, the case for commute NPS as a driver of outcomes is stronger than if improvements are system‑wide after a single vendor push.
To reduce ambiguity, CHROs can work with Transport and HR analytics to define a small, fixed indicator set that links directly to EMS: on‑time performance, no‑show due to cabs, transport‑tagged tickets, commute NPS for specific routes, and transport‑cited reasons in exit interviews. When these move together over multiple quarters, and when changes in EMS policy or vendor governance (for example, central command‑center oversight or better compliance automation) clearly precede the shifts, the pattern is more indicative of genuine cause–effect than of a temporary uplift from escalated vendor attention.
If costs improved, how do we prove it came from better routing (dead miles/seat fill) and not from unsafe shortcuts like reduced buffers or rest noncompliance?
B0179 Cost savings vs unsafe shortcuts — In India EMS, what is the most defensible way to attribute cost improvements (lower dead mileage, higher seat-fill) to routing optimization rather than to a vendor quietly cutting corners on safety buffers or driver rest compliance?
In India EMS, the most defensible way to attribute cost improvements to routing optimization is to prove that unit-cost gains move in parallel with stable or improved safety, compliance, and reliability KPIs rather than at their expense. Organizations need linked evidence that dead mileage and better seat-fill improved while driver rest, incident rates, escort and women-safety compliance, and OTP stayed within pre-agreed bands and were continuously auditable.
A common failure mode is to accept lower cost per km or cost per employee trip without checking rest-hour adherence, cab duty cycles, or women-safety routing rules at night. This usually shows up later as higher incident risk, OTP volatility, and audit exposure. A defensible narrative instead uses NOC and telematics data to show that routing changes reduced dead mileage and improved Trip Fill Ratio, while Trip Adherence Rate, Driver Fatigue Index, and safety alerts either stayed stable or improved.
The most robust approach is to frame routing optimization as an “experiment under guardrails.” Before changes, organizations lock in non-negotiable constraints such as maximum duty hours per driver, minimum rest windows, female-first policies on late drops, and escort rules. They then compare before–after periods on a fixed KPI set that covers OTP%, dead mileage, seat-fill, incident rate, safety alert volume, and audit trail integrity.
To keep the attribution credible, three practices help:
- Hard-code safety and compliance rules into the routing engine so that optimization is only allowed inside those bounds.
- Use command-center dashboards and random route adherence audits to confirm that on-ground execution matches digital plans.
- Tie outcome-based commercials not just to cost metrics, but also to minimum thresholds for OTP, safety incidents, and compliance scores.
What’s the right analysis window (weekly/monthly/quarterly) so results are stable but still useful for route and vendor decisions?
B0180 Choosing the right analysis window — In India corporate ground transportation for EMS and CRD, how do stakeholders decide the right time window for causality analysis (weekly vs monthly vs quarterly) so that results are stable but still actionable for route and vendor governance?
In Indian corporate EMS and CRD programs, stakeholders typically anchor causality analysis to the operational heartbeat of the service. Weekly windows suit frontline route and roster adjustments. Monthly windows suit vendor governance and commercial discussions. Quarterly windows suit strategic model changes and board‑visible narratives such as EV adoption or ESG performance.
Weekly analysis works best for the Facility or Transport Head because shift adherence, OTP%, no-shows, and driver fatigue patterns change with rosters, traffic, and seasonality. Weekly windows provide enough trips per route or site to smooth out daily noise but still allow rapid correction of issues like recurring late pickups, dead-mile spikes, or specific driver/vehicle problems. A common failure mode is using daily data for causality, which creates overreaction to isolated incidents and increases firefighting.
Monthly windows are more appropriate for Procurement, Finance, and vendor governance because they align with billing cycles, SLA assessments, and cost-per-km or cost-per-trip validation. Monthly aggregation stabilizes metrics such as Trip Adherence Rate, Vehicle Utilization Index, and incident rates so they can be credibly linked to penalties, incentives, or vendor re-balancing. If stakeholders rely only on weekly views for commercial decisions, they risk disputes because the sample can be too small or skewed by special events.
Quarterly analysis serves CHRO, ESG, and leadership where the focus shifts to structural patterns such as commute experience trends, EV utilization ratio, emission intensity per trip, and overall SLA compliance index. Quarterly windows are stable enough to separate persistent causes from short-term noise and support decisions like vendor consolidation, contract redesign, or fleet-mix changes between ICE and EV. Using only quarterly windows for operations is a failure mode because it delays correction of safety or reliability issues that appear at the command-center dashboard.
Most organizations therefore use a tiered cadence where causality hypotheses are formed on weekly data, validated on monthly aggregates, and institutionalized or challenged on quarterly reviews. Weekly trends can trigger playbooks such as rerouting, driver retraining, or buffer capacity changes. Monthly results can drive commercial levers and vendor scorecards. Quarterly reviews can inform the mobility roadmap, including hybrid-work routing policies and EV scale-up decisions.
A practical guardrail is to require a minimum event or trip volume threshold before accepting a causality signal at any window. Route-level changes can rely on a week of data if there are many trips per day. Vendor or city-level judgments usually need at least one full month of operations including peak and off-peak periods. Strategic ESG or EX narratives should be based on at least a quarter of consistent EMS or CRD operations to avoid greenwashing or overclaiming improvement.
With hybrid work changing who’s even supposed to come in, how do we isolate the impact of mobility changes on attendance?
B0181 Hybrid-work denominator problem — In India EMS with hybrid-work variability, how can HR isolate the impact of mobility changes on attendance when the underlying denominator (who is scheduled to come in) keeps changing due to WFH exceptions and manager overrides?
In hybrid-work EMS environments, HR can isolate mobility impact on attendance only by treating “expected to be onsite” as a governed data set and then comparing transport-linked cohorts against clean baselines. HR cannot rely on raw headcount or roster totals. HR needs a precise, daily denominator of employees who were actually scheduled and approved to be in office and had transport entitlement.
The core move is to integrate EMS with HRMS and shift systems so that every trip, no-show, or delay is tagged to a specific, policy-approved onsite shift. Attendance analysis must be run only on this filtered population. HR should then separate employees into cohorts such as “using EMS,” “self-commute,” and “WFH override granted” and compare login, punctuality, and absence patterns across these cohorts.
Most organizations benefit from creating a commute-specific KPI set that includes cost per employee trip, on-time performance, and a simple Commute Experience Index, and then running “before–after” comparisons only on employees whose work pattern did not change. A common failure mode is mixing policy changes, team relocations, and WFH liberalization into a single analysis window, which makes mobility appear noisy or inconclusive.
In practice, HR can treat every mobility change as a controlled “pilot” on a selected site or function. HR can then lock policy for that pilot period and measure deltas in attendance, late logins, complaints, and attrition for that defined group. This approach aligns with outcome-linked procurement and gives HR an audit-ready narrative that separates workspace policy noise from mobility delivery quality.
With multiple route vendors, how do we attribute performance changes to a vendor vs our own policy changes, so tiering decisions don’t feel political?
B0182 Vendor attribution for tiering decisions — In India EMS where multiple vendors run different routes, how can Procurement and Operations attribute performance changes to a specific vendor’s execution versus enterprise policy changes, so that vendor tiering decisions don’t feel arbitrary or political?
In multi-vendor Employee Mobility Services, Procurement and Operations can separate vendor execution from enterprise policy changes by standardizing metrics, time-banding comparisons, and change logs, then tying vendor tiers to pre-agreed evidence rules instead of anecdotes or escalations. Vendor tiering feels fair when every score can be traced back to shift windows, route risk, and documented policy shifts, not just raw OTP or complaint counts.
A common failure mode is comparing vendors across very different conditions. One vendor might handle night-shift, long-distance, low-seat-fill routes, while another runs short, daytime, high-density routes. Raw OTP, incident counts, or cost per trip will naturally diverge here. Procurement and Operations need normalizing factors such as route complexity, timeband, and escort/women-safety requirements before scoring vendors.
Another failure mode is policy drift being mistaken as performance gain or loss. If the organization changes shift windows, routing rules, or escort policies, those changes will impact OTP, Trip Adherence Rate, cost per employee trip, and incident exposure. These shifts must be logged as dated change events and reflected in scorecards so trends before and after the change are not attributed solely to the vendor.
Four practical guardrails reduce “political” vendor decisions:
- Anchor all vendor scorecards to a common KPI set such as OTP%, Trip Adherence Rate, incident rate, and seat-fill, sliced by city, timeband, and route type.
- Compare vendors only within like-for-like clusters such as same city, timeband, and route risk profile instead of across fundamentally different portfolios.
- Maintain a simple mobility change log that records policy changes, fleet-mix shifts, or routing rules with dates so any KPI step-change can be cross-checked.
- Link tiering rules to explicit thresholds and observation windows so upgrades and downgrades follow a pre-agreed ladder rather than ad-hoc escalations.
When Procurement and Operations can show that each vendor’s tier is the outcome of cluster-based KPIs, documented change context, and a published scoring method, vendor governance feels predictable, audit-ready, and less personal to all parties.
If we don’t have data scientists, what’s a minimum causality approach we can still defend to the CFO using attendance and access-control evidence?
B0183 Minimum viable causality for small teams — In India Employee Mobility Services (EMS), what is a realistic ‘minimum viable causality’ approach a small HR Ops team can run without data scientists—while still being credible with a CFO who expects reconciled attendance and access-control evidence?
A realistic “minimum viable causality” approach for Employee Mobility Services in India is to use a few tightly-governed operational datasets, simple before/after comparisons, and reconciled logs from attendance and access-control systems, instead of any statistical or AI-heavy modelling. This approach stays credible with a CFO when every claim about commute impact can be traced to concrete, audit-ready evidence from HRMS, transport logs, and site access data.
The HR Ops team can start by defining a small, fixed set of outcome metrics. These metrics can include on-time performance for pickups and drops, late-login counts, no-show rates, and basic cost per employee trip. Each outcome metric should be explicitly tied to a specific evidence source, such as transport trip logs, HRMS attendance data, or access-control swipes.
A simple baseline period can then be chosen, such as three months of operations before a routing or vendor change. The team can compare this baseline with an equivalent period after the change. The key is to use consistent definitions for shift windows, employee cohorts, and locations so the comparisons remain fair and defensible.
To link mobility changes to attendance outcomes, HR Ops can follow a stepwise logic rather than complex causality models. For example, OTP improvements on specific routes can be checked against reductions in late-logins for the same routes and shift windows. This cross-check can be repeated for multiple sites or timebands to see if the pattern holds.
Data reconciliation is critical for CFO trust. HR Ops should maintain a simple mapping table between trip IDs, employee IDs, and shift codes, and use that mapping to reconcile trip manifests with HRMS attendance and access-control swipes. Any missing or conflicting records should be logged, explained, and classified as exceptions.
A documented SOP for data handling helps maintain repeatability. This SOP can describe how trip data is exported from the mobility platform, how it is joined with HRMS and access logs, and how monthly summaries for OTP, late-logins, and cost per trip are created. The SOP should include clear responsibilities and a checklist to avoid manual errors.
The HR Ops team can increase credibility by publishing standard monthly dashboards that show trend lines rather than one-off snapshots. These dashboards can track OTP, attendance volatility, exception counts, and basic cost metrics. They can also highlight where the data is incomplete and include short notes on known operational anomalies.
A minimum level of governance over vendor data is also important. HR Ops can ask vendors to follow uniform trip logging practices, preserve GPS and manifest data for a defined retention period, and provide structured exports that match HRMS identifiers. This reduces the reconciliation burden and improves auditability.
When reporting to the CFO, HR Ops should distinguish clearly between correlation and causation claims. They can state that certain changes coincide with measured improvements while explicitly flagging other factors that may influence outcomes, such as seasonality or policy shifts. This transparency strengthens trust even without formal causal models.
Over time, the team can refine this minimum viable causality approach by adding more granular segments such as night-shift female employees or specific high-risk routes. They can also layer in ESG-related metrics like EV utilization ratio or emissions per trip, as long as the underlying calculations remain fully traceable to operational data.
images:
How do we spot and fix data drift (new punch rules or access devices) that silently breaks our before/after comparisons and misleads leadership?
B0184 Detecting data drift in comparisons — In India corporate mobility (EMS) with HRMS and attendance integrations, how do you detect and correct ‘data drift’—like changed punch rules or new access-control devices—that can silently break causal comparisons and lead to wrong executive decisions?
In Indian corporate mobility programs that integrate EMS with HRMS and attendance, organizations detect and correct “data drift” by treating HR/attendance feeds as governed data products, with explicit schemas, baselines, and anomaly alerts, instead of assuming they are static integrations. Data drift is managed through continuous observability across routing, trip logs, and HRMS data, along with clear change-control SOPs between HR, IT, and Transport teams.
Data drift in this context usually appears when shift codes, punch rules, access-control hardware, or roster fields change without synchronized updates in the mobility platform. This silently breaks causal comparisons between “transport provided” and “attendance/late login,” and it undermines KPIs like cost per employee trip, OTP impact on productivity, or seat-fill versus attendance. Most organizations that ignore this drift end up with misleading dashboards and wrong executive decisions about fleet sizing, vendor performance, and policy changes.
A practical control-room approach uses three elements. First, schema contracts and validation between EMS and HRMS ensure that any new fields, devices, or rules trigger a review before going live in production. Second, streaming analytics and dashboards perform reconciliations between trip manifests, OTP, and attendance patterns, flagging anomalies like sudden shifts in “no-show” or “late login” distributions for investigation. Third, a formal change-advisory SOP requires HR, IT, and Transport to log and approve changes to punch rules, access devices, or roster structures, with targeted re-baselining of KPIs before management presentations.
For early warning and correction, transport heads can rely on command-center style views that correlate route adherence, trip completion, and attendance outcomes over time. They can also use indicative management reports and single-window dashboards that highlight deviations, rather than only raw counts, so drift is visible before it pollutes executive narratives or board-level ESG and productivity disclosures.
After an incident, how do we quickly and defensibly check whether transport contributed using trip timelines, SOS logs, tickets, and access timestamps—without a blame game?
B0185 Rapid causal check after incident — In India EMS, when an incident occurs and leadership demands ‘did transport contribute,’ what is the quickest defensible method to assess causal contribution using trip timelines, SOS logs, call recordings/tickets, and access-control timestamps without turning it into a blame game?
The quickest defensible method is to reconstruct a minimal, time‑ordered “trip event timeline” from authoritative system logs, and then test a small set of predefined causality questions against that timeline. The timeline must be built from raw trip, SOS, call‑center, and access‑control data without interpretation, and the questions must focus on control‑breaks and SLA deviations, not on individuals.
Operations teams should first lock and export raw data feeds for the specific trip window. The critical sources are trip creation and dispatch timestamps from the EMS platform, GPS and route adherence data, SOS event logs, call recordings or tickets from the command center, and access‑control or gate‑entry timestamps for the employee and vehicle. This data provides a verifiable foundation that can be shown to HR, Security, and auditors without relying on memory or anecdote.
Transport or command‑center staff should then construct a single chronological log for that trip. Each row should capture “what happened, when, and in which system,” for example cab assignment, driver acceptance, vehicle reaching gate, employee boarding, any SOS triggers, calls from employee or driver, command‑center interventions, and final drop or incident time. This step is mechanical and should avoid assigning blame or motives, reducing emotional heat in the first review.
Once the unified timeline exists, leadership can test a short checklist of causality questions. These should include whether the cab or routing deviated from approved plans, whether there were avoidable delays versus defined on‑time performance expectations, whether SOS or alert responses breached agreed response‑time thresholds, and whether required safety controls such as escort rules or approved routes were in force. This converts “did transport contribute” into specific, binary or time‑bound checks.
If one or more of these checks fail against the log, teams can record “contributory transport factor present” with the exact control that failed, such as delayed dispatch, missed diversion handling, or non‑compliant routing. If all checks pass, they can document that transport operated within agreed SOPs and SLAs for that trip, while still supporting Security or HR in investigating non‑transport causes. This method gives the Facility or Transport Head a fast, repeatable way to answer leadership questions using existing EMS command‑center tooling, incident dashboards, SOS logs, and access‑control integrations, without escalating into a personal blame cycle.
If billing disputes reduced, how do we prove it’s because SLA-to-invoice linkage improved, not just fewer audits or looser approvals that quarter?
B0186 Attributing dispute reduction to controls — In India EMS and Corporate Car Rental (CRD), how can Finance validate that reductions in billing disputes were caused by better SLA-to-invoice linkage rather than simply fewer audits or more tolerant approvers that quarter?
Finance can validate that billing-dispute reductions are due to better SLA-to-invoice linkage only if dispute, SLA, and audit data are captured in a structured, time-series way and tied to the same trip and vendor records. Finance must separate “real control improvement” from “less scrutiny” by comparing dispute patterns, SLA outcomes, and audit activity before and after the change in EMS and CRD processes.
Finance should first ensure that every EMS or CRD trip has a unique trip ID that links routing and GPS logs, SLA metrics such as OTP and TAR, and the corresponding invoice line item. Finance should then track dispute rate per 1,000 trips, average time-to-resolution, and root-cause categories for each period. A common failure mode is reporting fewer disputes without verifying that SLA breach rates or exception volumes have also decreased.
Finance can compare pre- and post-change periods where SLA-to-invoice linkage was implemented while keeping audit intensity visible as a separate KPI. Finance should monitor audit sample size, audit frequency, and findings severity so that a drop in disputes accompanied by stable or increased audit coverage signals genuine improvement. Finance should also review vendor governance dashboards and ETS or CRD trip ledgers to confirm that SLA breach detection, exception logging, and penalties or credits are still being applied consistently.
To strengthen evidence, Finance can define a simple validation checklist: - Disputes per 1,000 trips are down while SLA adherence metrics such as OTP% and TAR are stable or better. - Independent route adherence and RAA findings are not deteriorating. - Audit coverage and exception-report volume have not dropped in parallel with disputes. - Invoice variances flagged by automated reconciliation rules have decreased, not just manually raised disputes.
If these trends move together, Finance can credibly attribute lower disputes to better SLA-to-invoice linkage rather than to fewer audits or more lenient approvers.
What guardrails should HR and IT use for location/trip analytics so we can measure impact without creating surveillance optics or privacy anxiety?
B0187 Privacy guardrails for causality analytics — In India EMS where employees fear surveillance, what guardrails should HR and IT put in place for analytics using location and trip data so that causality measurement is possible without creating ‘Big Brother’ optics or DPDP compliance anxiety?
In Indian employee mobility programs, HR and IT should treat location and trip analytics as a governed safety-and-operations tool, not a people-surveillance tool. Causality measurement remains possible when data is minimized, anonymized where feasible, and bound to clear policies, consent flows, and technical controls that are auditable under the DPDP Act.
HR and IT should first narrow the purpose in writing. HR should specify that location and trip data is used to improve OTP, route safety, EV utilization, and cost baselines, and not to monitor individual productivity or off-duty behavior. IT should mirror these purposes in data schemas, role-based access, and report definitions so managers do not receive individual-level “tracking” views when they only need route or fleet KPIs.
A common failure mode is unbounded retention and over-detailed dashboards that expose named employees’ movements. HR should define retention windows separately for operations, billing, and safety investigations. IT should implement aggregation and pseudonymization for most analytics, keeping identity-linked trip logs behind stricter controls and shorter access lists, with tamper-evident audit trails.
To preserve causality analysis, HR and IT can rely on patterns such as OTP%, Trip Adherence Rate, seat-fill, EV utilization ratio, and incident heatmaps at cluster or route level. These metrics allow correlations to traffic, roster patterns, or fleet mix without continuously exposing who sat in which cab at what time.
Three practical guardrails are critical:
- Policy guardrail. HR publishes a commute data policy that bans use of trip/location data for performance appraisal, disciplinary action (except safety violations), or off-duty surveillance.
- Design guardrail. IT enforces role-based dashboards where HR, Transport, Finance, and ESG see only the granularity needed for their KPIs, with employee identity masked by default.
- Compliance guardrail. Joint HR–IT governance defines lawful basis, consent UX, retention schedules, and incident access procedures aligned to DPDP, with periodic audits of who accessed which trip data and why.
How do we decide between A/B rollouts (by site/shift) and matched-cohort analysis when HR worries about fairness and Ops worries about complexity?
B0188 A/B vs cohort analysis trade-off — In India EMS, how do you choose between policy change comparisons (A/B by site or shift) versus matched-cohort analysis when HR is worried about fairness and Operations is worried about execution complexity?
In India EMS, most organizations choose matched-cohort analysis as the default and use A/B-by-site or shift only when the policy and risk are very well understood. Matched cohorts reduce perceived unfairness for HR and limit operational disruption, while A/B pilots are better for fast, high-signal tests when execution playbooks are already mature.
Matched-cohort analysis keeps one uniform commute policy for all employees while comparing outcomes between similar groups in the data. This protects HR from “two-class employee” accusations and social media backlash. It also avoids complex routing bifurcation, which Transport Heads struggle with during night shifts, peak-load routing, and vendor coordination. The trade-off is slower learning and heavier analytics work to control for differences in role, location, shift windowing, and vendor mix.
A/B-by-site or shift assigns different commute policies explicitly to different clusters such as locations, timebands, or business units. This simplifies measurement and vendor governance because each cluster runs a consistent playbook, and OTP, CET, and safety incidents can be compared cleanly. The risk is operational stress when the routing engine, roster desk, and command center must handle multiple rule-sets in the same city, and HR must defend why two employees in similar situations receive different benefits.
A practical EMS playbook is:
- Use A/B-by-site or shift only for low-sensitivity changes such as routing rules, seat-fill targets, or vendor allocation, where HR can clearly explain the rationale.
- Use matched cohorts for high-sensitivity levers such as night-shift escort policies, women-first rules, or eligibility thresholds, where fairness and duty-of-care expectations are high.
- Anchor both approaches in a single governed platform so rosters, OTP, incident logs, and cost per employee trip can be compared without adding manual work for Transport and the command center.
After a big event commute, how do we attribute delays to route design vs on-ground crowd control vs dispatch errors so the post-mortem actually prevents repeats?
B0189 Event commute delay attribution — In India Project/Event Commute Services (ECS), after a large offsite or plant shutdown movement, how can Operations attribute delays to route design versus on-ground crowd control versus vendor dispatch errors, so the post-mortem leads to real fixes before the next event?
In Indian Project/Event Commute Services, Operations can only separate route design issues from crowd-control gaps and vendor dispatch errors if the event is instrumented end-to-end with time-stamped data and pre-defined checkpoints for every trip and zone. Attribution works when each leg of the trip lifecycle has its own measurable SLA, log, and owner.
First, Operations teams need a clear event-commute blueprint. Route design teams must lock shift windowing, temporary routing, and peak-load assumptions in advance. Each planned trip should have a scheduled gate-out time, route pattern, and ETA based on the routing engine or playbook. These planned times form the baseline for all variance analysis after the plant shutdown or offsite.
Second, on-ground crowd control must be treated as a separate control layer. Marshals or control-desk staff should log when passengers are actually ready at gates, queue start and end times, and when buses or cabs are allowed to move. Simple tools like gate check-in manifests, QR/OTP boarding times, or supervisor WhatsApp logs aligned to a central time standard can distinguish “vehicle waited 20 minutes for people” from “vehicle arrived late.”
Third, vendor dispatch performance needs its own telemetry. The dispatch center should record vehicle reporting time at yard or holding area, actual arrival at pickup gate, adherence to assigned route, and any unscheduled diversions. GPS and trip logs enable Operations to see when a cab or bus was not where the roster said it should be. Random route adherence audits and exception tags like “no-show driver,” “late reporting,” or “unauthorized diversion” help quantify vendor faults.
In post-mortem, Operations can then bucket delays by where variance first appeared. If routes show consistent ETA overrun across multiple vehicles, that points to poor route design. If vehicles arrived on time at the gate but departed late because passengers were not ready or crowd flow was unmanaged, that indicates crowd-control or event scheduling issues. If vehicles left yards late, missed routes, or showed large GPS gaps, that highlights vendor dispatch failure.
A practical ECS review pack usually includes at least:
- Planned vs actual times at three checkpoints per trip. Yard reporting, gate arrival/departure, and destination arrival.
- Tagged exception reasons chosen from a controlled list. For example, route overrun, late passenger readiness, or driver no-show.
- Heatmaps of delay clusters by timeband and gate or loading zone.
- A joint review with project/event control desks and vendors to agree root causes and corrective actions.
Without these distinct logs and tags, blame remains anecdotal and fixes are generic. With them, Operations can tighten future route design, reconfigure crowd marshaling and gate times, or enforce vendor governance and dispatch SLAs before the next large movement.
images:
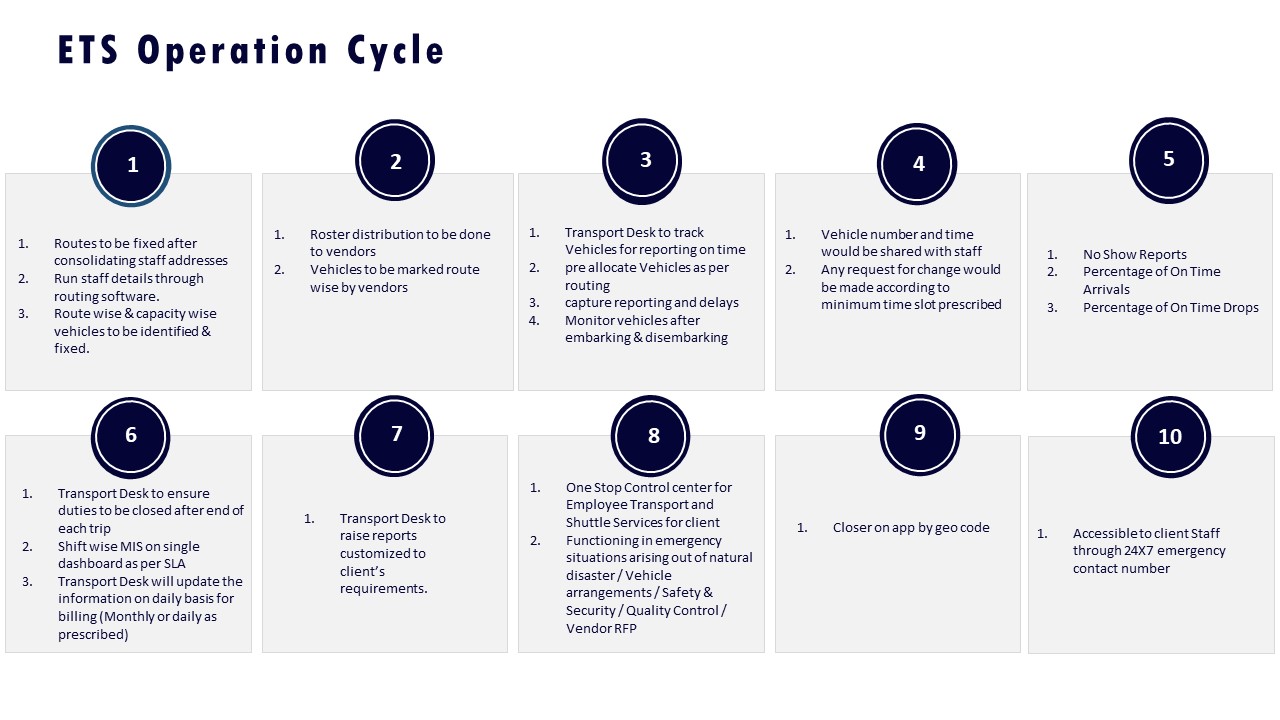
What should we treat as the unit of analysis—employee-day, trip, route, or shift—so HR/Ops/Finance don’t end up with different ‘truths’?
B0190 Agreeing on unit of analysis — In India EMS, what is the cleanest way to define the ‘unit of analysis’ for causality—employee-day, trip, route, or shift—so that HR, Operations, and Finance don’t each produce different ‘truths’ from the same mobility data?
The cleanest primary unit of analysis for causality in India EMS is the employee‑shift‑trip record, with a secondary roll‑up to shift window and route as analytic views, not as base units. This unit aligns HR’s focus on attendance and safety, Operations’ focus on OTP and routing, and Finance’s focus on cost and utilization against one common event definition.
An employee‑shift‑trip record ties one employee, to one booked shift window, to one trip instance, with a single causal outcome set. This outcome set typically includes fields such as on‑time pickup/drop flags, no‑show status, safety or incident flags, seat‑fill, and fully allocated cost per employee trip. Most organizations struggle when HR works on an employee‑day view, Operations on trip or route views, and Finance on kilometer or invoice lines, because each unit aggregates different slices of the same underlying trip lifecycle.
Using employee‑shift‑trip as the canonical unit allows all derived KPIs to be reconciled. HR can calculate commute experience, attendance deltas, and women‑safety compliance from the same record. Operations can compute OTP%, Trip Adherence Rate, dead mileage attribution, and Driver Fatigue indices by grouping these records at shift window or route level. Finance can tie Cost per Employee Trip, Cost per Kilometer, and Utilization Revenue Index back to the same atomic records that generated billing and MIS.
To avoid “multiple truths,” organizations typically standardize three layers:
- A canonical trip ledger in which every employee‑shift‑trip is a uniquely keyed row.
- Semantic roll‑ups where shift windows, routes, and employee‑days are treated as views built exclusively from that ledger.
- Governed KPI definitions mapping each HR, Operations, and Finance metric to explicit transformations on the same employee‑shift‑trip base.
How do we present causal impact with uncertainty (directional vs proven) without leadership dismissing HR as soft or indecisive?
B0191 Communicating uncertainty without losing authority — In India EMS where leadership is impatient, how can HR present causal impact with appropriate uncertainty (confidence intervals, sensitivity checks, or ‘directional only’ flags) without being dismissed as ‘soft’ or indecisive?
In Indian employee mobility, HR gains credibility when commute impact is framed as hard operational risk with clearly labelled uncertainty, not as vague “employee sentiment.”
HR should anchor discussions on shift adherence, attrition, incident risk, and ESG exposure, and then show how commute reliability moves those numbers with confidence bands, ranges, and “directional only” flags where evidence is early-stage.
HR leadership is usually dismissed when it presents point estimates without showing data lineage, caveats, or alternative explanations.
A more trusted pattern is to start from clean operational metrics like on‑time performance, no‑show rate, and absence spikes by shift window.
HR can then link these to attendance stability, grievance volumes, and retention, and mark each link as “high confidence,” “medium with sensitivity,” or “directional only” based on available evidence.
Causal impact should be communicated with simple constructs.
For example, HR can say that improving OTP from 90% to 96% is associated with a specific reduction range in late logins or transport‑linked complaints, and explicitly note that this is an association with controlled confounders like seasonality or roster changes.
Where data is thin, HR should provide scenario bands instead of single numbers and label insights as “pilot evidence” rather than mature findings.
Practical credibility signals for HR include:
• using baseline periods and comparison groups instead of single before/after anecdotes.
• declaring known limitations up front, such as fragmented vendor data or partial HRMS integration.
• running sensitivity checks that show how results change when outliers or specific months are removed.
• separating commute causality from other factors such as policy changes or business cycles.
A common failure mode is mixing attitudinal survey scores with cost or risk claims without showing linkage logic.
Most organizations respond better when commute experience indices are placed alongside hard KPIs like trip adherence rate, exception closure time, and incident rate.
HR can then show how directional changes in experience are used as early‑warning indicators rather than as proof of financial impact.
In practice, leadership accepts uncertainty when it sees discipline and boundaries.
HR that explicitly distinguishes between what is causal, what is strongly correlated, and what is only directional appears rigorous rather than hesitant.
This allows EMS investments like EV transition, command‑center enhancements, or routing automation to be evaluated against structured hypotheses, tolerance bands, and review cadences instead of one‑off promises.