How to turn service catalog mapping into operational calm: a practical playbook for shift-based mobility
Dispatch teams live this reality: GPS glitches, driver shortages, and weather or traffic disruptions are part of the shift. When things go wrong, the operations command center must stay steady without finger-pointing or piling on new tools. This framework groups the most consequential questions into actionable lenses that translate SLA noise into repeatable, on-ground SOPs. It’s designed to give you clear escalation paths, audit-ready evidence, and frontline procedures you can actually execute in a 5-minute window during peak shifts.
Is your operation showing these patterns?
- Escalations spike at odd hours with no clear owner
- Vendors blame each other over blended SLAs
- No-shows and last-minute roster changes overwhelm dispatch
- Audits uncover patchy evidence trails and inconsistent SLA proof
- Control-room spends time reconciling dashboards instead of solving issues
- Drivers report fatigue or morale dips even when OTP appears compliant
Operational Framework & FAQ
Definition, scope and KPI design by service line
Clarifies what to map, why KPIs differ by line, and how to avoid one-size-fits-all SLAs; sets the foundation for auditable outcomes across EMS, CRD, ECS, and LTR.
What exactly is “service catalog mapping” in corporate mobility, and how is it different from a simple list of cab types and prices?
B0192 Define service catalog mapping — In India corporate ground transportation, what does “service catalog mapping” mean for employee mobility services (EMS) and corporate car rental (CRD), and how is it different from just listing vehicle types and rate cards?
Service catalog mapping in Indian corporate ground transportation means defining exactly which mobility services, entitlements, and SLAs each employee or use‑case is allowed to use, and then wiring those rules into operations, technology, and commercials. A simple list of vehicle types and rate cards is only a price sheet, while a mapped service catalog ties those vehicles and prices to policies, personas, timebands, and governance.
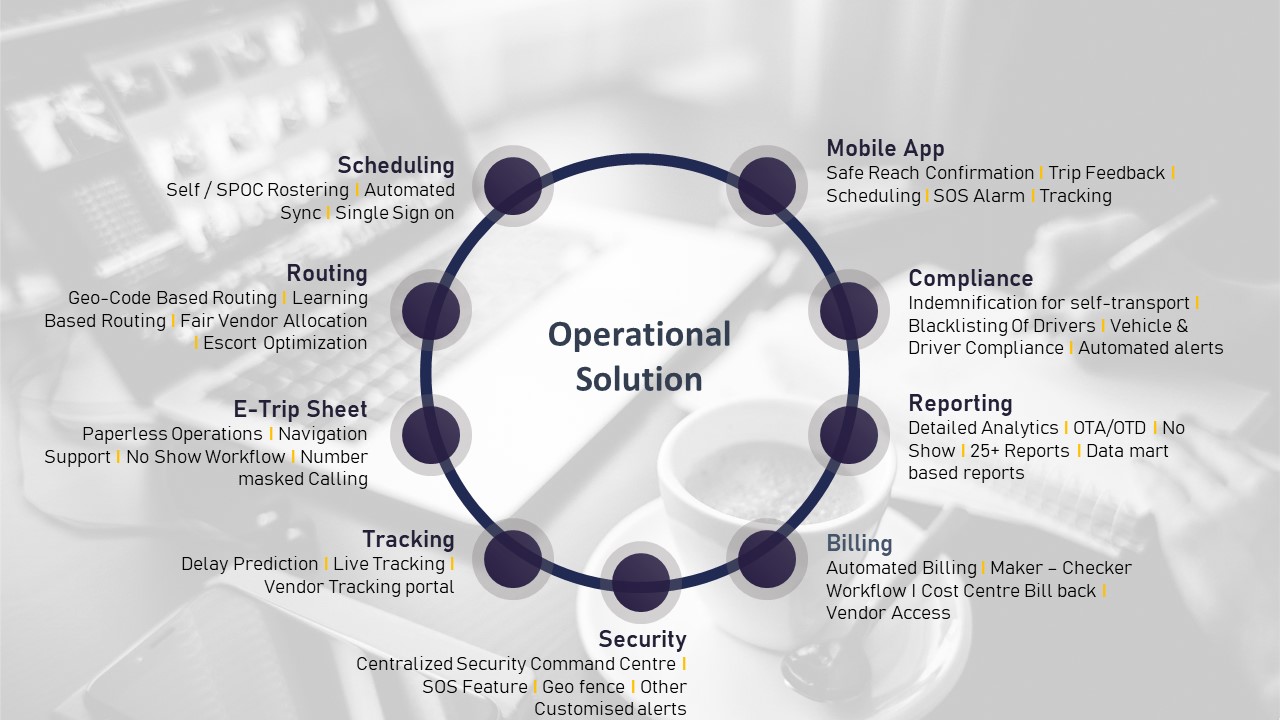
In employee mobility services, service catalog mapping links shift windows, routing rules, women-safety protocols, and escort policies to specific service lines such as home–office shuttles, pooled cabs, or night-shift drops. Each service line carries defined SLAs for on-time performance, safety controls like SOS and geo-fencing, and compliance expectations for driver KYC and vehicle fitness, which are then enforced through the routing engine, HRMS integration, and the command center.
In corporate car rental, service catalog mapping separates use-cases such as airport transfers, intra-city trips, intercity movements, and long-term rentals, and assigns who can request which category, what class of vehicle is permitted, and which approval and billing path applies. This structure enables outcome-linked procurement, centralized booking and spend control, and consistent audit trails, instead of ad-hoc usage driven only by which car is available at which tariff.
A pure vehicle-type and rate-card list ignores employee personas, policy tiers, safety requirements, hybrid-work patterns, and outcome KPIs such as cost per employee trip, seat-fill, and trip adherence rate. Service catalog mapping connects all of these dimensions so that EMS and CRD run as governed programs with predictable reliability, cost, safety, and ESG performance, rather than as a loose collection of cars and prices.
For shift commute, why can’t we use one common SLA for all trips—why do we need different outcomes and KPIs by service line?
B0193 Why KPIs differ by line — In India employee mobility services (shift-based EMS), why do buyers map outcomes and KPIs separately for each service line (day shift, night shift, women-safety rides, pooled routes) instead of using one common SLA for all employee trips?
In shift-based employee mobility services in India, buyers separate outcomes and KPIs by service line because risk, cost, and operational complexity are fundamentally different for day shift, night shift, women-safety rides, and pooled routes. A single, averaged SLA hides these differences, makes audits weak, and leaves HR, Transport, Security, and Finance exposed when an incident or cost overrun occurs.
Day and night operations behave like different products. Night shifts face higher safety risk, escort and route-approval requirements, and tighter scrutiny from HR, Security, and regulators. Buyers therefore track separate on-time performance, incident rates, and escort compliance for night trips. Day shifts are usually higher volume and cost-sensitive, so KPIs focus more on seat-fill, dead mileage, and cost per employee trip to drive utilization and TCO.
Women-safety rides carry disproportionate reputational and legal exposure. Organizations need distinct KPIs for female-first policies, route audits, SOS performance, driver KYC/PSV freshness, and escort adherence. If these are blended into a generic SLA, a single lapse can still look “within threshold” on paper, while HR and Security have no defensible evidence for boards or investigators.
Pooled and non-pooled routes also have different economics and reliability patterns. Pooled routes are measured on trip fill ratio, routing efficiency, and dead-mile caps. Point-to-point or ad-hoc trips are measured on response time and OTP. If buyers do not isolate KPIs, they cannot see whether optimization engines and pooling policies are genuinely reducing CPK and CET or just shifting pain into cancellations and late logins.
Separate KPI maps allow outcome-linked procurement. Contracts can index payouts and penalties to service-specific metrics such as night-shift OTP, women-safety incident rate, pooled-seat utilization, and exception-closure time instead of a blunt, system-level SLA. This reduces disputes with vendors and gives Finance and Procurement traceable logic between invoices, SLAs, and actual trip logs.
For Transport Heads and Command Centers, service-line-specific KPIs translate into clearer playbooks. Dispatch rules, buffer fleets, routing strategies, and escalation matrices differ by timeband, gender mix, and pooling model. Without separate KPIs, command centers cannot tune routing engines, capacity buffers, or EV/ICE fleet mix by shift window or risk profile.
A common SLA is therefore treated as a governance summary metric, while service-line KPIs are the real control levers. Buyers rely on granular, service-specific KPIs to meet regulatory expectations, protect against greenwashing in ESG disclosures, and maintain continuous assurance on safety, compliance, and cost at the same time.
For airport and intercity corporate trips, what do we usually map in service catalog mapping—trip types, SLAs, exceptions, billing—what’s in scope?
B0194 What gets mapped in CRD — In India corporate car rental (airport and intercity CRD), how does service catalog mapping typically work at a high level—what is being mapped (trip types, approval flows, SLAs, exception categories, billing rules) to define measurable outcomes?
In India corporate car rental for airport and intercity (CRD), service catalog mapping typically links each trip type to defined approval flows, SLA metrics, exception categories, and billing rules so outcomes like on‑time performance, cost per trip, and incident rates can be measured and governed. The catalog behaves like a controlled menu of “what is allowed, under which conditions, at what service standard, and at what commercial logic.”
At a high level, organizations first segment CRD use cases into clear trip types. These typically include airport transfers, intra-city point‑to‑point, hourly packages, intercity one‑way and round‑trip, event or VIP movements, and project or long‑duration disposals, as shown in the collateral on corporate car rental and related service overviews. Each trip type is then mapped to allowed vehicle classes, operating models such as point‑to‑point or garage‑to‑garage, and whether bookings are ad‑hoc or pre‑scheduled.
For each mapped trip type, a standard approval flow is defined. This usually specifies who can initiate the request, which manager or travel desk approves, and any policy constraints such as advance‑booking cut‑offs or entitlement tiers. Admin and transportation apps, partner portals, and centralized booking tools reflect this by enforcing manager approvals, cutoff configurations, and role‑based access for employees, admins, and travel agents.
SLA mapping focuses on response times, punctuality, and service quality. For airport CRD, SLAs are often tied to flight tracking, vehicle reporting before pickup time, and waiting time thresholds. For intercity, SLAs cover vehicle age and fitness, chauffeur compliance, route adherence, rest‑break norms, and real‑time tracking availability. These commitments are captured into dashboards, alert supervision systems, and command‑center views so OTP, trip adherence, geofence violations, over‑speeding, and safety events can be monitored in real time.
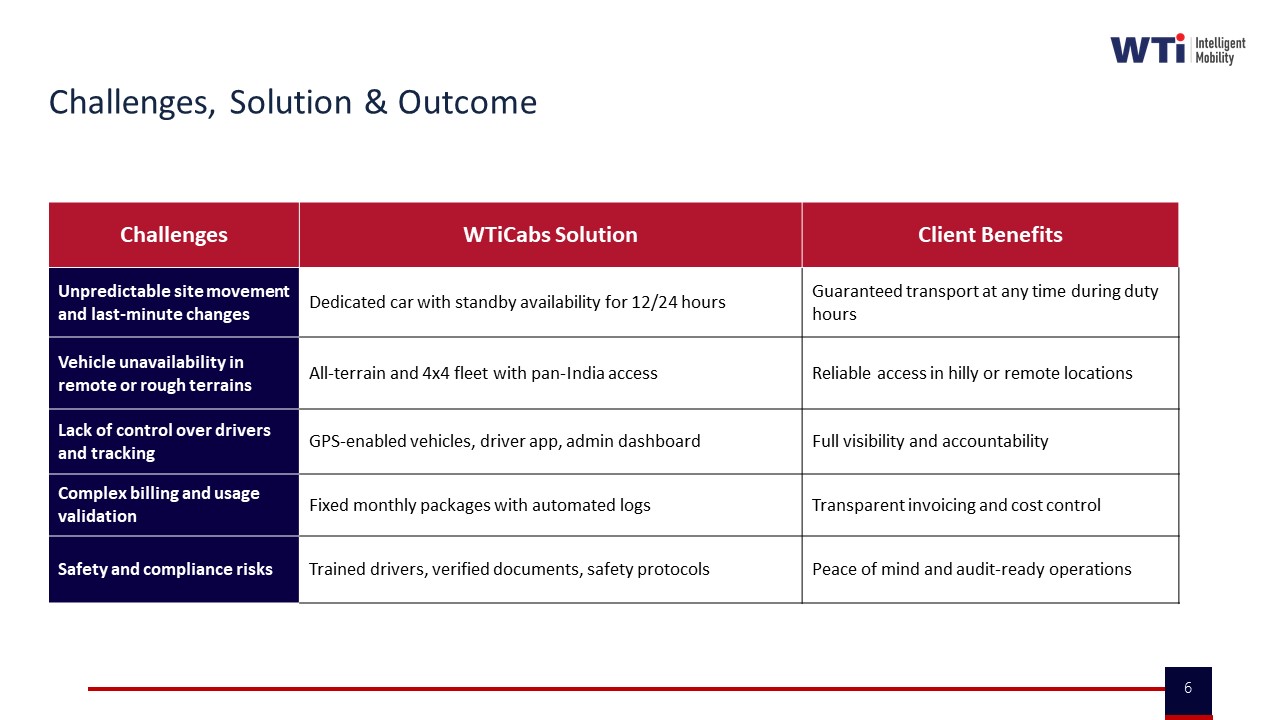
Exceptions are categorized and mapped to both operational and commercial handling rules. Common exception categories include no‑shows, last‑minute cancellations, schedule changes, app or GPS failures, vehicle breakdowns, and safety incidents. For each category, there is a defined SOP for escalation, communication, and whether charges apply. Collateral on business continuity plans, escalation matrices, and on‑time delivery management shows how these exception categories are operationalized through buffer vehicles, backup systems, and pre‑agreed mitigation steps.
Billing rules are tightly bound to the catalog. For every trip type and operating model, the catalog specifies the billing model (per km, hourly package, trip‑based, FTE, pay‑per‑usage, or monthly rental), inclusions (fuel, toll, parking, driver charges), minimum billing slabs, and out‑of‑scope charges such as overnight halt, extra hours, or extra kilometers. Centralized billing systems then map trip logs and GPS data to these rules via tariff mapping, automated tax calculations, and reconciliation workflows, as illustrated in the billing process and features collateral.
Measurable outcomes emerge because each catalog entry carries its own KPI stack. For an airport transfer SKU, for example, the organization can track OTP%, complaint rates, and average cost per trip against a known SLA and commercial pattern. For intercity disposals, managers can monitor vehicle utilization, dead mileage, and incident rates relative to the contracted package model. Data‑driven insights dashboards and indicative management reports then aggregate this, enabling procurement, finance, and operations to benchmark vendors, enforce penalties, and optimize fleet mix or package selection.
In mature setups, the same catalog mapping is also linked to compliance and safety frameworks. Vehicle and driver compliance status, women‑safety protocols, and HSSE responsibilities by role are attached to service types and timebands. This allows safety and EHS teams to test whether night airport runs or late‑evening intercity arrivals are always serviced by credentialed drivers, compliant vehicles, and appropriate escort or SOS coverage, with trip and incident evidence centrally logged.
Overall, high‑level service catalog mapping in CRD creates a structured grid where trip archetypes, approval flows, SLAs, exceptions, and billing logic are pre‑defined and technology‑enforced. This reduces ad‑hoc decisions by control‑room teams, simplifies billing and audit, and enables consistent measurement of reliability, safety, and total cost across airport and intercity corporate car rental.
How can HR tell if our commute issues are because outcomes/KPIs aren’t defined well versus the vendor just executing badly?
B0195 Diagnose KPI vs execution gap — In India enterprise-managed employee transport (EMS), how can an HR head diagnose whether the current problem is “unclear outcome definition” versus “vendor execution,” using symptoms like repeated escalations, SLA disputes, and inconsistent on-time performance reporting?
In enterprise-managed employee transport, repeated escalations and SLA disputes usually have two different roots. Vague, shifting expectations point to unclear outcome definition. Clear written expectations with consistent gaps in field execution point to vendor execution failure. HR can separate the two by mapping what is written, what is measured, and what actually happens in daily operations.
If outcome definition is weak, HR teams usually find that there is no single, signed document that defines on-time performance, safety duties, women’s night-shift rules, and escalation SLAs in measurable terms. Different stakeholders often quote different OTP baselines, grace periods, or escort rules. Reports from the command center, the vendor, and internal MIS rarely align on the same KPI definitions, and Procurement cannot easily link SLAs to billing, penalties, or incentive logic.
If vendor execution is weak, the contract and SOPs are usually quite clear, but route adherence, driver compliance, or fleet uptime are inconsistent across sites or time-bands. Transport or facility heads see patterns like good OTP on day shifts but chronic slippage on night or monsoon shifts, despite stable definitions. The command center logs show repeated geofence violations, driver fatigue breaches, or unclosed incidents, even though the safety and compliance rules are well defined.
HR can run a basic diagnostic by checking three things in a short review:
- Documents: Are OTP, safety, women’s safety, and escalation targets written in specific numbers and time-bands?
- Data: Do all parties use one canonical report for OTP, incidents, and SLA breaches, or are there multiple, conflicting versions?
- Behavior: When challenged, does the vendor say “this was never agreed” or “we could not execute as agreed”?
If definitions and data are fragmented, HR’s first move is to clarify outcomes and standardize KPI definitions with Procurement, Transport, and the vendor. If definitions and data are clear, HR’s focus should shift to enforcing vendor governance, strengthening command-center monitoring, and using audit trails, route adherence checks, and incident logs to hold execution accountable.
How do we set different outcomes/KPIs for executives, big shift cohorts, and pooled shuttles—without ending up with a messy SLA matrix?
B0196 Avoid an unmanageable SLA matrix — In India shift-based employee mobility services (EMS), what are the practical steps to map outcomes and KPIs differently for executives, large shift populations, and pooled shuttles serving campuses or business parks without creating an unmanageable SLA matrix?
In India shift-based employee mobility, organizations can map outcomes and KPIs differently by defining 2–3 outcome “profiles” (executive, large-shift EMS, pooled shuttle) and then mapping most sites and routes to one of these profiles instead of writing bespoke SLAs for every lane. Each profile uses a small, stable KPI set tuned to the service intent, while sharing a common data and reporting spine from the centralized command center to avoid matrix explosion.
For executives using corporate car rental–style EMS, the KPI profile prioritizes punctuality and service consistency. Transport teams typically anchor on on-time performance for pick-up and airport/intercity drops, vehicle standard and chauffeur compliance, and incident-free trips. Trip-level analytics and CRD-style dashboards support Finance and Admin with response-time SLAs, clean invoicing, and audit-ready duty slips without adding separate tools.
For large shift populations in classic EMS, organizations move to a volume and reliability profile. The command center tracks on-time performance at shift start, trip adherence rate against planned routes, seat-fill or trip fill ratio to control cost per employee trip, and exception detection-to-closure time for safety or GPS incidents. Safety and compliance indicators such as escort compliance, women-first night routing, and credential currency sit in the same SLA bundle, surfaced through centralized compliance management and real-time alerts rather than separate SLAs per route. Data-driven insights and single-window dashboards help transport heads see OTP, dead mileage, and no-shows without manual collation.
For pooled shuttles serving campuses or business parks, the profile shifts to throughput and experience. KPIs focus on headway adherence, capacity utilization across timebands, dwell times at key stops, and emission intensity per trip where EV fleets are in use. In EV-enabled campuses, organizations may add EV utilization ratio and CO₂ reduction per kilometer using measurable sustainability dashboards, aligning with ESG reporting without rewriting operational SLAs. Pooled services still use the same routing and tracking stack, but apply community metrics at route or corridor level rather than employee level.
To keep the SLA matrix manageable, transport heads usually standardize three elements. First, they define a core KPI core (OTP, safety incidents, incident closure time, and cost per trip) that applies across all profiles. Second, they add only one or two profile-specific KPIs per archetype, such as executive experience scores for leadership cars or seat-fill and emission indices for pooled shuttles. Third, they implement a single observability and reporting layer, using dashboards and indicative management reports that slice the same data by persona, route type, or site instead of multiplying distinct SLA templates. This lets command centers run unified SOPs for alerts, escalation, and business continuity plans while still giving HR, Finance, and ESG leads the differentiated metrics they need.
In an RFP, how do we make vendors commit to service-line outcomes instead of giving generic ‘we meet SLAs’ promises?
B0197 RFP structure for mapped outcomes — In India corporate ground transportation sourcing, how should Procurement structure an RFP so that service catalog mapping forces vendors to commit to service-line outcomes (EMS shift routes vs airport trips vs event transport) rather than hiding behind generic “we meet SLAs” language?
Procurement should treat the service catalog as the backbone of the RFP and require vendors to price and commit at the service-line level for each mobility vertical, not at a generic “transport services” level.
The RFP should first define the four core service verticals explicitly as separate lots or sections. These are Employee Mobility Services for shift-aligned routes, Corporate Car Rental Services for intra-city, intercity and airport movements, Project/Event Commute Services for temporary high-volume needs, and Long-Term Rental for 6–36 month dedicated vehicles. Each vertical should have its own scope, KPIs, and commercial model so that vendors must respond with service-specific capabilities, playbooks, and SLAs.
A common failure mode is an RFP that bundles EMS, CRD, ECS, and LTR under a single SLA and rate card. Vendors then default to vague “95% SLA” claims without proving how they handle shift windowing, night safety, airport delay handling, or rapid event fleet ramp-up. Procurement can avoid this by demanding outcome-linked KPIs per vertical, such as OTP% and Trip Adherence Rate for EMS, response-time SLAs for CRD, scale-up timelines for ECS, and uptime targets for LTR.
To make vendors commit, the RFP should ask for a structured response table for each service line. The table should map use cases to operational methods, outcome KPIs, and penalties or earnbacks. The RFP should also require vertical-specific case evidence, such as zero-incident programs for women’s night shifts, EV uptime parity for fixed fleets, or high on-time arrival rates during adverse weather, to separate generic claims from proven execution.
What are the usual HR vs Finance fights when setting EMS KPIs, and how can service catalog mapping reduce the back-and-forth?
B0198 Resolve HR–Finance KPI conflict — In India employee mobility services (EMS), what are the most common conflicts between HR (employee experience and duty of care) and Finance (cost per trip and audit defensibility) when defining service-line KPIs, and how can service catalog mapping reduce the political back-and-forth?
In India employee mobility services, the most common HR–Finance conflict arises when HR optimizes for safety, reliability, and employee experience, while Finance optimizes for cost per trip, cost per km, and audit defensibility. HR pushes for high on-time performance, women-safety overlays, and flexible capacity to avoid escalations, but Finance resists when these choices inflate unit costs, add “exceptions,” or create opaque billing logic.
HR typically wants KPIs centered on commute experience and duty of care. HR focuses on OTP%, safety incidents, women-safety compliance, complaint closure SLAs, and impact on attendance and attrition. Finance typically wants KPIs centered on TCO and traceability. Finance focuses on cost per employee trip, cost per km, dead mileage, utilization, and SLA-to-invoice reconciliation. A frequent failure mode is defining KPIs at a generic “transport” level, which forces every service line to be judged on both maximum EX and minimum cost simultaneously, creating recurring political debates during renewals and audits.
Service catalog mapping reduces this back-and-forth by explicitly segmenting EMS into distinct service lines with different KPI stacks and commercial expectations. A structured catalog separates, for example, standard pooled shifts, women-only or night-shift routes, and premium executive or critical-ops transport, and assigns different reliability, safety, and cost baselines to each. This lets HR justify higher-cost, higher-protection SKUs as policy-driven choices, while Finance benchmarks each SKU on the appropriate economics and audit metrics.
A practical pattern is to define for each catalog item: the target personas and policy entitlements, primary KPIs (EX/safety-heavy vs cost/utilization-heavy), accepted cost envelope and commercial model, and evidence requirements for audit and ESG reporting. Once these mappings are codified and approved, routine decisions move from ad-hoc negotiation to policy execution, and quarterly reviews shift from “who is right, HR or Finance?” to “is each service line hitting its agreed KPI band?”.
For exec car rental, how do we define outcomes like punctuality and vehicle standards so it feels premium but is still enforceable?
B0199 Executive CRD outcomes that enforce — In India corporate car rental (CRD) for executives, how should an Admin or Travel Desk define persona-specific outcomes (punctuality, vehicle standardization, driver behavior, airport delay handling) so the service feels “consistent” without making the SLA impossible to enforce?
In corporate car rental for executives, Admin or Travel Desk should convert “consistent service” into a small set of persona-specific, observable outcomes with clear measurement rules and realistic buffers. These outcomes should be framed as objective behaviors on each trip rather than subjective satisfaction, and they should be tied to data that the operator and client can both see in the booking and trip logs.
Admin or Travel Desk leaders usually care most about predictable arrival times, standard vehicle category, and executive comfort. They can define punctuality as a specific window around scheduled pickup, such as “on-time” being arrival 10–15 minutes before pickup for airports and 5–10 minutes for city trips. They should measure this on GPS and trip timestamps, and they should separate controllable delays from force‑majeure events like sudden road closures.
Executives expect a familiar experience regardless of city or vendor. Admin or Travel Desk can set vehicle standardization as a defined list of acceptable models per segment, with visible checks on age, fitness, and amenities captured through centralized fleet compliance records. They can also require that any substitution stays within the same or higher segment and is pre‑communicated to the executive.
Driver behavior strongly shapes perceived consistency. Admin or Travel Desk should define it through simple, auditable rules like no smoking, appropriate dress code, courteous conduct, and adherence to safe driving norms, with behavior issues recorded via post‑trip feedback in the app and driver compliance logs. A minimum driver rating threshold and a documented training and induction process support these expectations without turning them into vague obligations.
Airport delay handling can be defined as a specific SLA around flight tracking and wait-time logic. For example, the operator must track flights and adjust pickup times for delays, with a defined free waiting period after actual landing. These rules should be reflected in the booking platform and billing so they are enforceable yet fair to both sides.
To avoid making SLAs impossible to enforce, Admin or Travel Desk should focus on a small core set of KPIs that can be directly tied to data: on-time performance, vehicle compliance rate, driver rating, and SLA adherence for airport and intercity trips. They should also include clear exception categories, such as extreme weather or political disruptions, linked to business continuity plans and command center escalation procedures. Balanced penalty and incentive structures based on these KPIs keep the operator focused on consistency without driving gaming behavior or unrealistic promises.
images:
For event/project transport, what KPI mistakes lead to nonstop firefighting, and how do we write ECS outcomes that reduce 3 a.m. escalations?
B0200 ECS KPIs that reduce firefighting — In India project/event commute services (ECS), what outcome definition mistakes cause “time-bound delivery pressure” to turn into constant on-ground firefighting, and how should ECS-specific KPIs be written to protect Operations from 3 a.m. escalations?
In India project and event commute services, “time-bound delivery pressure” turns into constant firefighting when outcomes are defined only as “buses on time” in generic SLAs and not as a combination of OTP, routing, capacity buffers, and control-desk behavior that reflects real ECS conditions. ECS-specific KPIs need to explicitly encode peak-load realities, rapid scale-up/scale-down behavior, exception-closure speeds, and on-ground supervision so that Operations can point to clear thresholds and not absorb endless 3 a.m. blame.
A common failure mode in ECS is copying Employee Mobility Services or Corporate Car Rental KPIs. ECS has rapid fleet mobilization, temporary routing, and zero-tolerance for project delays. If contracts only mention high-level OTP or cost per km, then last-minute headcount swings, weather, or political disruptions create exceptions with no agreed buffer, so every deviation becomes a “failure” for the transport head. Another frequent mistake is ignoring the role of dedicated project/event control desks, which the context identifies as essential for on-ground control and live coordination.
ECS KPIs should separate “normal-conditions performance” from “disruption-handling performance.” They should define what is guaranteed under standard assumptions about demand, route lock-in, and access conditions, and what triggers Business Continuity Plan playbooks and different expectations. Operations protection comes from three KPI groups:
- Reliability KPIs for time-bound movement. These include on-time performance windows for first pickups and last drops, trip adherence rate for temporary routes, and exception-detection-to-closure times during project critical windows.
- Capacity and flexibility KPIs for scale-up/scale-down. These define response time for additional vehicles, maximum allowed variance between forecast and actual volumes before SLAs are recalibrated, and utilization thresholds for temporary routing and crowd movement planning.
- Governance and visibility KPIs for control desks. These cover live coordination metrics like control-desk uptime, escalation matrix adherence, and reporting cadence on deviations during events.
When KPIs for ECS explicitly articulate these reliability, flexibility, and governance dimensions, Operations can manage rapid, high-volume, time-bound programs with clear rules of engagement. This reduces uncontrolled obligation creep and protects on-ground teams from constant, undefined 3 a.m. escalations driven by unrealistic or generic outcome definitions.
For pooled shuttles on campus, what outcomes should we set—seat-fill, wait time, loop adherence—so employees don’t feel it’s a downgrade?
B0201 Fair outcomes for pooled shuttles — In India enterprise employee mobility (EMS), how should a Facility/Transport Head define outcome KPIs for pooled shuttles in campuses or business parks (seat-fill, wait time, adherence to fixed loops) so employees don’t feel “second class” versus point-to-point cabs?
A Facility or Transport Head should define pooled shuttle KPIs so that reliability, access time, and comfort are clearly comparable to point-to-point cabs, then track them with the same command-center rigor used for cabs. Outcome KPIs must focus on on-time performance, wait time at stops, seat availability, and audit-ready safety, because these are the dimensions employees use to judge whether shuttles feel “second class.”
For campus or business-park loops, a central command center and real-time dashboards are essential to monitor shuttle adherence, crowding, and exceptions. Pooled services work best when routing and capacity are optimized up-front, then continuously corrected using live data on boarding patterns, delays, and missed trips. In practice, this means linking scheduling and route design to HRMS rosters and shift windows, and using data-driven insights to rebalance fleet size or frequency before peak periods become a problem.
Outcome KPIs for pooled shuttles should focus on a small set of control-room metrics that translate directly into fewer complaints and fewer 2 a.m. calls:
- Seat-Fill & Capacity. Define a target Trip Fill Ratio for shuttles that balances efficiency and comfort. For example, a range that avoids both under-filled runs and standing loads. Use this to drive dynamic routing, frequency adjustments, and fleet mix decisions.
- Wait Time & Access. Set a maximum scheduled wait time at each stop within defined shift windows. Monitor actual average and 95th percentile wait times, not just timetables. Treat “left behind at stop” incidents as critical exceptions with closure SLAs.
- Loop Adherence & Journey Time. Track Trip Adherence Rate for each loop, including deviation from planned sequence and total journey-time variance versus baseline. Use centralized dashboards similar to “Command Centre” views from the collateral to trigger alerts when loops start slipping.
- On-Time Performance (OTP%). Measure OTP for arrival at campus and for drop back home against shift-reporting times, exactly as for cabs. Link OTP to SLA and penalties so pooled users are not deprioritized.
- Safety & Compliance. Apply the same women-safety, driver-compliance, and SOS controls that exist for cabs. Use geo-fencing, IVMS, and centralized compliance management to ensure pooled routes pass safety audits, especially for early-morning or late-night loops.
- Experience & Escalations. Track a simple Commute Experience Index or user satisfaction score specifically for pooled shuttles. Combine complaint volume, closure time, and “no-show bus” incidents into a regular management report, so issues are visible and fixed, not normalized.
When shuttles share the same NOC, safety tooling, and reporting discipline as cabs, employees experience them as a first-class option rather than a downgrade.
For airport trips, what KPIs should Admin and Finance agree on—arrival buffer, delay handling, no-shows—to reduce disputes and escalations?
B0206 Airport trip KPIs to cut disputes — In India corporate car rental (CRD), what persona-specific KPIs should Finance and Admin agree on for airport trips (driver arrival buffer, flight-delay handling, no-show rules) to reduce billing disputes and traveler escalations?
For airport CRD in India, Finance and Admin reduce disputes fastest when they jointly fix a small, explicit KPI set around three areas: driver arrival buffer, flight‑delay handling, and no‑show rules. Each KPI must be defined in time or money terms and tied to billing logic and escalation SOPs.
For driver arrival, most organizations standardize an on‑time performance KPI linked to a buffer window. Admin typically defines a required reporting buffer before scheduled pickup or scheduled landing, and the vendor commits to an OTP% target against that buffer. Finance links this directly to penalties or non‑billable trips when the vendor misses the agreed buffer, which reduces arguments later. The same OTP% can sit on the mobility dashboard and the CRD billing reports so Admin sees reliability and Finance sees contract enforcement.
For flight delays, Finance and Admin usually agree on a free‑wait band and a paid‑wait band. Admin defines what counts as a “flight‑linked” trip and how long the driver must wait at no additional charge when flight status shows delays. Finance then hard‑codes what happens after that band, such as moving to per‑hour or per‑km waiting charges and whether an additional trip can be billed if the delay crosses a threshold. This alignment turns real‑time delay handling into a predictable commercial rule instead of a case‑by‑case negotiation.
For no‑shows, the two functions benefit from defining clear evidence requirements and a standard charge formula. Admin specifies how long the driver must wait at the pickup point, what proof is needed (GPS tag, timestamped photo, app log), and when transport or travel desk must attempt contact. Finance then agrees what percentage of the base fare can be billed as a no‑show fee when those conditions are met, and when the trip must be fully written off if protocols are not followed. This reduces traveler escalations because employees see consistent treatment and a visible SOP rather than arbitrary charges.
Key persona‑specific KPIs that Finance and Admin can align on for airport CRD include:
- On‑Time Performance for airport pickups and airport drops, measured against a defined reporting buffer.
- Average and maximum free waiting time by trip type, with explicit post‑buffer charge rules.
- No‑show rate and percentage of no‑show charges reversed because SOPs were not followed.
- Dispute rate per 100 airport trips, with a target reduction over time tied to cleaner rules.
- Invoice–trip log match rate, ensuring that billed wait time and no‑shows match system records.
When these KPIs are written into CRD contracts and mirrored in the billing engine and dashboards, Finance gains clean, auditable numbers and Admin gains predictable service behavior and fewer late‑night escalations.
How do we lock down KPI definitions (OTP/OTD, cancellations, no-shows, exceptions) across EMS and CRD so we stop arguing about numbers monthly?
B0211 Standardize KPI definitions across lines — In India corporate mobility, how should a vendor and buyer agree on definitions for core KPIs (on-time pickup, on-time drop, cancellation, “no-show,” exception) across EMS and CRD so different departments don’t argue over numbers every month?
In India corporate mobility, vendors and buyers avoid monthly KPI disputes by defining each KPI in a joint “measurement charter” that is service-specific (EMS vs CRD), operationally realistic, and contractually frozen before go-live. Each KPI needs a precise event definition, a clear time window, explicit inclusions and exclusions, and one agreed data source logged by the platform or command center.
A common failure mode is when HR, Transport, and Finance each use different clocks, buffers, and exception rules for the same term. Another failure mode is when “on-time” and “no-show” definitions live only in emails or presentations, not in the contract and SOPs. Most organizations get stability only when KPI semantics are documented as part of the SLA schedule and mirrored in routing, apps, and billing logic.
For EMS, on-time pickup is usually linked to a shift window at the first boarding point, while on-time drop is tied to reaching the workplace before a defined buffer ahead of shift start. For CRD, on-time pickup is typically measured against a confirmed booking time at the employee’s chosen location, and on-time drop is anchored to airport check-in or meeting start requirements.
Practical design steps include: - Define KPI timestamps at trip-lifecycle events such as “driver reached,” “employee boarded,” “trip start,” and “trip end”. - Fix pickup and drop buffers distinctly for EMS and CRD, and record them in the SLA annexure. - Specify what counts as cancellation, what counts as “no-show,” and which cases are tagged as “exceptions” that are excluded from OTP and penalty calculations. - Make the command center or platform the single source of truth, and align HRMS integration and billing reports to those same definitions.
What signs show we’re optimizing exec KPIs while shift populations suffer, and how do we make that trade-off visible in the mapping?
B0213 Detect exec bias in KPIs — In India enterprise-managed employee transport (EMS), what are the warning signs that persona-specific KPIs for executives are being optimized at the expense of large shift populations, and how should the service catalog mapping make that trade-off visible?
In India enterprise-managed employee transport, a system is over-optimizing for executives at the expense of large shift populations when executive KPIs improve while core EMS reliability, safety, and cost KPIs for shift workers stagnate or deteriorate. The service catalog and KPI map should make this visible by clearly separating EMS and CRD services, attaching distinct KPI sets and budget allocations, and showing when improvements in executive-trip metrics correlate with degradation in shift mobility outcomes.
One warning sign is when executive corporate car rental (CRD) metrics like response time, vehicle class availability, and airport SLA adherence trend up, while employee mobility services (EMS) KPIs like on-time performance (OTP%), trip adherence rate, and no-show handling for shift commutes flatline or worsen. Another sign is dead mileage and fleet utilization skewing toward daytime CRD use while night-shift EMS routes suffer low seat-fill, under-provisioned backup capacity, or frequent last-minute vendor substitutions.
A second warning sign is safety and compliance attention drifting toward VIP or senior-travel use cases while women-first night-shift routing, escort compliance, and SOS readiness for bulk shift routes are treated as static “policy” items rather than continuously audited metrics. This gap often appears when incident response SLAs and geofencing controls are tightly enforced on executive trips but random route audits and HSSE compliance for pooled EMS routes lack audit frequency or clear ownership.
A third warning sign is cost and commercial models privileging CRD optics over EMS robustness. This happens when cost per kilometer for executives is continuously optimized and reported to Finance, but cost per employee trip and dead-mile caps for large shifts are not governed with the same discipline. It also appears when buffer vehicles and business continuity capacity are cut from EMS to fund incremental executive fleet comfort, leading to rising exception-closure times in shift hours.
Service catalog mapping should therefore present EMS, CRD, ECS, and LTR as distinct service lines with explicitly different buyer personas and KPIs. EMS entries should be tied to OTP%, seat-fill, dead mileage, incident rate, women-safety compliance scores, and command center observability during shift windows. CRD entries should instead highlight executive response times, airport linkage, and vehicle-standard KPIs, making it obvious if investment is being directed disproportionately toward CRD compared to EMS.
The catalog should also encode which spending lines and contracts serve which populations. It should show, for example, that a given fleet segment or routing engine capacity is reserved for shift-based EMS, not implicitly shared with CRD during peak hours. This mapping prevents silent cannibalization of EMS capacity by executive on-demand use and surfaces when on-time performance degradation for shifts coincides with new executive entitlements.
Finally, the mapping should roll up KPIs by persona: CHRO-facing dashboards focused on commute experience index, safety, and attendance for large workforce segments, CFO-facing views combining CET/CPK across EMS and CRD, and Transport-head views that plot fleet utilization index by service vertical. When these persona views are aligned but clearly segmented, any trade-off that benefits one persona’s KPIs while eroding another’s becomes immediately visible and can be governed rather than hidden inside a blended mobility score.
How can we use service catalog mapping to clarify ownership between vendor, NOC, site admin, and HR so incidents don’t turn into blame games?
B0215 Clarify ownership to prevent blame — In India corporate mobility operations, how can an Operations head use service catalog mapping to create a clear “who owns what” model between vendor, NOC, site admin, and HR—so incidents don’t devolve into blame-shifting?
In Indian corporate mobility operations, an Operations head can use a service catalog to pre-define “who owns what” for each transport service, mapping every activity and incident type to a single accountable owner across vendor, NOC, site admin, and HR. A clear, signed-off catalog prevents 2 a.m. blame-shifting because it ties each step in the ETS/CRD/ECS/LTR operation cycle to roles, SLAs, and evidence, not to ad-hoc judgments.
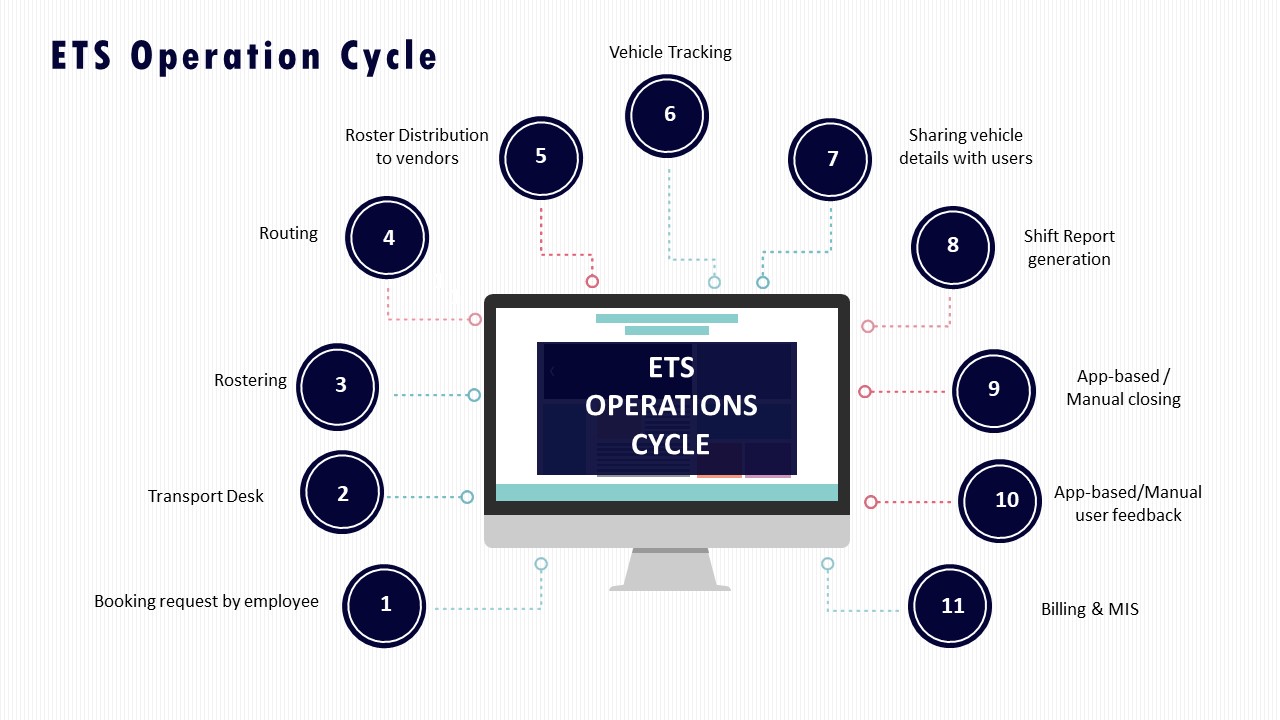
The starting point is to list the concrete services actually run on the ground. Examples include shift-based Employee Mobility Services, on-demand Corporate Car Rental, project/event commute, and long-term rental vehicles. For each service, the Operations head defines a process view similar to the ETS Operation Cycle or Vehicle Deployment & Quality Assurance flows, then breaks it into discrete steps such as roster creation, routing, trip dispatch, driver and vehicle compliance checks, live tracking, SOS handling, incident reporting, billing, and MIS.
Each step then gets a single RACI-style ownership line with explicit role tags. The vendor may own fleet availability, driver induction and compliance, and first-level trip execution. The centralized NOC or Transport Command Centre may own real-time monitoring, alert supervision, SLA tracking, and escalation handling. The site admin may own local coordination such as access gate issues and floor communication. HR may own policy, employee eligibility, grievance closure, and women-safety governance. Safety and compliance dashboards, command-center workflows, and alert systems like SOS or geofence violations become the evidence layer that supports these ownership lines.
The Operations head then links incident types directly to this catalog. For example, “driver no-show,” “vehicle non-compliance,” “late pickup beyond SLA,” “escort missing on night route,” “app/GPS failure,” or “safety SOS triggered” each get a primary owner, a backup owner, a response SLA, and the system of record that proves closure. Business continuity and contingency playbooks, escalation matrices, and TCC roles and responsibilities are attached as annexures to the same catalog so everyone knows who leads when there is a cab shortage, political disruption, or tech outage.
To keep this from becoming a paper exercise, the catalog is mirrored in tools. The NOC dashboard, alert supervision system, and command-centre workflows should route tickets and alerts to the owner defined in the catalog. Centralized compliance management and data-driven insights dashboards provide shared visibility so HR and site admins see the same OTP, incident, and safety numbers that vendors and Operations see. Quarterly governance reviews then use these catalog-linked KPIs and incident logs, rather than emails, to resolve disputes and refine responsibilities.
- Define services and process steps clearly and map each step to a single accountable role.
- Attach incident types, escalation paths, and SLAs to those roles with supporting tools and dashboards.
- Use governance reviews and BCP scenarios to adjust the catalog, keeping it aligned with real on-ground behavior.
How do we decide which outcomes should go into the service catalog and which should stay internal metrics, so vendors don’t game it and teams don’t get overloaded?
B0217 Choose KPIs to expose vs internal — In India corporate car rental (CRD) and employee mobility (EMS), how should a buyer decide which outcomes belong in the service catalog mapping versus which should remain as internal operational metrics, to avoid vendor gaming and cognitive overload?
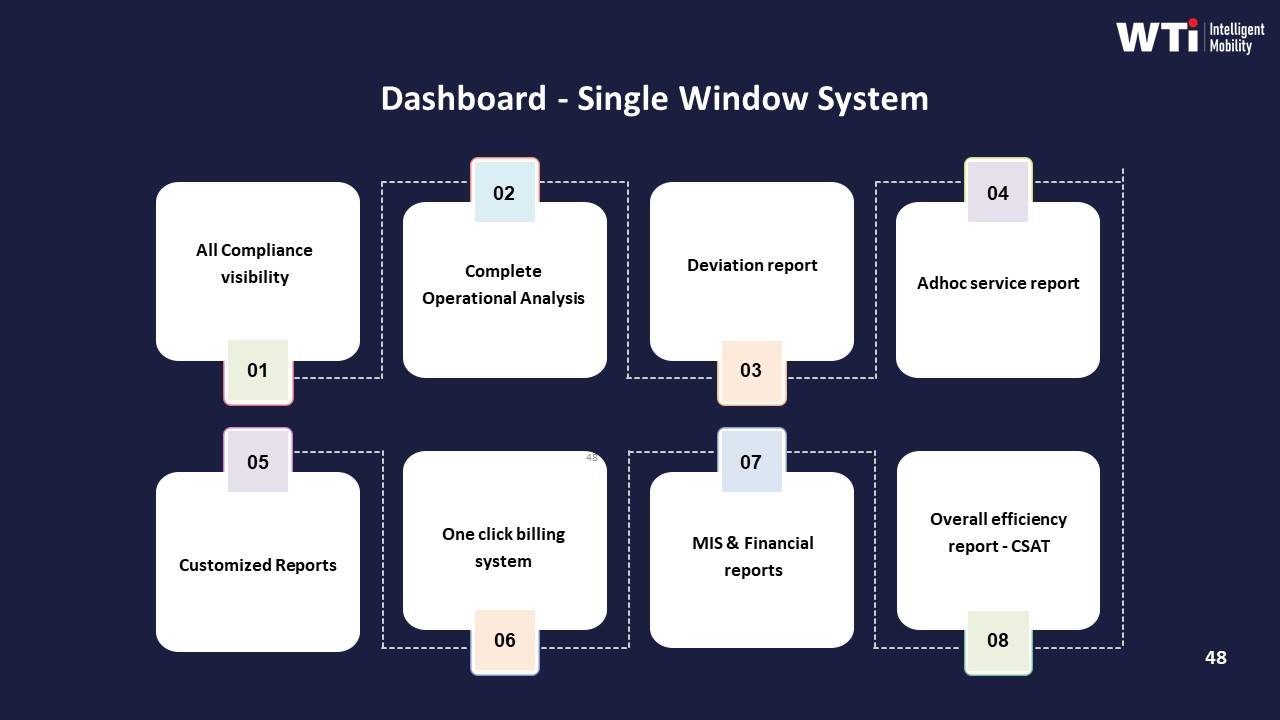
In corporate car rental (CRD) and employee mobility (EMS) in India, outcomes that are employee‑visible, cross‑functional, and easy to audit should sit in the service catalog, while granular efficiency and tuning metrics should stay as internal operational KPIs. Service catalog items must describe what the business and employees can reliably expect from vendors, and internal metrics must describe how the transport and command‑center teams achieve those expectations without inviting vendor gaming or confusion.
Service catalog mapping works best when it focuses on a small set of “contract and experience” outcomes. These typically include on‑time performance for pickups and drops, safety and incident‑response guarantees, guaranteed availability windows for vehicles or routes, basic cost structures for key service types, and minimum compliance baselines for drivers, vehicles, and women‑safety protocols. These outcomes cut across HR, Finance, Security/EHS, and Facilities, so they are understandable outside Transport and are traceable in audits and in SLA governance.
Operational metrics work better as internal levers when they are highly technical, optimization‑oriented, or easy to game if monetized directly. These include routing efficiency ratios, dead mileage caps on individual routes, fine‑grained vehicle utilization indices by timeband, micro‑level driver fatigue scores, and model‑specific EV telemetry such as battery SoC thresholds and charger dwell times. These are ideal for command‑center dashboards, vendor performance reviews, and continuous improvement sprints, but they should not all be written into the front‑facing service catalog.
A practical way to decide placement is to apply three screens to every proposed metric before putting it in the catalog: • Is this outcome clearly observable and meaningful to non‑specialists like HR or employees? • Can this outcome be reliably measured and audited with existing data and tools? • If money is tied directly to this metric, does it encourage good behavior or create perverse incentives?
If the answer is “no” on clarity or auditability, or “yes, it could create bad incentives,” the metric should remain internal. If the metric defines the service promise and can survive audit scrutiny, it belongs in the catalog.
images:
How do we test in the first 30–60 days if service catalog mapping is reducing escalations and manual coordination—not just improving reports?
B0219 Prove mapping reduces operational drag — In India employee mobility services (EMS), how can a Transport Head test whether service catalog mapping is actually reducing escalations and manual coordination effort over 30–60 days, rather than just producing cleaner reports?
In India EMS operations, a Transport Head can test whether service catalog mapping is genuinely reducing escalations and manual coordination by tracking a small set of operational KPIs and “control-room load” metrics for 30–60 days before and after the new catalog goes live. The test works only if it measures real shift behaviour such as escalation volume, manual overrides, and roster exceptions rather than just cleaner dashboards or reports.
A practical approach is to select 2–3 representative sites or shifts and run a time-bound experiment. The Transport Head can freeze major variables such as fleet size, vendor mix, and shift windows during the test period to avoid confounding factors. The core comparison should be between a “pre-mapping” baseline and a “post-mapping” phase where each entitlement, route type, and SLA is explicitly linked to a catalog item in the EMS platform and visible in the command center.
Key signals to track daily in the command center or NOC include the number of transport-related escalations, the count of manual roster edits and ad-hoc cab requests, and the volume of calls or chat contacts per 100 trips. Additional signals such as the number of trips needing manual routing overrides, driver reassignment after dispatch, or last-minute vehicle substitutions indicate residual fragmentation despite catalog mapping. A sustained downward trend in these metrics, with stable or improved on-time performance and safety compliance, is a strong indicator that service catalog mapping is reducing firefighting rather than just improving reporting hygiene.
To keep the test grounded in on-ground reality, the Transport Head can run brief daily huddles with dispatchers and supervisors similar to the “Daily Shift Wise Briefing” approach described in the collateral. A simple checklist can capture whether fewer edge cases require supervisor intervention, whether SOPs are clearer for night shifts and women employees, and whether driver confusion about trip type or entitlement is declining. This qualitative feedback should be cross-checked with data from command-center dashboards, alert systems, and any SOS or incident logs used for women-safety and HSSE compliance.
A focused 30–60 day test window is usually sufficient to identify whether the mapped catalog is aligned with real EMS patterns. If escalation and manual coordination metrics do not improve despite cleaner dashboards, it typically indicates gaps such as misaligned entitlements, missing catalog items for project or hybrid-work use cases, or routing rules that do not reflect actual traffic and shift behaviour. In such cases, the Transport Head can use incident and exception data from the period as an input for refining the catalog and associated SOPs, rather than concluding that the underlying technology is ineffective.
images:
If we have multiple vendors by city/service line, how do we design service catalog mapping so KPI comparisons are fair and don’t become ‘local conditions’ arguments?
B0220 Fair KPI comparisons across vendors — In India corporate mobility, when multiple vendors serve different cities or service lines (EMS vs CRD), how should Procurement and Operations design service catalog mapping so cross-vendor KPI comparisons are fair and don’t trigger endless disputes about “local conditions”?
In multi-vendor Indian corporate mobility, Procurement and Operations should define a normalized, company-wide service catalog with standard service definitions, context tags, and KPI formulas, then let “local conditions” vary only through pre-agreed parameters and not through ad-hoc excuses. Service catalog mapping must separate what is comparable across vendors from what is structurally different by design.
A stable catalog starts with clear verticals such as Employee Mobility Services, Corporate Car Rental, and Project/Event Commute Services. Each vertical should have named service types like night-shift shared cab, executive airport transfer, or project shuttle with fixed, written inclusions and exclusions. Procurement then maps every vendor product SKUs into these internal service types, not the other way around.
Cross-vendor KPI comparisons work best when metrics use common formulas and unit definitions. OTP, cost per km, cost per employee trip, trip adherence rate, and trip fill ratio should be computed identically from a unified trip ledger. Operations should enforce consistent capture of timestamps, distances, and roster data across all vendors through a command-center or mobility data lake.
Disputes about “local conditions” reduce when context is encoded as explicit tags. City grade, timeband, shift window, route risk category, EV vs ICE, and project vs BAU should be captured as attributes on every trip. Benchmarks are then sliced by these tags, for example comparing all tier-1, night EMS routes across vendors, instead of city-wide averages.
To avoid endless argument cycles, Procurement should pre-define KPI bands and tolerance ranges per service archetype and context tag combination. Vendor evaluations then compare vendors against those bands and against peers operating under the same tags, rather than against a single global “average” that hides mix differences.
A practical pattern is to design three layers of KPI use:
- Base layer of non-negotiable metrics that always compare across all vendors, like audit trail integrity or credentialing currency.
- Context-normalized layer that only compares vendors within the same context slice such as tier, timeband, and service type.
- Vendor-specific improvement layer where each vendor carries its own targeted actions based on baseline and trend within its portfolio.
Fairness also depends on clean commercial mapping. Procurement should keep EMS, CRD, and ECS in separate catalog lines and avoid mixing per-km and per-seat models when comparing TCO. Where models differ, normalize to cost per employee trip under agreed load factors and dead-mile caps.
Centralized governance then ties these elements together. A command-center style operating model with standardized reports, an escalation matrix, and quarterly business reviews lets Procurement, HR, and Transport review the same single-window dashboards rather than vendor-curated views.
images:
If Finance wants strict cost KPIs but Ops needs buffers for peaks and night safety, how do we use service catalog mapping to agree on the trade-off?
B0224 Make cost vs resilience explicit — In India corporate mobility, what should a buyer do when Finance demands strict cost KPIs while Operations insists on buffers for peak shifts and night safety—how can service catalog mapping make the “cost vs resilience” trade-off explicit and agreed?
In Indian corporate mobility, buyers should use a clearly structured service catalog to separate “baseline commute” from “resilience layers” so that cost KPIs apply tightly to core services, and explicit premiums apply to buffers, peak handling, and night safety. Service catalog mapping works when each service type has defined inclusions, KPIs, and pricing logic that Finance can model and Operations can rely on for OTP and safety.
A practical approach is to first segment services by verticals such as Employee Mobility Services, Corporate Car Rental, Project/Event Commute, and Long-Term Rental. Each vertical should then be decomposed into standard SKUs like base shifts, peak overlays, escort requirements, night-band operations, standby vehicles, and incident-ready command-center coverage. Operations can then tag which SKUs are mandatory for specific sites, timebands, and personas, while Finance can see which elements are optional, variable, or outcome-linked.
A common failure mode is when buffers like standby cabs, extra night routing rules, and safety escorts are buried inside “all-inclusive” contracts. This obscures true unit economics and drives recurring disputes between cost-containment and reliability needs. Service catalog mapping avoids this by assigning separate KPIs to each layer such as OTP% and Trip Adherence for base services, seat-fill and dead mileage caps for optimization, and incident-response SLAs for resilience.
Buyers can then align commercials by linking payouts for baseline SKUs to strict cost per kilometer and cost per employee trip thresholds while attaching explicit premiums for agreed resilience SKUs that protect night-shift women safety compliance and business continuity. Quarterly reviews can track which SKUs were actually consumed and reconcile them against On-Time Performance, incident rates, and escalation volumes, making the “cost vs resilience” trade-off visible, auditable, and renegotiable instead of emotional.
images:
For our mobility program, how do we split EMS, airport/intercity, and event/project transport into a clear service catalog so we’re not forcing one KPI model on everything?
B0227 Define service lines without confusion — In India corporate ground transportation programs, how should an enterprise map a service catalog across Employee Mobility Services (shift-based commute), Corporate Car Rental (airport/intercity), and Project/Event Commute so stakeholders stop arguing about “one KPI set,” and each service line has outcome definitions that reflect its real operational constraints?
In corporate ground transportation, enterprises should define a separate service catalog and KPI set for Employee Mobility Services, Corporate Car Rental, and Project/Event Commute, and then align them under one governance view instead of forcing “one KPI to rule all.” Each service line needs its own outcome definitions tied to its operational reality, while a thin common layer only tracks shared themes like reliability, safety, cost, and ESG.
For Employee Mobility Services, outcome definitions work best when centered on shift adherence and safety. Operational constraints include pooled routing, hybrid-work volatility, and night-shift obligations. Strong EMS catalogs specify entitlements by persona, shift-windowing rules, guard/escort conditions, women-first routing, and NOC monitoring expectations. EMS KPIs should prioritize on-time performance to shift start, trip adherence rate, seat-fill, incident rate, and closure SLAs, because missed shifts and safety failures are the dominant risks.
For Corporate Car Rental, outcome definitions should emphasize response time, executive experience, and billing accuracy. Operational constraints include airport-linked timing, point-to-point trips, and high expectation on vehicle standardization. CRD catalogs define service types (airport, intra-city, intercity), SLA-bound response times, vehicle classes, and approval workflows. KPIs should focus on SLA adherence for dispatch and pickup, vehicle quality compliance, cost per km, and invoice accuracy, because Finance and Travel Desks care about predictability and auditability more than pooled-efficiency metrics.
For Project/Event Commute, outcome definitions must be anchored in time-bound execution certainty and surge handling. Operational constraints are rapid scale-up/scale-down, temporary routing, and crowd movement at fixed timebands. ECS catalogs should define project duration, fleet ramp-up timelines, control-desk responsibilities, and peak-load handling rules. KPIs should track day-0 readiness, adherence to event schedules, exception latency during peaks, and ramp-down efficiency, since delay tolerance is near zero.
A practical way to stop cross-stakeholder argument is to publish a service catalog where each line item lists its scope, operational constraints, primary buyer, and 4–6 core KPIs. HR and Transport Heads can then judge EMS on shift reliability and safety outcomes. Finance and Procurement can evaluate CRD on cost and billing control. Projects and Operations can rate ECS on execution certainty. A light, cross-cutting dashboard can still report a few common indicators such as overall on-time performance, incident rate, and cost per employee trip, but governance discussions should reference the service-specific KPI blocks first, so expectations remain realistic and blame is not driven by the wrong benchmark.
In our shift commute setup, what signs tell us our EMS service definitions/KPIs are mis-mapped and that’s why issues keep escalating even when vendors say they met SLAs?
B0228 Spot mis-mapped EMS outcomes — In India Employee Mobility Services (EMS) for shift-based employee transport, what are the early warning signs that the organization’s service catalog mapping is wrong—so on-time performance issues get blamed on the wrong team and escalations keep happening despite “meeting SLAs” on paper?
In Indian Employee Mobility Services for shift-based transport, the clearest early warning sign of wrong service-catalog mapping is when on-time performance complaints keep rising even though vendors and internal teams can show “green” SLA dashboards for their own scope. This misalignment creates a pattern where each function claims compliance, but shift adherence, employee experience, and escalation volume keep worsening.
A common signal is persistent confusion over which service vertical is supposed to handle a given use case. For example, airport-style Corporate Car Rental logic may be used for predictable shift-based Employee Mobility needs, or short-term Project/Event Commute models may be used for what has effectively become a long-term route. This misclassification results in wrong routing rules, wrong buffers, and wrong capacity assumptions, so OPS believes it has “served the request” while HR and business teams see repeated late logins.
Another early indicator is when transport teams experience chronic last-minute changes and manual overrides around the same patterns of demand. This usually means the underlying catalog does not reflect current hybrid-work realities, seat-fill expectations, or peak/non-peak windows for the site. In those cases, command center and routing teams keep firefighting exceptions that could have been avoided with correct catalog definitions and shift-windowing rules.
Frequent cross-functional disputes about “who owns” recurring problem trips are also a strong sign. When HR, Finance, and Transport each interpret a trip as belonging to different catalog buckets, cost models, and SLA definitions, then accountability fragments. In practice, this shows up as repeated escalations on the same corridors or timebands, while billing, routing, and vendor governance each sit on different assumptions.
Another pattern is when cost per employee trip appears acceptable at an aggregate level, but certain cohorts or routes repeatedly miss OTP despite similar spend. This disparity suggests that the service catalog has not differentiated correctly between EMS, CRD, ECS, and Long-Term Rental scenarios, leading to the wrong commercial and operating model for those cohorts. The result is that Finance sees “reasonable CPK/CET” on paper, while operations know specific shifts are structurally under-served.
Finally, if escalation narratives from employees and managers consistently describe the commute as unpredictable, while dashboards and MIS from vendors highlight “SLA met,” the catalog is likely masking the real risk exposure. In mature EMS programs, catalog mapping is tightly tied to shift patterns, women-safety requirements, EV versus ICE suitability, and route-criticality. When these mappings are off, incidents and late arrivals cluster in ways that look like “bad operations,” but the real failure is upstream in how the services were defined and assigned.
As Finance, how do we make sure KPIs for EMS vs airport/intercity vs events/LTR actually tie to billing and audit evidence, not just reports?
B0230 Make KPIs invoice-auditable — In India corporate ground transportation, what’s a practical way for a CFO to verify that each service line in the mobility service catalog (EMS vs airport/intercity vs events vs long-term rental) has KPIs that can be tied to invoice logic and audit trails, rather than being “nice dashboards” that can’t survive finance reconciliation?
A CFO can verify KPI-to-invoice integrity by insisting that each mobility service line runs on a single, auditable trip ledger where every invoice line item is mathematically reconstructible from operational events, documented rules, and preserved evidence. The CFO should approve the service catalog only when Employee Mobility (EMS), airport/intercity (CRD), events/projects (ECS), and long-term rental (LTR) each have clearly defined KPIs, pricing formulas, and log records that reconcile end‑to‑end.
For Employee Mobility Services, finance teams should see trip-level records for every rostered shift. Each record should show route, seat-fill, distance, time, and vendor, with On‑Time Performance (OTP), Trip Adherence Rate, and seat utilization traced directly to the same data used for billing per km, per trip, or per seat. If the KPI changes (for example, OTP-linked penalties), the commercial rule should be versioned and stored alongside the trip ledger.
For airport, intercity, and ad‑hoc rentals, invoices should be generated from a centralized booking system, not emailed duty slips. Each booking should carry customer approvals, timestamps, vehicle class, SLA response times, and distance, with SLA adherence and response-time KPIs derived from the same timestamps. Finance should be able to sample any invoice line and retrieve the underlying trip log, GPS trace, and approval trail.
For events and project shuttles, the CFO should require a dedicated project code with a time-bound route and schedule library. Each movement should post automatically into that project ledger with headcount, schedule compliance, and exception logs. Event KPIs like zero-delay starts or volume moved per hour must aggregate cleanly from that same ledger so that day-wise or phase-wise invoices can be replayed during audits.
For long‑term rentals, the CFO should insist on a separate uptime and utilization register. Each fixed-fee vehicle should have assigned IDs, contract tenure, uptime SLAs, and preventive maintenance logs. Any variable top‑ups, penalties, or downtime credits should be computed by reference to this register, so that CET, cost per vehicle, and uptime ratios can be re‑derived during reconciliation.
A practical verification approach for a CFO usually includes:
- Demanding a unified data schema where trip IDs, vehicle IDs, and employee IDs are consistent across EMS, CRD, ECS, and LTR.
- Requiring that every KPI reported in dashboards (OTP, cost per km, EV utilization) uses the same underlying measures that drive billing and penalties.
- Running periodic sample audits where Finance picks random invoice lines and reconstructs them from raw trip logs, GPS or telematics exports, and approval workflows.
- Making KPI and pricing rules part of the signed contract and insisting that changes go through controlled versioning so audits can track which rule applied when.
If any dashboard metric cannot be reproduced from the trip ledger and commercial rules, or if different data sources are used for billing and reporting, a CFO should treat those KPIs as non‑authoritative for reconciliation or audit defense.
For pooled shuttles on a campus/park, how do we define success so we capture adoption and employee experience, not only cost per seat?
B0234 Define pooled shuttle success — In India corporate pooled shuttles for campuses or business parks, how do facilities and HR define “pooled shuttle success” in the service catalog mapping when employee perceptions (crowding, predictability, boarding discipline) drive adoption as much as cost per seat?
In Indian corporate pooled shuttles, facilities and HR usually define “success” as a balance of four equal dimensions in the service catalog. These dimensions are operational reliability, employee experience, safety/compliance, and cost per seat. Cost per seat matters, but adoption depends just as much on how predictable, safe, and comfortable the pooled experience feels to employees.
Facilities teams focus on operational reliability and load-factor economics. They look at on-time performance for each shift window, seat-fill versus dead mileage, and how well routing and capacity buffers absorb hybrid-work variability. They monitor exception latency from first alert to resolution through a command center or NOC rather than just counting total incidents. This view treats shuttles as a governed EMS service with defined SLAs, not just a cheap bus.
HR teams anchor their definition of success in employee experience, safety, and reputation. They track commute-linked attendance stability, complaint volume and closure SLAs, and specific women-safety controls such as escort rules, SOS readiness, and audit trails. HR links shuttle satisfaction and perceived crowding or boarding discipline back to retention, diversity goals, and employer brand, so a low-cost but visibly chaotic shuttle is treated as a failure.
In catalog mapping, this usually translates into a small set of headline KPIs that sit alongside CPK or cost per seat, rather than beneath it. Those KPIs typically cover on-time performance and trip adherence, seat-fill and crowding thresholds by route, incident and safety metrics, and a commute experience or satisfaction index derived from feedback and grievance closure.
For long-term rentals, what outcomes should we track separately so uptime and maintenance aren’t evaluated like daily EMS or airport trips?
B0235 Separate LTR outcomes clearly — In India corporate Long-Term Rental (LTR) fleets for leadership, sales, or plant operations, what outcomes should Procurement map separately from on-demand trips so uptime, replacement planning, and maintenance discipline don’t get judged by the same metrics used for EMS or CRD?
In India corporate Long-Term Rental (LTR) fleets, Procurement should track asset-level continuity and lifecycle outcomes separately from trip-level performance so LTR does not get misjudged against EMS or CRD metrics. LTR success is defined by assured availability, predictable cost, and disciplined maintenance over months and years, not by daily routing or trip-response SLAs.
Procurement should avoid over-weighting OTP%, trip fill ratio, or dispatch response time for LTR vehicles because these are EMS/CRD metrics tied to dynamic routing and pooled usage. LTR vehicles for leadership, sales, or plant roles usually serve dedicated users and fixed duty cycles, so the critical outcomes sit around uptime, continuity of allocation, and lifecycle governance instead of per-trip efficiency.
The most important LTR-specific outcome buckets are:
- Fleet uptime and continuity for each assigned vehicle.
- Replacement and downtime planning that protects business continuity.
- Preventive maintenance discipline and compliance currency over the contract tenure.
- Cost predictability at a monthly or lifecycle level rather than per-trip economics.
For uptime and continuity, Procurement should map a vehicle-level uptime ratio, maximum allowable downtime per month, and SLA for providing a like-for-like replacement during planned and unplanned off-road events. These outcomes should be reported by asset and user group instead of being aggregated into pooled-fleet OTP dashboards used for EMS.
For replacement planning, Procurement should define explicit thresholds for age, mileage, and breakdown frequency that trigger pre-agreed replacement or fleet refresh actions. These thresholds should be contracted as part of LTR lifecycle governance rather than handled as ad-hoc “incident fixes” the way missed EMS or CRD trips are handled.
For maintenance discipline, Procurement should track preventive-maintenance adherence, closure of manufacturer-recommended services, and audit-ready records of fitness, permits, and inspections. These indicators should feed a compliance view for LTR that is asset-tenure based, not trip-count based.
For financial outcomes, Procurement should map cost per vehicle per month, total cost of ownership over the lease term, and predictability of charges versus the contracted schedule. These outcomes are distinct from cost-per-kilometer or cost-per-trip benchmarks used for pooled EMS or on-demand CRD, which focus on routing efficiency and dead mileage reduction.
For EV-based LTR fleets, Procurement should also map EV utilization ratio, charging reliability for the assigned duty cycle, and emission intensity per vehicle, treating these as ESG and ESG-disclosure outcomes rather than blending them into generic EMS emission dashboards.
Which outcome definitions should we avoid because vendors can game them—like OTP that doesn’t account for early arrivals, missed boardings, or route deviations?
B0249 Avoid gameable outcome definitions — In India corporate mobility vendor governance, what outcome definitions should be explicitly excluded from the service catalog mapping because they are too easy to manipulate (for example, OTP definitions that ignore early arrivals, missed boards, or route deviations)?
In corporate mobility vendor governance in India, outcome definitions that are easy to manipulate are those that ignore the full trip lifecycle, exclude key failure modes, or cannot be independently verified from auditable data. These outcome definitions should be explicitly excluded from the service catalog and SLA mapping because they create a false sense of performance and weaken vendor governance.
Outcome definitions that should be avoided are those that treat reliability as a narrow timestamp metric. If an On-Time Performance (OTP) definition only checks “vehicle reached geofence before scheduled time” but ignores early arrivals, missed boards, and route deviations, then vendors can game OTP through early show-ups and incomplete trips. In practice, reliability must be tied to Trip Adherence Rate, exception detection-to-closure time, and route adherence audits instead of a single arrival timestamp.
Any safety metric that does not use trip-level incident logs, SOS activations, and credentialing currency should be excluded from outcome-based contracts. A safety KPI that only counts “reported incidents” without auditing under-reporting, escort rules, or night-shift compliance makes it easy for operators to suppress data rather than improve behavior. Safety outcomes must be based on continuous assurance, audit trail integrity, and chain-of-custody for GPS and trip logs.
Cost and utilization outcomes are also vulnerable to manipulation when they use partial baselines. Cost per kilometer figures that ignore dead mileage, no-shows, or empty repositioning encourage vendors to shift costs off the visible ledger. Utilization metrics that do not account for seat-fill, Trip Fill Ratio, and dead-mile caps can be inflated through unnecessary deployments. These metrics should be replaced with integrated measures like cost per employee trip, Vehicle Utilization Index, and idle emission loss that cover the entire duty cycle.
ESG or EV outcomes that only count “number of EVs deployed” or “EV trips booked” without using verifiable emission intensity per trip or gCO₂/pax-km should not be accepted. Vendors can park EVs on low-mileage routes or cherry-pick low-utilization deployments to claim green credentials. EV utilization and carbon abatement must be computed from raw telematics, charging data, and reconciled trip ledgers so that carbon abatement indexes and fleet electrification roadmaps are defensible.
Finally, any experience metric that depends solely on optional or vendor-run surveys is weak as a contractual outcome. A Commute Experience Index or NPS that is not linked to adoption, complaint closure SLAs, and exception closure times can be massaged through sampling bias. Experience outcomes should instead be anchored in HRMS-linked attendance deltas, no-show rates, and grievance redressal SLAs.
For shift EMS, how do we set outcomes around driver availability and fatigue so pushing reliability doesn’t lead to burnout and safety problems later?
B0250 Map outcomes to driver fatigue — In India shift-based Employee Mobility Services, how should a transport head map outcomes for driver availability and fatigue risk so reliability targets don’t quietly cause burnout, attrition, and eventually worse safety incidents?
In Indian shift-based employee mobility, a transport head needs to treat driver availability and fatigue as explicit, measured outcomes alongside OTP, not as invisible inputs to “hit targets at any cost.” Driver duty cycles, rest windows, and fatigue indicators should sit on the same dashboard as on-time performance, incident rate, and fleet uptime so reliability improvements never come from silent overuse of the same drivers.
The first discipline is to define hard guardrails for driver utilization. Each driver should have a maximum number of hours per day and per week, with duty cycles aligned to labor and OSH norms, and these limits should be enforced by the rostering and routing system. Any route or shift plan that requires breaches should be flagged as a planning failure, not “driver flexibility.”
The second discipline is to monitor leading indicators of fatigue as operational KPIs. Repeated night shifts for the same driver, frequent last-minute extensions, growing dead mileage before or after duty, and an increased Driver Attrition Rate are all signals of stress that should trigger early intervention. These indicators should be reviewed in the same rhythm as OTP% and Trip Adherence Rate.
The third discipline is to explicitly separate “coverage” from “stretch.” Buffer vehicles and standby drivers should be part of the routing and capacity policy so monsoon, traffic disruptions, and technology failures are absorbed by design. This reduces the temptation to pull the same small pool of “reliable” drivers into repeated double-duties whenever there is disruption.
A practical mapping structure that keeps burnout in check usually includes:
• A Driver Utilization Index per week per driver.
• A hard cap on consecutive night shifts and maximum duty hours per 24-hour window.
• A simple Fatigue Risk flag in the command center that appears before a driver is assigned to another shift.
• Linkage between driver-related safety incidents, OTP dips, and that driver’s utilization history.
When this mapping is in place and visible at the command center level, shift reliability can improve without building a hidden backlog of fatigue that later shows up as accidents, absences, or sudden attrition.
For women safety on night shifts, which service KPIs should Security/EHS lock in (escort, SOS response, geo-fence) so we can prove duty of care?
B0257 Women-safety KPIs by service — In India employee mobility services for night shifts and women-safety programs, what service-catalog KPIs should the EHS/Security Lead insist on (e.g., escort compliance, SOS response time, geo-fence violations) so the organization can prove duty-of-care without relying on anecdotal assurances?
Duty-of-care KPIs EHS/Security should lock into the service catalog
EHS and Security leaders should insist on a small, hard-wired KPI set that converts women-safety and night-shift policies into measurable, auditable controls instead of anecdotal comfort.
The first group of KPIs should prove that mandatory safeguards are actually in place on every eligible trip. Escort rules and women-safety policies need a measurable Escort Compliance Rate for eligible routes and timebands. This KPI should be backed by trip-level manifests and randomized route audits rather than paper declarations. A complementary Driver Compliance Currency metric should track the percentage of active night-shift drivers with valid KYC, PSV, background checks, and current medical fitness.
The second group should measure how fast the system detects and responds to risk. An SOS Acknowledgement Time KPI should capture median and 90th percentile time from SOS press in the employee or driver app to first live response from the command center. An Incident Closure SLA should then capture time from incident creation to documented closure with root-cause analysis and corrective action. Geo-fencing metrics such as Geo-fence Violation Rate per 1,000 trips and Average Detection-to-Escalation Time for boundary breaches give objective evidence that route adherence is monitored in real time.
The third group should focus on systematic prevention and auditability rather than isolated fixes. A Random Route Audit Coverage KPI should define what share of night-shift and women-only trips undergo GPS log and CCTV or dashcam review in a given period. A Safety Training Completion Rate for drivers and transport staff on POSH, women-safety protocols, and emergency SOPs should be tracked as a formal compliance metric. A Zero Major Incident Streak indicator, expressed in trips or days since last major safety incident, helps leadership see whether the program is sustainably incident-free rather than just lucky.
The final group should link safety controls to the command-center and governance layer. An Alert Supervision Integrity KPI can track what percentage of safety-related alerts (overspeeding, device tampering, geo-fence breach, SOS) are both acknowledged and actioned within defined SLAs. A Safety Escalation Adherence metric should measure whether events that cross agreed thresholds reach the correct level in the escalation matrix within the promised time. These KPIs work best when their definitions, thresholds, and evidence sources are written directly into the service catalog and SLAs, so every night-shift program and women-safety initiative has a clear, audit-ready duty-of-care record instead of relying on verbal assurances.
For long-term rentals, what KPIs should we define beyond ‘vehicle available’—maintenance, replacement TAT, and downtime responsibility?
B0261 LTR continuity and downtime KPIs — In India long-term rental (LTR) programs for dedicated vehicles, what outcomes and KPIs belong in the service catalog beyond availability—such as preventive maintenance adherence, replacement turnaround time, and downtime attribution—so Operations can enforce continuity without constant escalation?
In long-term rental programs in India, Operations need a service catalog that defines continuity outcomes in measurable terms. The catalog should go beyond “vehicle available” to specify uptime, preventive maintenance discipline, replacement timelines, and clear downtime ownership. These KPIs give the control room predictable levers instead of relying on ad-hoc escalation.
The primary continuity outcome is a contractual fleet uptime target. This target should be expressed as a percentage across the tenure and linked to vehicle utilization and duty cycles. Preventive maintenance adherence needs its own KPI, measured as the percentage of scheduled services completed on time and documented. Replacement turnaround time should be committed as a fixed SLA in hours for breakdowns and in days for planned off-road maintenance.
Operations teams benefit from explicit downtime attribution rules. These rules separate vendor-controlled downtime from client-controlled downtime and from unavoidable external events. SLA breach rates must be tied to these attribution rules so penalties and credits are enforceable. Command center teams also need trip adherence and exception-closure time as continuity indicators, even for dedicated LTR vehicles.
A practical LTR catalog for Operations usually includes: - Fleet uptime percentage across the contract tenure. - Maximum allowable downtime per vehicle per month. - Scheduled maintenance adherence rate with proof. - Breakdown-to-replacement SLA by timeband and city. - Incident response and escalation SLAs linked to command center workflows. - Compliance currency for permits, fitness, and insurance to avoid regulatory off-road days. - Audit trail completeness for trip logs and maintenance events.
These outcomes let Operations enforce continuity through dashboards and periodic reviews instead of late-night firefighting and repeated vendor calls.
For a big shift workforce, how can we tell if delays come from routing, capacity, or roster changes—and what KPIs help pinpoint it without HR and Facilities blaming each other?
B0263 Diagnose OTP root cause KPIs — In India shift-based EMS for a large BPO/ITeS workforce, how do we diagnose whether the real problem is route planning, vendor capacity, or shift roster volatility—and which service-catalog KPIs help isolate root cause without turning it into a blame game between HR and Facilities?
In a shift-based EMS environment, organizations diagnose whether the core issue is routing, vendor capacity, or roster volatility by tying each symptom to a small, stable set of KPIs that sit in the service catalog and are visible to HR, Facilities, and vendors from the same dashboard. The KPIs must separate “demand pattern,” “planning quality,” and “supply performance” so the discussion stays evidence-led, not personal.
Facilities teams can start from on-time performance and trip adherence. Consistently low OTP% and poor Trip Adherence Rate during specific shift windows usually indicate routing or capacity issues rather than individual driver failure. If OTP collapses mainly in certain geographies or weather bands, route planning and buffer policies are weak. If OTP is fine until a certain fleet utilization threshold and then drops sharply, vendor capacity and standby policies are the constraints.
Roster-linked KPIs help isolate demand-side volatility. A rising No-Show Rate, frequent last-minute additions or cancellations, and large variance between planned vs actual seat-fill by route are strong signals that shift roster volatility is driving chaos. When these metrics move while vendor fleet, routing rules, and SLAs are unchanged, the root cause is usually shift planning, not transport execution.
Capacity and vendor performance can be separated with utilization and continuity metrics. A Vehicle Utilization Index that is permanently very high, combined with recurrent “no car available” exceptions and emergency backfilling, points to structural under-capacity. Stable utilization but frequent breakdowns, absent drivers, or SLA Breach Rate spikes point to vendor reliability and workforce management.
To keep this from becoming a blame game between HR and Facilities, the service catalog should explicitly assign each KPI to a decision domain. HR owns roster stability, attendance rules, and cut-off times. Facilities owns routing logic, buffers, and command-center execution. Vendors own uptime, compliance, and driver availability. Shared dashboards and periodic reviews can then discuss patterns route-by-route and shift-by-shift, using the agreed KPI set as a neutral “single source of truth” rather than personal judgment.
How do we set complaint-handling KPIs—TAT, reopen rate, closure quality—so employees feel heard without overwhelming ops with noisy tickets?
B0273 Complaint handling KPI definitions — In India employee mobility services, how should we define service-catalog KPIs for complaint handling (grievance TAT, reopen rates, closure quality) so HR feels employees are heard, but Operations isn’t drowned in low-quality tickets?
Service-catalog KPIs for complaint handling in India EMS should separate “speed”, “quality”, and “noise control” into distinct measures. HR needs auditable assurance that employees are heard and issues close with resolution, while Operations needs filters, categorization, and thresholds so that only meaningful tickets consume command-center time.
Most organizations benefit from defining a small, fixed set of complaint types and routing rules within the EMS catalog. Complaint handling then sits inside the ETS / EMS operation cycle as a governed flow with clear SLAs, escalation paths, and reporting, rather than an open-ended inbox. Central command centers and transport desks work best when grievance intake is standardized, for example via employee apps with structured categories, mandatory fields, and SOS separation for safety issues.
Grievance TAT should be tiered by severity instead of a single target. Safety and women-safety complaints need near-real-time acknowledgement and short closure windows, backed by alert supervision systems, SOS dashboards, and a defined safety escalation matrix. Service-quality and routing complaints can run on longer but still time-bound SLAs tied to ETS operation-cycle steps and command-center monitoring. HR confidence increases when TAT reporting is coupled with visible complaint closure SLAs and a user-satisfaction index component.
Reopen rates and closure quality are best treated as quality gates rather than speed metrics. Operations teams should track how many tickets re-open because root causes were not eliminated, linking this to driver management and training, fleet compliance, and routing optimization. A periodic, indicative management report that includes complaint categories, closure times, reopen ratios, and post-closure feedback scores helps HR demonstrate to leadership that issues are not only answered but fixed, while allowing Operations to identify low-value or duplicate tickets and tune thresholds or self-service responses instead of scaling headcount.
Across multiple cities, how do we standardize KPI definitions but still allow local exceptions without losing comparability in leadership reports?
B0278 Standardize KPIs across cities — In India corporate employee mobility with multi-site operations, what service-catalog structure helps standardize KPI definitions across cities while still allowing local exceptions (permits, traffic patterns, vendor mix) without destroying comparability for leadership reporting?
A tiered, template-based service catalog with a fixed core and controlled local extensions lets organizations standardize KPIs across cities while still absorbing local realities like permits, traffic patterns, and vendor mix. The core of the catalog must define a small, common set of services (EMS, CRD, ECS, LTR) with uniform KPI semantics and data structures, and each city or site then configures only bounded “overrides” such as timebands, fleet mix, and pricing bands without altering KPI meaning.
At the core level, organizations should define 3–6 standard service families that reflect industry practice in India corporate mobility. Employee Mobility Services should cover daily, shift-based commute with a shared definition of trips, seats, shift windows, and safety controls. Corporate Car Rental Services should define airport, intercity, and intra-city use cases with common concepts for response-time SLAs and vehicle classes. Project / Event Commute Services should treat project codes and temporary routes consistently. Long-Term Rental should standardize what “uptime,” “dedicated vehicle,” and “continuity” mean over a contract tenure. Each family needs a canonical KPI dictionary for OTP, Trip Adherence Rate, Trip Fill Ratio, Cost per Kilometer, and incident and compliance metrics, so Finance, HR, and leadership see comparable numbers across all cities.
Local exceptions should be implemented as parameter changes, not new service definitions. A city may add or adjust shift windows, escort rules, EV vs ICE fleet shares, or vendor tiers inside the EMS template, but it should not redefine what constitutes an “on-time” trip or a “safety incident.” Route design, traffic buffers, and permit-linked routing constraints should vary at configuration level while writing into the same trip ledger and KPI schema. Centralized command centers and NOC tooling can then aggregate multi-city data cleanly because they consume one set of service definitions and metrics, with city or vendor as just another dimension for comparison and drill-down.
images:
What KPIs can we use to cut dead mileage and improve seat-fill without pushing unsafe pooling or crazy pickup windows for employees?
B0281 Efficiency KPIs without bad incentives — In India employee mobility services, what service-catalog KPI definitions help detect and reduce operational drag like dead mileage and low seat-fill without incentivizing unsafe pooling or forcing employees into unreasonable pickup windows?
In India employee mobility services, service-catalog KPIs reduce dead mileage and low seat-fill most effectively when they are paired with explicit safety and experience guardrails. KPI definitions must reward route efficiency and utilization only within pre-agreed shift windows, maximum ride times, and women-safety and HSSE constraints.
A useful starting point is to define dead mileage explicitly in the catalog. Dead mileage is distance and time when a vehicle is running without an employee on board. Trip-level dead mileage should be measured from garage or last drop to next pickup location. Aggregated dead mileage percentage should be tracked as a share of total kilometers driven by the EMS fleet. Vehicle Utilization Index should be defined as total productive trip kilometers divided by total available duty kilometers across a cab duty cycle.
Seat-fill should be defined as Trip Fill Ratio. Trip Fill Ratio is the ratio of occupied seats to total configured seats for each trip, averaged across a shift window. Trip Fill Ratio must always be reported alongside On-Time Performance and Trip Adherence Rate so pooling pressure does not erode reliability.
KPI design should bind utilization metrics to strict safety and experience baselines. Maximum pickup window should be defined per shift band in the catalog and treated as non-negotiable. Maximum ride time should be captured as a KPI for each trip to prevent circuitous routes. OTP, route adherence audit scores, and incident rate must be included as qualifying KPIs for any pooling incentives.
A safe pattern is to use composite or gated KPIs in commercial terms. Seat-fill incentives should trigger only when minimum OTP, zero safety incidents, and compliance thresholds are met for the period. Dead mileage reduction should be rewarded only when escort policies, night-shift rules, and driver fatigue controls remain audit-compliant.
Service catalogs should also segment routing and pooling KPIs by timeband and persona. Night-shift and women-first routes should have stricter pooling caps and shorter pickup windows than daytime mixed-gender routes. This separation prevents a single utilization target from driving unsafe or unpopular routing decisions.
Finally, KPI definitions should specify evidence sources and auditability. GPS trip logs, HRMS-linked rosters, and compliance dashboards should be declared as the system of record for OTP, TAR, TFR, and dead mileage. This ensures that efficiency improvements are data-led and traceable rather than achieved through hidden compromises on safety or employee experience.
Governance, audits, contracts, and evidence
Outlines the evidence required for audits, contract clauses, penalties, post-award cadence, and how to avoid vanity metrics that hide real performance.
If we define outcomes per service line, what proof should Finance/Internal Audit expect so invoices match SLAs during audits?
B0202 Audit evidence for service-line SLAs — In India corporate ground transportation, what evidence should Internal Audit or Finance expect to see when outcomes are defined per service line (EMS/CRD/ECS) so SLA-to-invoice linkage is defensible during an audit?
Internal Audit and Finance should expect traceable, per-service-line evidence that links approved SLAs, actual trip-level performance, and billed amounts for EMS, CRD, and ECS. The evidence must start from contracted SLA definitions and flow through operational logs into reconciled billing so any invoice line can be defended back to outcomes such as OTP, safety compliance, and utilization.
For Employee Mobility Services, Internal Audit typically expects standard operating documents that define OTP thresholds, safety rules, escort norms, and routing policies per shift window. Auditors then look for automated trip manifests tagged to employees and routes, GPS-based logs that evidence trip adherence, and exception reports for delays, no-shows, and route deviations. They also require SLA dashboards that summarize OTP percentages, seat-fill, dead mileage, and incident closure times, aligned to contract metrics and time periods. Finance expects a clean bridge between these operational KPIs and commercial models such as per-trip or per-seat billing, with adjustments for penalties or incentives clearly documented.
For Corporate Car Rental Services, Finance and Audit expect centralized booking logs that show who requested which trip, which SLA band applied, and whether response times and vehicle standards were met. Evidence usually includes timestamps for booking, allocation, pickup, and drop, along with vehicle category and duty type, so promised service levels like airport tracking or intercity punctuality can be verified. Invoice line items must map back to these trip records, and any surcharges or waiting charges should be traceable to time-stamped logs. Dispute-free audits depend on tariff mapping tables and automated reconciliation that make manual overrides and leakage visible.
For Project or Event Commute Services, Internal Audit expects project-specific routing plans, fleet deployment schedules, and control-desk logs for the defined event window. Time-bound SLAs such as batch arrival times, peak-load handling, and dedicated desk availability need supporting evidence in the form of shift reports, attendance-linked manifests, and deviation summaries. Finance requires that temporary fleet usage, route-kilometers, and service days reconcile to event-specific commercial terms, especially when flexible or project-based pricing applies. Clear separation of ECS data from EMS and CRD prevents double-counting and helps auditors validate that short-term commitments matched billed volumes.
Across all three service lines, auditors look for a consistent control framework that includes centralized command-center monitoring, exception and incident registers, and documented escalation workflows. They expect compliance evidence for driver and vehicle documentation, women-safety rules, and business continuity procedures so safety and reliability outcomes are not just claimed but recorded. Finance teams, in turn, rely on integrated dashboards and management reports that consolidate OTP, utilization, and incident metrics by service line, making it possible to justify outcome-linked payments and penalties. The most defensible SLA-to-invoice linkage is built on automated data capture, minimal manual touchpoints, and auditable change logs that show what was billed, why, and under which agreed outcome.
How can Finance use service catalog mapping to spot leakage like dead mileage and exceptions when EMS and CRD are billed differently?
B0205 Use mapping to find spend leakage — In India enterprise-managed ground transportation, how can a CFO use service catalog mapping to expose where mobility spend is leaking (dead mileage, exceptions, duplicate trips) when EMS and CRD are billed under different logics and vendors?
In India enterprise-managed ground transportation, a CFO can use a unified service catalog mapped across EMS and CRD to normalize all trips into a common structure of entitlements, SLAs, and unit-cost baselines, then compare what was allowed by policy versus what was actually billed. This catalog-level reconciliation is what exposes leakages like dead mileage, unmanaged exceptions, and duplicate trips hiding behind different vendor logics.
A practical starting point is to define a single mobility service catalog that spans Employee Mobility Services (EMS) and Corporate Car Rental (CRD). Each catalog line item should have a clearly defined service type (e.g., “EMS: Night-shift pooled sedan,” “CRD: Airport transfer, sedan”), intended commercial logic (per-km, per-trip, per-seat, monthly rental), and expected KPIs such as Cost per Kilometer (CPK), Cost per Employee Trip (CET), Trip Fill Ratio, and On-Time Performance. The CFO can then insist that every vendor invoice, regardless of whether it is EMS or CRD, tags each line item to exactly one catalog code.
Once this normalization is in place, the CFO can run pattern checks across vendors and locations. Dead mileage becomes visible when per-km EMS or CRD items show high CPK against comparable catalog items with similar duty cycles or routes, and when “garage-to-garage” billing repeatedly over-runs the average live kilometers for the same shift windows. Duplicate or overlapping trips become visible when the same employee, cost center, time band, or origin–destination pair appears under different vendors or under both EMS and CRD catalogs within overlapping time windows. Exception leakage surfaces when ad-hoc or “special” trips exceed policy-defined catalogs, or when the ratio of non-standard catalog codes to standard catalog codes is unusually high for a given site or function.
To make this work operationally, the CFO needs consistent trip identifiers and data joins. Each trip record should include at minimum an employee or cost-center tag, time window, origin–destination pair, vendor ID, service-type flag (EMS vs CRD), and the mapped catalog code. Finance can then build reconciled views where aggregate billed amounts per catalog item are compared against expected volumes from HRMS-linked rosters, ETS operation cycles, and EMS route plans. Cases where billed kilometers significantly exceed roster-derived route distances, or where CRD trips mirror EMS shift patterns, are strong indicators of structural leakage.
The CFO can also link catalog mapping to outcome-based procurement. Catalog items that consistently show high CPK or CET without corresponding improvements in reliability, OTP, or safety metrics become candidates for renegotiation, vendor tiering, or re-routing into better-aligned catalog definitions. In parallel, EMS and CRD contracts should embed clear rules on what counts as billable dead mileage, how no-shows and last-minute cancellations are charged, and how exceptions are tagged at the catalog level to avoid them being mixed into standard line items. This combination of a unified service catalog, trip-level tagging discipline, and cross-vendor KPI comparison gives Finance a defensible, audit-ready view of where mobility spend is structurally leaking, even when EMS and CRD are billed under very different commercial logics and vendor contracts.
How do we turn service catalog mapping into enforceable SLA and penalty clauses across EMS, exec travel, and events—without loopholes?
B0209 Contract clauses from mapped services — In India corporate ground transportation contracts, how should Procurement translate service catalog mapping into enforceable SLA and penalty clauses across EMS shift routes, executive CRD, and event transport, without leaving loopholes that vendors can exploit during disputes?
Procurement teams should translate the service catalog into SLAs by defining one contract “language” for each service line (EMS, CRD, ECS) that is metric-based, time-banded, and explicitly linked to penalties, with no room for interpretation at dispute time. Each catalog item must map to a small, fixed set of measurable KPIs, clear measurement rules, and pre-agreed penalty ladders that sit inside the contract, not in side emails or SOPs.
For Employee Mobility Services shift routes, every route or seat category should carry explicit definitions for on-time performance, trip adherence, safety and escort compliance, and exception-closure time. The SLA must state how OTP is calculated per shift window, how many minutes early/late are allowed, and how missed or clubbed trips are counted. Penalties should be tied to threshold bands, such as deductions above a defined OTP breach rate, or per non-compliant trip where women-safety or night-shift rules are violated.
For executive CRD, the catalog should distinguish intra-city, intercity, and airport trips, and anchor SLAs on response time, vehicle class compliance, and flight-linked pickup adherence. The contract must stipulate what constitutes a no-show, what happens on vehicle downgrade, and how Finance will reconcile trip logs and invoices through a centralized billing process. This reduces billing disputes and aligns with the outcome-based, platformized CRD trend described in the context.
For project/event commute services, every time-bound bundle in the catalog should carry SLAs on fleet mobilization timelines, peak-hour dispatch readiness, and project-day OTP and completion rates. The clauses should define how delays during events are measured and how penalties apply when high-volume movements miss agreed performance bands. This needs to align with the rapid scale-up and time-bound delivery pressures highlighted for ECS.
To close loopholes, Procurement should standardize three elements directly in the master agreement:
- Measurement source of truth, such as specific GPS/telematics or command-center reports, and how conflicting data is resolved.
- Exception taxonomy, separating vendor-attributable causes from force majeure and client-side changes, with examples.
- Data access and audit rights, including trip ledgers, incident logs, and compliance evidence, to support audits and SLA verification.
This approach aligns with outcome-linked procurement, centralized NOC observability, and continuous assurance expectations in Indian corporate mobility, and it reduces scope for vendors to argue on definitions after a miss.
How can HR check that service catalog mapping won’t just be dashboards, and will actually change on-ground behavior and control-room actions?
B0210 Prevent mapping becoming vanity metrics — In India employee mobility services (EMS), what governance questions should a CHRO ask to confirm that service catalog mapping won’t become a “dashboard exercise,” but will actually change frontline behavior for drivers, supervisors, and the control room?
In India EMS, a CHRO should focus governance questions on how service catalog items are hard‑wired into SOPs, apps, SLAs, and audits rather than just listed on a slide or dashboard. The most effective questions test whether each catalog entitlement is mapped to specific routing rules, driver behaviors, control-room actions, and outcome-linked KPIs, with evidence trails HR can review independently.
Key governance questions a CHRO can ask include:
- From catalog to rules and SOPs
“For each service in the EMS catalog (e.g., night drops, women-first cabs, escort rules, EV routes), show the written SOP that describes what drivers, supervisors, and the command center must do differently.”
“Where are catalog entitlements encoded as system rules in the routing engine, rosters, and approval workflows rather than as ‘manual instructions’?”
“If a shift pattern or policy changes, who owns updating catalog-SOPs and system rules, and what is the change-control process?”
- Impact on drivers and supervisors
“How are catalog items translated into driver app prompts, duty slips, and practical instructions at lineup briefings?”
“Show the induction and refresher training modules that explain catalog-specific behaviors to drivers and field supervisors.”
“What happens if a driver or supervisor ignores a women-safety or night-route catalog rule—what are the documented consequences and escalation steps?”
- Control-room enforcement and exception handling
“For each service tier or policy (e.g., female night drop, hybrid-work shuttles, escort-mandatory routes), what real-time alerts or geo-fence rules are configured in the command center tools?”
“Walk me through a recent exception where a catalog rule was violated and show the trip log, alert history, and closure actions.”
“What are the SLA and escalation matrices that link catalog promises (OTP, safety, seat-fill, escort compliance) to control-room actions and timelines?”
- Measurement, audits, and incentives
“Which KPIs directly test whether catalog rules are followed on the ground, and how often are route adherence audits and random trip checks run?”
“How is driver performance, supervisor appraisal, and vendor payout linked to catalog-related KPIs like OTP%, incident rate, and escort compliance?”
“Can HR independently access reports that show catalog compliance by site, timeband, and vendor, including repeat offenders?”
- Cross-system integration and ownership
“How is the EMS service catalog mapped to HRMS personas, shift codes, and policy tiers, so entitlements and restrictions are applied consistently?”
“Who in the joint HR–Transport–Vendor governance forum owns quarterly review of the catalog, and how are changes prioritized against incident data and user feedback?”
These questions push vendors and internal teams to prove that catalog design is tied to routing logic, driver training, command-center playbooks, and outcome-based contracts. Strong answers will reference central command-center operations, compliance dashboards, women-safety protocols, EV route planning, and data-driven insights that already drive behavior change for drivers, supervisors, and EMS control rooms.
How should Legal/Compliance review our service catalog mapping so KPIs don’t cause DPDP or labor compliance issues like over-collecting data or unclear retention?
B0214 Legal review of outcome mapping — In India corporate ground transportation, how should Legal and Compliance review service catalog mapping so that service-line outcomes and KPIs don’t create DPDP or labor/OSH exposure (for example, over-collection of trip data or unclear retention)?
Legal and Compliance teams should review service catalog mapping by explicitly tying every mobility KPI and outcome to a documented lawful purpose, defined data elements, and clear retention rules that satisfy DPDP and labor/OSH obligations. Service lines must only collect and retain the minimum trip and identity data needed to evidence safety, compliance, and SLA outcomes, with mapped deletion or anonymization timelines and role-based access.
Legal and Compliance should first classify each service vertical in the catalog. Employee Mobility Services, Corporate Car Rental, Project/Event Commute, and Long-Term Rental all generate different operational KPIs, so each needs its own lawful-purpose statement, data dictionary, and retention baseline. KPIs like On-Time Performance, Trip Adherence Rate, driver credentialing currency, and incident-rate metrics should be derived from structured trip logs and telematics, not open-ended or excessive personal tracking, to avoid over-collection.
A common failure mode is building “data-driven” OTP, safety, or EV-emission dashboards without limiting who sees granular trip histories or how long raw location and manifest data are kept. DPDP risk increases when raw GPS traces, home addresses, and behavior logs are retained indefinitely, reused across services, or exposed in broad admin views. Labor and OSH exposure increases when fatigue, duty-cycle, or women-safety routing data are captured but not governed by clear SOPs, rest-period rules, and incident-response playbooks.
To reduce exposure, Legal and Compliance can require three controls during catalog design and review:
- Each catalog item must list explicit legal bases and operational purposes for every data field used to compute its KPIs.
- Each KPI must have a supporting retention and minimization rule that distinguishes short-term operational use from long-term audit evidence.
- Each role in command centers, HR, Security, and vendors must have scoped access to only the data views needed to discharge their OSH, safety, or SLA responsibilities.
If these catalog-level mappings are documented and enforced, organizations can keep outcome-based mobility contracts, centralized command-center operations, and ESG or EV reporting, without drifting into DPDP non-compliance or avoidable labor/OSH liability.
After we award the contract, what governance cadence should we run for service-line outcomes—weekly ops, monthly finance, quarterly exec—so issues surface early?
B0218 Post-award governance cadence design — In India corporate ground transportation, what should a post-award governance cadence look like when service catalog mapping defines different outcomes per service line—weekly ops reviews, monthly finance reconciliation, quarterly exec reviews—so problems surface before they become incidents?
Post-award governance cadence for multi-service-line corporate transport in India
A robust post-award governance cadence separates tactical, financial, and strategic reviews into distinct rhythms so reliability, cost, and safety issues are surfaced early. The cadence typically uses weekly operational reviews for EMS/CRD/ECS/LTR performance, monthly finance and compliance reconciliations, and quarterly executive reviews linked to service catalog outcomes.
Weekly operational reviews focus on shift reliability and safety for Employee Mobility Services, SLA-bound response and experience for Corporate Car Rental, execution certainty for Event/Project Commute, and uptime for Long-Term Rentals. Transport and vendor teams review OTP, exceptions, incident logs, driver fatigue signals, EV uptime, and command-center alerts, and they agree immediate corrective actions before patterns become incidents.
Monthly reviews bring together Transport, Finance, Procurement, and Compliance to reconcile trip and billing data, verify SLA-to-invoice linkage, and review safety and statutory compliance dashboards. These reviews align GPS/trip logs with invoices, surface dead mileage and leakage, validate vendor performance tiers, and ensure women-safety, KYC, and vehicle fitness remain audit-ready.
Quarterly executive reviews involve HR, CHRO, CFO, ESG, IT, and senior operations to compare each service line against its defined outcomes in the service catalog. Leaders review trendlines for reliability, cost per trip, safety incident rate, EV utilization and emissions, employee experience scores, and vendor risk, and then adjust commercials, capacity, or routing policies as part of a formal continuous-improvement backlog.
Signals that the cadence is working include fewer night-shift escalations to leadership, faster exception-to-closure times from the command center, cleaner audits with traceable evidence, and stable or improving commute experience and ESG metrics without reactive firefighting.
How can Procurement use service catalog mapping to protect themselves if the lowest-cost vendor underperforms—what documentation reduces blame later?
B0222 Procurement political protection via mapping — In India corporate mobility procurement, how can a category manager use service catalog mapping to protect themselves politically when the lowest-cost bidder underperforms—what documentation and outcome definitions reduce “you chose the wrong vendor” blame later?
In India corporate mobility procurement, a category manager protects themselves politically by tying vendor selection to a clearly documented service catalog, outcome-linked evaluation matrix, and signed governance records instead of price alone. This shifts future blame conversations from “you chose the wrong vendor” to “we selected against agreed service levels and outcomes.”
A robust service catalog defines each mobility service (EMS, CRD, ECS, LTR) in operational terms. Each catalog item should specify shift windows, routing complexity, OTP% targets, safety and compliance requirements, real-time monitoring needs, and EV/ESG expectations where relevant. This allows Procurement to show that bidders were assessed against fit-for-purpose requirements, not just cost per km.
The category manager should build an evaluation matrix that weights cost, reliability, safety, compliance, technology integration, and governance capability. The matrix should be documented, approved by HR, Transport, Security/EHS, Finance, and IT, and attached to the RFP file. This creates a shared decision record and dilutes single-person accountability.
Key documentation that reduces blame later includes:
- Signed service catalog and technical specs per service line with explicit OTP%, safety, and compliance expectations.
- RFP and bidder responses mapped to those specs, showing where low-cost vendors scored weaker on reliability or safety.
- Evaluation scorecards with cross-functional sign-off, including HR, Transport, Security, and Finance.
- Contract schedules that link commercials to KPIs like OTP%, incident rate, seat-fill, and exception-closure SLAs.
- A vendor governance plan with escalation matrix, business continuity expectations, and review cadence.
When the lowest-cost bidder is forced through by internal pressure, the category manager should still document risk notes in the evaluation, explicitly recording concerns from HR/Transport about reliability, women-safety, or command-center maturity. This creates an auditable trail that the choice was made with known trade-offs, agreed by stakeholders.
During execution, Procurement should insist on periodic performance reviews using the same outcome definitions that underpinned selection. Minutes of QBRs, SLA variance reports, and corrective action plans should be archived. When underperformance emerges, this evidence shows that Procurement provided a defensible process, early warnings, and structured governance, which is the strongest protection against “wrong vendor” blame.
How do we set grievance outcomes—ack time, resolution time, closure quality—so employees trust it and HR isn’t stuck firefighting?
B0223 Grievance outcomes employees trust — In India employee mobility services (EMS), how should HR define outcomes for grievance redressal (acknowledgement time, resolution time, closure quality) so employees trust the process and HR isn’t forced into reactive escalation management?
In India EMS programs, HR should define grievance outcomes as strict, time-bound SLAs with clear ownership and auditable closure, so employees see issues getting handled predictably rather than through ad-hoc escalations. These SLAs must be visible in the employee app and command-center dashboards, tied to incident logs and compliance checks, and reinforced through periodic reporting to leadership.
HR-led grievance outcomes work best when they mirror how 24x7 transport command centers already operate. Centralized dashboards in EMS and EV fleets track alerts such as geofence violations, overspeeding, SOS triggers, and app complaints in real time. When HR aligns grievance SLAs to these same monitoring and escalation workflows, grievances move from informal WhatsApp complaints to a traceable ticket lifecycle that Security, Transport, and vendors must follow.
Outcome definitions should differentiate acknowledgement speed, working-level resolution, and final closure. Acknowledgement time should be short and guaranteed for all channels integrated with the EMS platform, including SOS panels, employee apps, and call centers with defined staffing. Resolution time should be set by incident type and risk, using pre-agreed playbooks similar to business continuity plans for technology failures, cab shortages, or safety incidents. Closure quality should require documented RCA, corrective actions on drivers or vendors, and feedback confirmation from the complainant, rather than automatic auto-close.
HR can reduce reactive escalation by hard-wiring these outcomes into contracts and dashboards. SLAs for acknowledgement and resolution should be written into vendor agreements alongside OTP, safety, and compliance indices, with penalties or earnbacks tied to SLA breach rate. Command-center views and indicative management reports should include grievance ageing, closure SLAs, and recurring pattern analysis so Transport Heads get early alerts on failure hotspots before they become HR or leadership issues.
To ensure employee trust, HR should treat grievance redressal as part of the “user safety and protocols” fabric rather than a side process. This means linking grievance data to safety and compliance frameworks, women-centric safety protocols, and SOS workflows, so that night-shift and women-safety issues have visibly shorter SLAs and higher-priority routing in the command center. Periodic communication of aggregated grievance metrics and actions taken—without naming individuals—reinforces that the system works and that HR has control, visibility, and evidence instead of only reacting when social media or leadership intervenes.
What red flags should we look for in a vendor’s service catalog mapping—like vague exceptions, unclear ownership, or KPIs we can’t prove later?
B0225 Red flags in vendor mapping — In India shift-based employee mobility services (EMS), what are the practical red flags in a vendor’s proposed service catalog mapping that signal future pain—like ambiguous exception categories, missing escalation ownership, or KPIs that can’t be evidenced?
In India shift-based employee mobility services, the most dangerous red flags in a vendor’s service catalog mapping are gaps that break control-room predictability. Any ambiguity in what is “in-scope,” how exceptions are handled, and how KPIs are evidenced usually turns into nightly firefighting for the transport team.
A first red flag is vague or lumped exception handling. If the catalog does not clearly separate normal trips, ad‑hoc requests, no‑shows, last‑minute roster changes, weather or political disruptions, and technology failures, then every edge case becomes a negotiation. When exception categories are loosely worded, vendors can reclassify routine failures as “uncontrollable,” which hides SLA breaches and inflates cost-per-trip.
A second red flag is missing ownership in escalation and command-center design. A service catalog that talks about a “centralized command center” or “24/7 support” but does not specify who owns alerts, who triggers backups, and what timelines apply at each escalation level usually pushes responsibility back onto the facility head. In practice, the absence of a clear escalation matrix creates confusion during night-shift incidents, GPS outages, or cab shortages.
A third red flag is KPIs or compliance promises that are not tied to measurable evidence. If a vendor commits to OTP, safety, or EV-uptime metrics without mapping them to trip logs, GPS traces, audit reports, or a dashboard like the “Measurable Sustainability Outcomes” or “Advanced Operational Visibility” views, then those KPIs cannot be defended in audits. This undermines both SLA enforcement and ESG or safety reporting.
A fourth red flag is a service catalog that glosses over safety and compliance as generic statements. When women-safety protocols, driver and fleet compliance, and business continuity are present only as headings but not linked to concrete SOPs like “Centralized Compliance Management,” “Women-Centric Safety Protocols,” or specific BCP playbooks, safety responsibility quietly shifts back to the client.
A fifth red flag is incomplete coverage of operating models and commercials. If the catalog lists generic “employee transportation” without distinguishing shift-based EMS from project commute, corporate rentals, long-term rentals, and EV operations, cost and expectation mismatches appear later. Missing clarity on billing models, buffer vehicles, and how rapid EV adoption or charging is handled usually leads to surprise invoices and downtime.
A sixth red flag is technology that is described as a feature list but not integrated into operations. When driver, employee, and admin apps, alert supervision systems, and command centers are presented without explicit linkage to rostering, routing, compliance, and incident workflows, the technology layer becomes cosmetic. In operations, this disconnect forces manual workarounds and increases the risk of app or GPS failures escalating directly to the transport head.
A seventh red flag is the absence of business continuity and COB guarantees in the catalog. If the vendor does not bind BCP content—such as additional standby vehicles, political-strike playbooks, or tech-failure backups—into the standard service offering for EMS, then every disruption becomes a one-off negotiation instead of a pre-agreed SOP.
Operations teams evaluating a service catalog should therefore look for precise definitions of scope, explicit exception categories, named escalation owners with timelines, KPIs tied to auditable data sources, documented safety and compliance SOPs, clear operating and billing models across EMS and related services, real operational integration of technology, and codified business continuity measures.
images:
How can HR tell if our service catalog/KPI mapping is actually reducing escalations and manual work, not just changing the reporting format?
B0237 Prove catalog reduces firefighting — In India corporate employee mobility services, what is the best way for HR to measure whether service catalog mapping is reducing real operational drag (fewer escalations, fewer manual exceptions) rather than just reorganizing reports and dashboards?
In India corporate employee mobility, HR can best measure whether service catalog mapping is reducing real operational drag by tracking a small, linked set of before‑and‑after operational KPIs that sit outside the mobility team’s own reporting and are visible in HR, ITSM, and security workflows. These KPIs must show fewer escalations, fewer manual overrides, and faster closure times, not just cleaner dashboards inside the transport platform.
The strongest signal is a sustained drop in incident and escalation volume tied to specific catalog services. HR can compare monthly counts of transport-related tickets, calls to the helpdesk, and security/HSSE incidents before and after catalog roll‑out. A second signal is a reduction in manual exceptions, such as off‑catalog bookings, ad‑hoc approvals, and spreadsheet-based rostering, which indicates that employees and admins are actually using the standardized EMS, CRD, ECS, and LTR offerings.
HR should insist on measuring exception lifecycle rather than only exception count. A shorter average time from detection to closure for route deviations, no‑shows, women-safety exceptions, and billing disputes suggests that catalog definitions are aligned with SOPs and escalation matrices. If service catalog mapping is effective, Transport and Facility Heads will report fewer night-shift escalations and fewer “special cases” that require manual workarounds.
To make the assessment robust, HR can work with Procurement, Finance, and IT to validate three patterns over at least two to three quarters:
- A step‑change reduction in escalation tickets and emergency calls per 1,000 trips.
- A visible drop in manual interventions, such as out‑of‑band bookings or non-standard routes, logged in ITSM or email trails.
- Stable or improved on‑time performance, safety incident rates, and complaint closure SLAs, showing that fewer escalations are due to better control, not under-reporting.
For ESG reporting, how do we set up our service catalog so emissions numbers are credible and not questioned because we mixed shuttles, on-demand trips, and long-term rentals?
B0242 Avoid greenwashing via catalog — In India corporate ground transportation, how should an ESG lead map service lines in the mobility service catalog so emissions reporting doesn’t get accused of greenwashing because the data method mixes pooled shuttles, on-demand trips, and long-term rentals without traceable definitions?
An ESG lead should define each mobility service line as a distinct, traceable emissions “bucket” with its own operational definition, data source, and calculation method, and must never blend Employee Mobility Services, Corporate Car Rental, Project/Event Commute, and Long-Term Rental into a single undifferentiated category. Emissions reporting stays credible when every reported tonne of CO₂ can be tied back to a clearly labeled service type, trip pattern, and accounting rule that an auditor can retrace from ESG report to underlying trip logs.
The starting point is to align the mobility service catalog with the four governed service verticals used in Indian corporate ground transportation. Each vertical should be explicitly labeled in emissions disclosures. Employee Mobility Services should cover shift-based pooled shuttles and cab-pooling with seat-fill, gCO₂/pax‑km, and idle-emission metrics. Corporate Car Rental should cover on-demand intra-city, intercity, and airport travel with cost-per‑km and executive-trip profiles. Project/Event Commute should be tagged as time-bound, high-volume programs with separate routing and fleet-mix assumptions. Long-Term Rental should be tagged as dedicated vehicles with lifecycle-style utilization and uptime metrics.
A common failure mode is using one emission factor per kilometer across all these patterns. That approach hides differences between pooled rides, single-occupancy sedans, and EV routes, and it creates exactly the greenwashing risk ESG leads want to avoid. Instead, the ESG lead should anchor each service line to its own parameter set. For Employee Mobility Services, this means tracking Trip Fill Ratio, EV utilization ratio, and gCO₂/pax‑km. For Corporate Car Rental and Long-Term Rental, this means using vehicle-level data such as Cost per Kilometer, fuel type, and vehicle utilization index. For Project/Event Commute, the ESG lead should treat each project as a mini-program with its own temporary baseline and post‑event summary.
Data lineage is central to avoiding accusations of greenwashing. The ESG lead should insist that every aggregated emissions figure can be decomposed into trip-level records with clear tags for service line, vehicle type, energy source, and date. The emissions model should explicitly reference the operational concepts used by transport teams, such as EV utilization ratio, emission intensity per trip, and idle emission loss. Without this operational alignment, ESG numbers will look like a separate narrative rather than an output of the governed mobility system.
To keep the catalog auditable over time, the ESG lead should define a minimal set of “reporting classes” and attach them to the existing service lines. For example, a pooled EMS shuttle with an EV can be one class, a pooled EMS diesel cab another, an on‑demand CRD sedan a third, and a dedicated LTR EV a fourth. Each class should have its own documented emission factor logic and data dependence. The ESG lead should then ensure that procurement and transport contracts reference these same definitions so billing models, routing rules, and ESG accounting stay consistent.
Finally, the ESG lead should expose these definitions in ESG and CSR narratives instead of only publishing totals. Most organizations avoid greenwashing accusations when they show their mobility taxonomy, explain how Employee Mobility Services differ from Corporate Car Rental and Long-Term Rental, and demonstrate that pooled shuttles, on-demand trips, and dedicated vehicles are measured with different lenses. Emissions reporting is defensible when service lines, operational KPIs, and calculation rules are tightly mapped and stable from one reporting cycle to the next.
As HR, what should we ask to make sure our service catalog and KPIs give us audit-ready proof for safety incidents and complaints when leadership questions us?
B0243 Protect HR with evidence — In India corporate employee mobility, what questions should a CHRO ask to ensure the service catalog mapping supports ‘audit-ready evidence’ for safety and grievances, so HR isn’t left defenseless when leadership asks, “How often does this happen, and what did we do?”
A CHRO should focus on questions that force clarity on what gets logged, how it is proved, and how fast it is acted upon. The goal is that every safety incident or grievance leaves a clean, retrievable trail that ties back to the service catalog and SLAs.
1. Service catalog design and scope
CHROs should first ask how each service type is defined and governed.
- “For each mobility service we use (EMS, CRD, ECS, LTR), what are the formally defined safety and grievance-handling SLAs?”
- “Are safety and grievance workflows explicitly included as line items in the service catalog, or treated as informal add-ons?”
- “Do women’s night-shift routes, escorts, and SOS coverage appear as distinct, governed services with clear KPIs?”
2. What is logged, and at what granularity?
Audit-ready evidence depends on systematic, tamper-evident logging.
- “For every trip, what fields are captured by default (route, OTP, vehicle, driver ID, escort presence, SOS events, deviations)?”
- “Can we reconstruct the full trip lifecycle and incident timeline from system logs alone, without manual spreadsheets?”
- “How is audit trail integrity ensured so that incident data cannot be backdated, edited, or deleted without trace?”
3. Safety and incident workflows
Safety must be codified as workflows, not slogans.
- “What are the exact steps when an SOS is pressed, a geo-fence is violated, or a no-show or delay crosses a threshold?”
- “Who is auto-notified at each severity level, and what are their response-time SLAs?”
- “How are women-centric safety protocols (female-first routing, escort rules, late-night drop sequencing) encoded in the routing engine and service catalog?”
4. Grievance capture, closure, and linkage to trips
Leadership questions usually target patterns and closure discipline.
- “How are employee complaints captured—app, helpline, email—and are they always linked to a specific trip ID and driver?”
- “What are the closure SLAs for different grievance types, and can we report logged vs resolved vs pending by category and time-band?”
- “Can we show, for a given month, how many issues escalated to Security/EHS and what corrective actions were taken?”
5. Reporting, dashboards, and “How often does this happen?”
CHROs need repeatable answers, not one-off manual reports.
- “Can I pull, on demand, dashboards showing safety incidents, SOS triggers, delays, and grievances by site, vendor, gender, and shift window?”
- “Do we have trend views (weekly, monthly, quarterly) that correlate incident rates with OTP, attendance, and attrition?”
- “Can the system produce ready-to-share packs for audits and board reviews without manual data stitching?”
6. Ownership, governance, and escalation
Evidence is only useful if roles and escalation paths are clear.
- “Who in the command center owns first-line triage, who owns escalation, and who signs off on incident closure?”
- “Is there a documented escalation matrix that ties CHRO, Transport, Security/EHS, and vendor roles to specific SLA breaches?”
- “How often are joint reviews (HR, Transport, Security, vendor) held on safety and grievances, and what standard reports are tabled?”
7. Compliance, retention, and audit readiness
Regulators and internal audit care about retention, completeness, and provenance.
- “For how long are trip logs, GPS traces, and incident records retained, and does this meet our internal policy and legal expectations?”
- “Can we demonstrate continuous compliance on driver KYC/PSV, vehicle fitness, and night-shift policies from the same system?”
- “If an incident is investigated after 6–12 months, can we retrieve all related artefacts (trip data, call logs, chat transcripts, CCTV references, actions taken) in one place?”
8. Change, verification, and continuous improvement
CHROs should insist that learnings turn into configuration changes.
- “After a major incident or recurring pattern, how does the vendor update routing rules, SLAs, or safety protocols in the service catalog?”
- “Do we run periodic route adherence audits and mock drills, and are results logged against specific services and vendors?”
- “Can we show before/after metrics when we introduce a new control, such as escorts on certain routes or stricter driver fatigue rules?”
When these questions are answered with concrete workflows, logs, and dashboards, the CHRO can walk into leadership reviews with defensible numbers and documented actions instead of anecdotal explanations.
How do we decide what to standardize across all sites vs what to keep site-specific in our mobility service catalog, while still keeping Finance reporting and audits consistent?
B0245 Standardize vs localize mapping — In India corporate mobility contracts, how do Finance and Procurement decide whether to standardize one outcome framework across all locations versus allowing site-specific service catalog mappings, without losing comparability for audits and board reporting?
Finance and Procurement in India typically choose a hybrid model. They define one enterprise-wide outcome framework and KPI dictionary at the top level, then allow site-specific service catalog mappings and commercials inside that frame. This preserves local flexibility but keeps numbers comparable for audits, board reporting, and ESG disclosure.
Finance teams first standardize what “outcomes” mean across Employee Mobility Services, Corporate Car Rental, Project/Event Commute and Long-Term Rental. They lock a common language for KPIs such as cost per kilometer, cost per employee trip, on-time performance, trip adherence, Trip Fill Ratio, fleet uptime, incident rate, and EV utilization ratio. These outcomes are then enforced through one procurement scorecard and vendor governance framework that apply in every city.
Procurement then permits location-specific service catalogs, routing patterns, fleet mix, and commercial models. They treat these as configuration, not as separate frameworks. Each site can use different slabs, timebands, or fleet types, as long as every service line still rolls up into the same KPI library and contract constructs like SLA ladders, penalties, and earnbacks.
A common failure mode is allowing each city to define its own KPIs or SLA semantics. This breaks comparability and creates audit friction. A more robust approach is:
- Freeze a single KPI schema, outcome hierarchy, and data model for all locations.
- Allow local variations only as attributes or dimensions inside that schema.
- Mandate a unified trip and billing ledger format for every vendor and site.
- Tie payouts and penalties everywhere to the same small set of outcomes.
This structure lets Finance compare performance and unit economics across cities, vendors, and service verticals. It also lets Procurement run defensible RFPs and renegotiations, even with heterogeneous local operating realities.
How can we define KPIs per service so billing can auto-link to SLAs across EMS/CRD/ECS/LTR instead of manual reconciliation?
B0260 Link KPI definitions to billing — In India corporate mobility programs, how can the Finance Controller structure service-catalog KPI definitions so invoices can be automatically tied to SLA outcomes by service line (EMS vs CRD vs ECS vs LTR), rather than requiring manual reconciliation every billing cycle?
In India corporate mobility programs, Finance Controllers can enable automatic SLA-linked invoicing by defining a service catalog where each service line (EMS, CRD, ECS, LTR) has a small, fixed set of standard KPIs, with unambiguous formulas, data sources, and billing rules attached. Each trip, shift, or rental must carry a service-line tag and a unique trip or contract ID so that KPIs, SLAs, and invoices are computed from the same governed data, not from ad‑hoc spreadsheets.
For Employee Mobility Services, the Finance Controller should define contract language where unit charges are indexed to metrics like On-Time Performance, Trip Adherence Rate, Trip Fill Ratio, and dead mileage caps. The routing engine and command center should produce a normalized trip ledger with GPS, roster, and HRMS data reconciled, so SLA compliance is a machine-calculated field that directly drives credits or penalties on the EMS invoice.
For Corporate Car Rental Services, the service catalog should differentiate airport, intra-city, and intercity products with clear per-kilometer or per-trip baselines and explicit rules for response-time SLAs, vehicle category, and wait-time handling. Trip-level analytics should feed a cost-per-kilometer and service-level compliance index that the billing engine uses to auto-apply surcharges or rebates.
For Project/Event Commute Services, the Finance Controller should model time-bound packages with pre-agreed fleet counts, shift windows, and OTP thresholds, so time-boxed SLA performance over the event period can be aggregated automatically into outcome-based payouts without manual recalculation. The project or event control desk should ensure that all temporary routes and vehicles are tagged under the correct ECS project code.
For Long-Term Rental, the catalog should treat each dedicated vehicle as a contract entity with uptime SLAs, preventive maintenance schedules, and utilization thresholds. The billing model can stay largely fixed-fee, but with automated adjustment rules tied to Fleet Uptime or Maintenance Cost Ratio, derived from telematics and service logs rather than manual declarations.
Across all four service lines, Finance Controllers should insist on an API-first integration between the mobility platform, HRMS, and ERP, with a shared semantic KPI layer that defines cost-per-kilometer, cost-per-employee trip, On-Time Performance, and incident rate identically for operations and billing. Outcome-based contracts should reference these canonical KPI definitions explicitly, so SLA breach rate, penalty ladders, and earnback conditions can be computed by the system and surfaced on dashboards, reducing SLA disputes and audit friction.
In the RFP, what KPI evidence should we ask for—sample logs, incident records, scorecards—so we don’t pick a vendor who only looks good on paper?
B0272 RFP evidence for KPI claims — In India corporate ground transportation procurement, what service-catalog KPI evidence should be mandatory at bid stage (sample trip logs, incident records, SLA scorecards) to reduce the risk of vendors over-promising and then failing after award?
In India corporate ground transportation procurement, buyers should mandate KPI evidence that proves a vendor’s day‑to‑day reliability, safety, cost control, and governance, not just fleet size or tech features. Procurement teams reduce over‑promising risk when they demand raw, auditable samples from live operations that can be reconciled to SLAs and unit economics.
Vendors should be required to submit recent, anonymized samples of trip‑level data for each relevant service line such as Employee Mobility Services, Corporate Car Rental, Project/Event Commute, and Long‑Term Rental. These trip logs should show timestamps, route adherence, no‑shows, dead mileage indicators, and exception flags so that On‑Time Performance, Trip Adherence Rate, and utilization can be independently calculated. Buyers should insist that logs include both normal and disrupted days to avoid cherry‑picking.
Safety and compliance assurance should be evidenced through incident registers and audit trails. These must list safety incidents, SOS triggers, escort-rule deviations, and credential lapses, along with detection time and closure time. Buyers should ask for proof of continuous compliance management such as driver KYC/PSV validity, periodic vehicle fitness checks, and route audit samples to verify that “safety by design” is actually operationalized.
Governance quality is best validated with SLA scorecards and escalation records. Vendors should present at least two to four recent SLA dashboards from existing clients showing OTP%, exception closure SLAs, complaint volumes, and penalty or earn‑back application. Procurement can further lower risk by requesting redacted QBR decks, business continuity playbooks that have been used in real disruptions, and billing vs GPS reconciliation samples linking kilometers, tariffs, and invoices.
To connect cost and performance, finance and procurement stakeholders should ask for Cost per Kilometer and Cost per Employee Trip benchmarks derived directly from sample data. These values should be segmented by city, time band, and service type to reveal how the vendor performs under different operating conditions. This helps expose hidden dead mileage, under‑utilized routes, or excessive exception surcharges that will surface after award.
Safety, compliance, experience, and reliability KPIs should be mapped clearly to the service catalog. For example, EMS should show shift‑wise OTP and seat‑fill, CRD should show airport and intercity response SLAs, ECS should show high‑volume event punctuality, and LTR should show fleet uptime and preventive maintenance adherence. Mandating this mapping at bid stage forces vendors to prove performance for exactly the services being procured.
images:
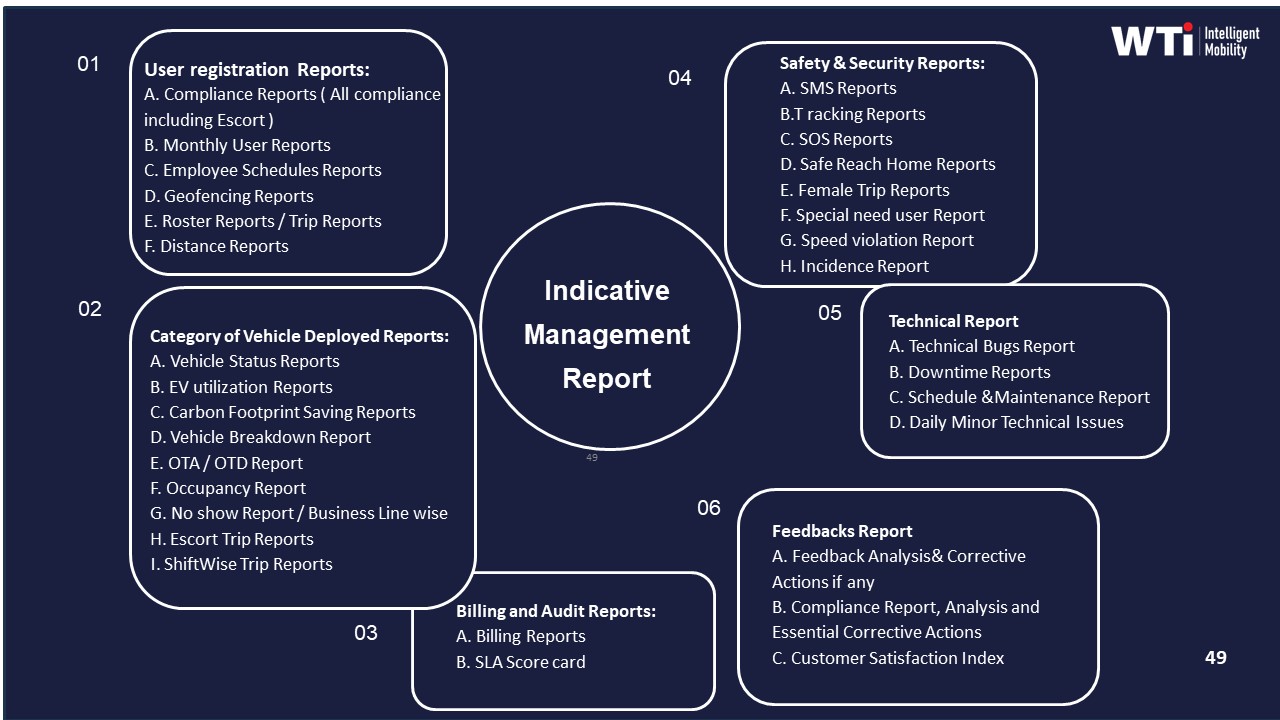
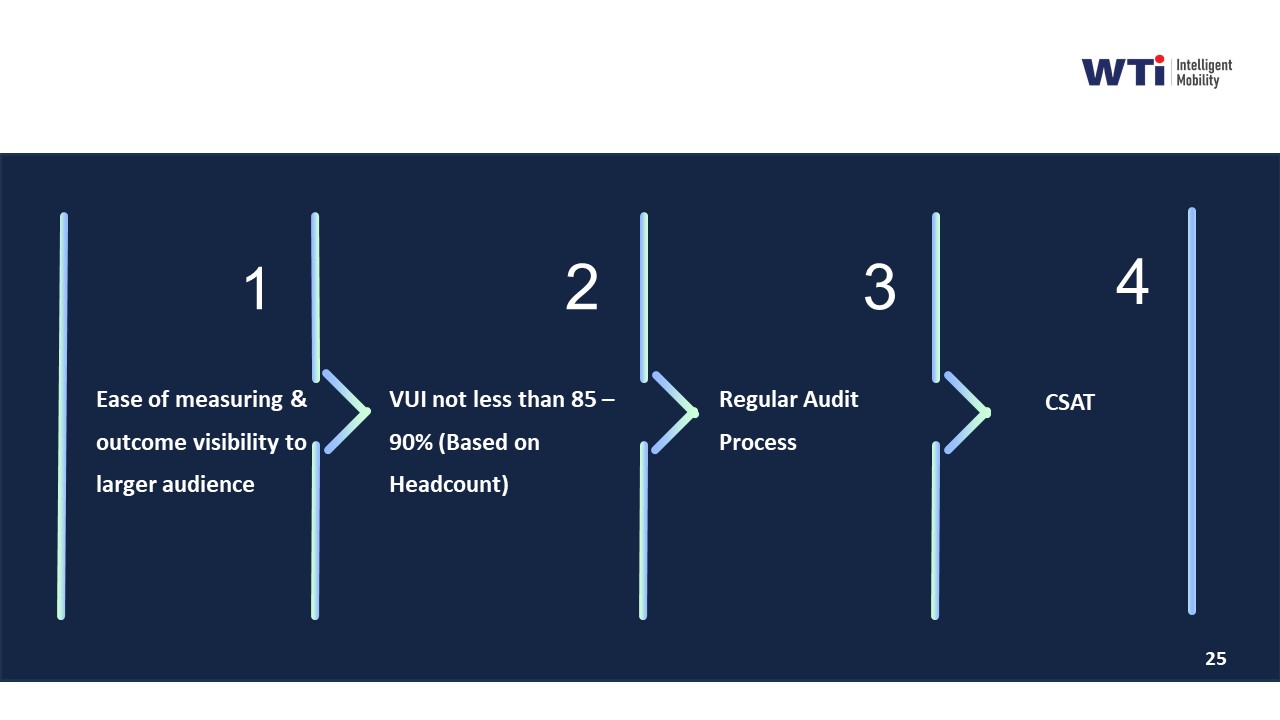
If a serious night-shift incident happens, what KPI definitions and evidence should we already have so HR and Security can answer leadership fast?
B0274 Incident-ready KPI and evidence — In India corporate mobility programs, when a serious night-shift safety incident triggers an internal investigation, what service-catalog KPI definitions and evidence expectations help the CHRO and Security Lead answer leadership questions quickly without scrambling for data?
In India corporate mobility programs, CHROs and Security Leads answer leadership fastest when service-catalog KPIs are clearly defined upfront and every trip leaves an audit-ready evidence trail. The most effective setups treat safety and compliance metrics as part of the standard ETS/EMS service catalog, not as ad-hoc reports requested after an incident.
The core service-catalog KPIs that matter during a night-shift safety investigation are those that describe reliability, safety controls, and governance for that specific trip type. For Employee Mobility Services, useful KPIs include On-Time Performance for pickups and drops, Trip Adherence Rate to the approved route, Incident Rate per 1,000 trips, Escort Compliance for women’s night shifts, Driver Credential Currency, and Complaint Closure SLA. Each KPI must have a precise definition, a calculation method, and an owner in Transport or Security, so that leadership questions map to named metrics instead of manual data pulls.
Investigations move quickly when every trip has an evidence pack linked to these KPIs. This evidence typically combines GPS trip logs with geo-fencing alerts, time-stamped driver and vehicle compliance records, escort and women-safety policy checks, and panic/SOS activation logs. Centralized command-center tooling and alert supervision systems strengthen this by providing real-time monitoring, exception alerts such as overspeeding or geofence violations, and closure records for each safety ticket.
Effective CHROs and Security Leads also insist on role-based access to a single-window dashboard that consolidates commute KPIs, exception histories, and safety incidents for night shifts. This reduces scrambling across HRMS, vendor apps, and manual duty slips when reconstructing a serious event and allows them to provide auditable, time-stamped answers to “what failed, how often has this happened, and what changed since?”
How do we set KPI thresholds and penalties so they actually improve behavior without creating endless disputes and paperwork for ops?
B0279 Penalty design tied to KPIs — In India corporate ground transportation, how should Procurement and Finance define service-line KPI thresholds and penalty logic so it drives behavior change without creating constant disputes and ‘penalty paperwork’ that exhausts Operations?
In India corporate ground transportation, Procurement and Finance should define a small, service-line specific KPI set with clear “green–amber–red” thresholds and simple, pre-agreed penalty logic that only triggers on sustained or material underperformance. KPI design should focus on behavior change at vendor and operations level, not on maximizing recoveries per trip or incident.
Procurement teams work best with 3–5 primary KPIs per service line like Employee Mobility Services, Corporate Car Rental, Project/Event Commute, or Long-Term Rental. Each KPI should have a definition tied to the transport operation, such as On-Time Performance for pickups and drops, Trip Adherence Rate for planned versus executed routes, Incident Rate for safety and compliance breaches, Cost per Kilometer for unit economics, or EV Utilization Ratio for sustainability targets. Finance leaders gain predictability when KPI definitions map directly to billing logic and when these definitions use data produced by the mobility platform, not spreadsheets.
A common failure mode is setting very tight thresholds for OTP, incident-free days, or cost variance and then applying per-trip penalties. This pattern increases disputes and paperwork because Operations must negotiate every edge case. Thresholds work better when they define a performance band over a period, for example a monthly OTP band and a ceiling on SLA breach rate. Penalties can then be linked to the band outcome instead of each breach.
Behavior change improves when contracts use a mix of credits, earnbacks, and warnings rather than only cash penalties. Procurement can define automatic amber-band responses such as corrective action plans or temporary increased governance. Finance can reserve monetary penalties for red-band performance or repeat non-compliance across months. This structure reduces noise for the Facility or Transport Head and keeps penalty administration focused on real risk to safety, reliability, or cost.
After go-live, how do we review and refine the service catalog/KPIs in the first 60–90 days without the vendor calling every fix a scope change?
B0284 Post-go-live KPI governance review — In India employee mobility services, how should post-purchase governance review the service catalog and KPI definitions after the first 60–90 days so the team can fix what’s not working without the vendor claiming ‘scope change’ for every adjustment?
In India employee mobility services, post-purchase governance should treat the first 60–90 days as a controlled “stabilization window” where the service catalog and KPI definitions are refined under pre-agreed rules, with clear distinction between tuning existing scope and adding new scope. Governance must anchor every adjustment to the original EMS/CRD/ECS/LTR service definitions, route windows, and KPI baselines so that operational fixes are treated as optimization, while genuine additions are logged as formal scope change.
In practice, most organizations get trapped when the initial service catalog is written too generically. Vendors then label every routing tweak, capacity change, or app configuration as “out of scope”. A more resilient approach is to pre-define, in the contract and SOW, which parameters are adjustable during the 60–90 day period without commercial change. These adjustable parameters typically include shift windowing for EMS, seat-fill targets, dead-mile caps, basic fleet mix within a band, routing and scheduling rules, and operational playbooks for the command center and escalation matrices.
Post-purchase governance works best when a cross-functional mobility steering group runs a structured 60–90 day review cadence. This group should include HR/Transport, Procurement, Finance, Security/EHS, and IT. The group can then classify each requested change into three buckets. The first bucket is “tuning inside agreed guardrails”, such as revising OTP thresholds, adjusting Trip Adherence Rate sampling, or redefining Trip Fill Ratio targets per timeband. The second bucket is “redistribution within scope”, such as rebalancing EMS capacity across sites while keeping the total contracted capacity and operating bands constant. The third bucket is “true scope change”, such as adding new cities, new service verticals like ECS, or new policy entitlements not foreseen in the initial service catalog.
The review of KPI definitions should focus on mapping a small, stable set of canonical metrics to each service line. For example, EMS should consistently track On-Time Performance, Trip Adherence Rate, Vehicle Utilization Index, Trip Fill Ratio, and Incident Rate. CRD should emphasize response time SLAs, Cost per Kilometer, vehicle quality compliance, and airport or intercity punctuality. ECS should emphasize event-day OTP, route adherence audit scores, and exception closure time. LTR should focus on fleet uptime, preventive maintenance adherence, and utilization. Once this mapping is explicit, the governance team can refine target values and calculation logic during the 60–90 day window without redefining which KPIs exist.
A common failure mode is mixing “how we measure” with “what we bought”. Vendors can exploit ambiguity when OTP formulas, incident definitions, or dead mileage rules are vague. To counter this, organizations should maintain a KPI dictionary as part of the contract annexure. The dictionary should define formulas, data sources, and inclusion–exclusion rules for each KPI. During the 60–90 day review, only calculation parameters and target ranges are adjusted, not the KPI identity itself. This separation allows significant tuning without creating scope disputes.
Another recurring issue is that hybrid-work and attendance volatility drive frequent roster and routing changes. Vendors may call these changes “scope creep”. A more robust approach is to define acceptable demand variability bands in the original catalog. For example, EMS capacity can be contracted with a base pool and a defined elastic band per route or timeband. As long as volume and route changes remain within the band and within agreed shift windows, adjustments are treated as elasticity, not scope change. Only when structural elements change, such as adding an entirely new shift pattern or geography, does the governance board classify the adjustment as scope expansion.
Command center operations and observability are also critical in the first 60–90 days. Target Operating Model provisions like 24x7 NOC coverage, alert supervision, and exception management SLAs should be used to systematically capture where the catalog and KPIs are misaligned with reality. Post-purchase review meetings should be data-driven, using dashboards on OTP, exception latency, incident trends, EV utilization ratio where applicable, and complaint closure performance. This data forms the basis for “optimization sprints” where vendor and client teams agree on specific tuning actions that remain within the existing service tiers.
To avoid vendors framing every refinement as chargeable, Procurement and Finance should embed an explicit “stabilization and optimization” clause. This clause should define the 60–90 day period as an implementation phase that includes at least one full cycle of roster and route re-optimization, one comprehensive review of command center SOPs, and one KPI recalibration workshop. Only after a formal “stabilization sign-off” does the change-control mechanism start treating functional changes as commercial scope changes.
A practical way to operationalize this is to maintain a live change log overseen by the mobility governance board. Each change request is tagged with impact on cost per employee trip, cost per kilometer, safety/compliance exposure, On-Time Performance risk, and Commute Experience Index. If the change is necessary to meet the originally contracted outcomes, it is classified as “within scope optimization”. If it adds new outcomes, entitlements, or regions, it moves into formal change control. This outcomes-based lens aligns with the broader industry shift towards outcome-linked procurement and reduces arguments about “extra” work.
Finally, the post-purchase governance process should be transparent and repeatable. Organizations should document the 60–90 day learnings into a revised, version-controlled service catalog that lists EMS, CRD, ECS, and LTR offerings by site, with associated KPIs, thresholds, and escalation rules. This catalog then becomes the reference point for future quarters, vendor benchmarking, and any mobility maturity roadmap. When structured in this way, the first 60–90 days become a planned tuning phase rather than an informal firefighting period, and both client and vendor gain a defensible framework to distinguish optimization from true scope change.
Operations resilience, escalation, and multi-vendor accountability
Focus on escalation paths, NOC performance, and ensuring vendor accountability across service lines, with explicit failure modes and recovery procedures.
How do we define EMS outcomes that reduce night-shift escalations—like exception response and closure quality—not just on-time pickups?
B0207 NOC outcomes beyond OTP — In India shift-based employee mobility services (EMS), how should an Operations NOC leader define outcome KPIs that actually reduce night-shift escalations (exception latency, escalation SLA, closure quality) rather than just measuring on-time pickup/drops?
In India shift-based employee mobility, an Operations NOC leader should define outcome KPIs around how fast exceptions are detected, how reliably they are escalated, and how completely they are closed, instead of only tracking on-time pickups and drops. These KPIs must reflect the full trip lifecycle in the command center, from first anomaly signal to incident closure with HR, Security, and vendors.
An effective NOC framework treats every OTP deviation or safety risk as an “exception case” with its own SLA. Exception Latency is the first anchor KPI. It measures the time from when data indicates a risk (ETA drift, GPS loss, SOS, geofence breach, women travelling alone after cut-off) to when the NOC first acknowledges it. A second set of KPIs captures Escalation SLA. These include time from exception acknowledgment to first contact with the driver, time to inform the employee, and time to involve Security or HR for women’s night shifts. A third layer measures Closure Quality. This includes time to restore service (alternate cab, re-routing), quality of documentation for audits, and whether preventive actions such as driver coaching, vendor penalties, or route redesign are logged and tracked.
To make these KPIs reduce night-shift escalations in practice, NOC leaders link them to vendor governance, driver management, and safety protocols. Exception and closure metrics are used in QBRs instead of OTP alone. They are also integrated into Business Continuity Plans for cab shortages, tech failures, or political unrest, and into centralized compliance dashboards for driver and fleet readiness. This approach shifts the command center from reactive firefighting to predictable, auditable control of night operations, which is what HR, Security, and Facility heads need when something happens at 2 a.m.
For event/project transport, how do we set outcomes that enforce punctuality but still account for permits, crowding, and last-minute changes?
B0212 ECS outcomes under real constraints — In India project/event commute services (ECS), how can a Projects head define outcomes that balance “zero-tolerance for delays” with realistic operational constraints like permits, crowding, and last-minute attendee changes?
In India project/event commute services, Projects heads get the best balance by defining outcomes as “zero tolerance for unmanaged delays,” not “zero incidents at any cost.” Outcomes should focus on on-time performance, escalation speed, and recovery predictability, while explicitly accounting for permits, congestion, and last-minute roster changes in SLAs, buffers, and playbooks.
Projects heads can start by defining reliability in KPI terms instead of absolutes. On-time performance targets can be set at 98–99% for critical movements, with a clearly defined trip adherence rate and exception-closure SLA. These outcomes should be backed by routing rules, peak-load buffers, and a dedicated project control desk, which are standard patterns in project/event commute services. Operational constraints such as permit windows, local restrictions, and predictable congestion pockets should be captured upfront in the event mobility design, rather than treated as excuses after a miss.
The second layer is to encode “what happens when things go wrong” into outcomes. This can include maximum acceptable time to detect a deviation, maximum delay before a backup vehicle is dispatched, and how fast revised ETAs must reach site coordinators and attendees. These targets rely on a centralized or project-specific command center, live tracking, and predefined escalation matrices. Crowd surges and last-minute attendee changes should trigger rule-based responses such as standby fleet activation, temporary routing changes, or mode shifts, instead of ad-hoc decisions.
To keep expectations realistic across stakeholders, Projects heads can anchor contracts and internal scorecards around a small set of measurable commitments:
- On-time arrival % for first pickups, venue arrivals, and return dispersals.
- Exception detection-to-escalation time for delays or route deviations.
- Seat-fill and dead-mileage caps to control cost while maintaining buffers.
- Safety and compliance metrics that must never be compromised, even when rerouting under pressure.
This approach preserves a “zero-tolerance” posture at the level that matters to leadership and attendees, while giving transport teams the room, tools, and buffers they need to operate under real-world Indian conditions.
How do we set shift-population KPIs so managers stop escalating late logins daily, and we can prove if transport is really the cause?
B0226 Shift KPIs that calm managers — In India corporate ground transportation, how should a buyer set persona-specific KPIs for large shift populations so frontline managers stop escalating “late login” complaints to HR every day, and the organization can prove whether transport is the real root cause?
In India corporate ground transportation, buyers should define persona-specific KPIs that separate “transport performance” from “employee behavior” so shift leaders can see, in numbers, when late logins are actually caused by cabs and when they are not. Each function needs a small, shared KPI stack built on the same trip data but sliced for its accountability.
For large shift populations, most organizations benefit from a core, transport-owned reliability layer. This usually includes on‑time pickup and drop (OTP%), trip adherence rate, exception detection‑to‑closure time, and seat‑fill or vehicle utilization. These KPIs sit with the Facility / Transport Head and vendor command center, who are measured on early alerts, SLA compliance and rapid incident handling, not just “no complaints.” Data should come from the mobility platform and NOC, not from manual tallies.
HR and line managers need a different set of KPIs. They should track a commute experience index or complaint rate per 1,000 trips, but they should also see a split view that classifies each late login as “transport‑caused” or “user‑caused,” based on OTP, route adherence and app check‑in logs. That classification must be automated and visible in dashboards so HR can stop being the referee and instead point to auditable evidence when late login issues surface.
Finance, Procurement and ESG teams should receive their own KPI bundle tied to cost per trip, cost per kilometer, EV utilization ratio and emissions per passenger‑kilometer. These KPIs are not used to resolve daily escalations, but they close the loop when someone claims that “saving cost” or “going green” has degraded reliability. By linking commercial models and ESG metrics back to OTP and incident data, buyers can prove whether policy choices, not just vendors, are driving frontline pain.
To stop daily “late login” escalations, organizations typically need three design choices in their KPI framework:
- Use the same underlying trip ledger for all personas, with a clear data dictionary.
- Publish separate, role‑specific KPI views, with written ownership for each metric.
- Codify what counts as a “transport‑attributable delay” in SOPs, then automate that labelling in reports.
Once these rules are in place, control rooms and command centers can act on predictive alerts, HR can defend its position with data, and leadership can see, week by week, whether transport is genuinely the root cause of late shifts or just the most visible target.
For project/event transport, how do we set measurable ‘zero delay’ outcomes without pushing unsafe driving or impossible vendor promises?
B0233 Set ECS outcomes safely — In India project-site and event commute services (ECS), how should a project director and facilities lead map outcomes in the mobility service catalog so “zero-tolerance delays” are measurable without setting targets that force unsafe driving or unrealistic vendor commitments?
In India project-site and event commute services, project directors and facilities leads should define “zero-tolerance delays” as a governed outcome at the trip and shift level, then tie it to route design, buffers, and SOPs rather than to raw driver speed or impossible ETAs. Outcome mapping works when on-time performance is measured against realistic, pre-approved routing and shift windowing, and when penalties and incentives are linked to planning and exception management quality, not to unsafe driving behavior.
In practice, project and event commute services are time-bound, high-volume movements where zero-tolerance for delays is about execution certainty. That certainty is created through rapid fleet mobilization, temporary route design, peak-load handling, and dedicated control desks. Most organizations treat ECS reliability as a product of routing, capacity buffers, and command-center supervision rather than a driver-level target. A common failure mode is setting OTP targets that assume ideal traffic and no loading time, which pushes drivers into speeding and shortcutting route adherence.
To avoid that, project and facilities leaders can define ECS outcomes in the mobility service catalog with a small, explicit set of KPIs and constraints:
- Use On-Time Performance as “pickup/drop within an agreed shift window” based on shift windowing and traffic-aware routing.
- Couple OTP with Route Adherence Rate, so vendors are rewarded for sticking to approved routes instead of shaving time through risky detours.
- Include Trip Adherence Rate and exception detection-to-closure time so the command center is accountable for early alerts and rerouting when disruptions occur.
- Track Incident Rate and Driver Fatigue Index alongside OTP so any uptick in safety risk immediately flags that the plan or buffers are unrealistic.
Project and facilities leaders should then structure commercials and SLAs for ECS around these combined indicators. Outcome-based contracts can index payouts and penalties to OTP, Trip Adherence Rate, and exception-closure SLAs, but only within predefined safety and compliance guardrails such as escort rules, maximum duty cycles, and statutory limits. This balance ensures that “zero-tolerance delays” in project and event commute services signal non-negotiable planning quality and command-center responsiveness, without incentivizing vendors to compromise on safe driving, HSSE compliance, or driver rest norms.
In our RFP, how do we define the service catalog so vendors can’t blend everything into one SLA and we can score EMS vs CRD vs ECS vs LTR separately?
B0238 Prevent blended SLA gaming — In India corporate ground transportation RFPs, how should Procurement structure the service catalog mapping so vendors can’t hide weak capabilities behind blended SLAs, and the scoring model separates performance for EMS, CRD, ECS, and LTR clearly?
Procurement should define a granular, service-wise catalog and scoring grid that forces vendors to bid, commit SLAs, and evidence performance separately for EMS, CRD, ECS, and LTR. The RFP must ban cross-service “blended” SLAs and require discrete KPIs, rate cards, and governance models for each service vertical.
Procurement avoids blended SLAs by first using the industry-standard verticals as the backbone of the catalog. Employee Mobility Services (EMS) should be scoped around shift-based routing, rostering, OTP%, women-safety controls, and centralized NOC coverage. Corporate Car Rental (CRD) should be scoped around airport/intercity response times, executive experience standards, and centralized booking and billing. Event/Project Commute (ECS) should be scoped around rapid scale-up/scale-down capability, temporary routing and project control desks. Long-Term Rental (LTR) should be scoped around uptime, preventive maintenance, and cost predictability over 6–36 months.
A common failure mode is scoring “mobility” as one block. This allows vendors strong in one vertical to mask weakness in another. To avoid this, the RFP should require separate technical and commercial responses per vertical, and weight them independently in the evaluation matrix. Vendors should be required to provide service-specific references, KPIs (OTP, TAR, TFR, uptime), and command-center coverage aligned to each vertical’s operating model.
Procurement should also require service-wise SLA schedules and penalty ladders, with no scope to average OTAs/OTPs across EMS, CRD, ECS and LTR. The scoring model should award points for clarity of governance (e.g., separate playbooks for EMS shift operations versus ECS high-volume events), for evidence of centralized command-center operations, and for distinct routing, safety, and compliance mechanisms aligned to each service type.
- Define four separate service catalogs in the RFP: EMS, CRD, ECS, LTR, each with its own scope and KPI list.
- Mandate distinct SLA tables, rate cards, and case studies for each vertical.
- Score technical capability and past performance per vertical, not at an aggregate vendor level.
- Disallow blended “overall mobility” SLAs in contracts; enforce vertical-specific penalty and incentive clauses.
For shift EMS, how do we define and measure exception handling so vendors can’t say OTP is fine while our control room is flooded with issues?
B0239 Measure exception handling outcomes — In India shift-based EMS programs, how do operations leaders define outcomes for “exception handling” (no-shows, last-minute roster changes, vehicle breakdowns) in the service catalog mapping so the vendor can’t claim OTP success while the control room is drowning in exceptions?
Operations leaders in Indian shift-based EMS programs define “exception handling” outcomes as explicit, measurable SLAs in the service catalog so that OTP cannot be claimed in isolation from no-shows, late changes, or breakdowns. They treat exceptions as a governed part of the trip lifecycle with their own KPIs, closure timelines, and reporting, not as unpriced “best-effort” support.
In practice, operations leaders map each exception type in the catalog to a clear definition, trigger condition, and response SLA. No-shows are defined with rules for reallocation cut-off times, re-routing limits, and maximum tolerated no-show rate per route. Last-minute roster changes are mapped to response bands like “within X minutes before shift start” with guaranteed re-assignment or explicit “unable to serve” outcomes logged in the command center. Vehicle breakdowns are defined with a mandated standby or replacement ETA and a maximum exception-to-closure time, tracked separately from normal OTP.
To prevent vendors from claiming success while the control room is overwhelmed, leaders bind payments and performance reviews to combined metrics. OTP is reported alongside exception volume per 100 trips, exception closure SLA adherence, and impact on Trip Adherence Rate. Command center dashboards and indicative management reports highlight exception load, escalation count, and time-to-recover as core observability signals. Quarterly governance and business continuity reviews then use these exception KPIs, together with business continuity playbooks and on-time service delivery management data, to decide incentives, penalties, or vendor rebalancing.
For airport/intercity travel, how do we define delay-handling outcomes so flight delays and reroutes don’t become billing disputes every month?
B0240 Define delay-handling outcomes — In India corporate airport/intercity CRD, how should Finance and Admin define outcomes for “delay handling” (flight delays, reroutes, last-minute changes) in the service catalog mapping so disputes don’t turn into monthly billing chaos?
In India corporate airport and intercity CRD, Finance and Admin should define “delay handling” as a set of explicit, time‑banded service outcomes with pre‑agreed charging rules and evidence requirements. Outcomes must be tied to measurable events such as actual flight time, driver reporting time, free wait windows, and capped chargeable wait, so every delay case lands in a clear bucket instead of becoming a monthly exception debate.
Finance and Admin teams reduce billing chaos when “delay handling” is framed as part of the governed CRD operation, not as ad‑hoc goodwill. Airport and intercity SLAs in this domain already emphasize flight‑linked tracking, delay handling, and predictable service delivery, so the same logic should be hardened into the service catalog with corresponding commercial models and audit trails. This aligns with outcome‑based procurement, where payments are indexed to reliability (OTP/OTD), trip adherence, and closure SLAs, rather than to unstructured time and distance arguments.
Disputes typically arise when vendors bill extra wait time, additional trips, or dead mileage without a shared definition of what constitutes a justified delay, what is included in base commercials, and what is an approved exception. Clear delay outcomes protect both sides when integrated with platformized booking and spend control, centralized command‑center observability, and data‑driven cost visibility.
Key elements Finance and Admin should encode in the service catalog for airport/intercity CRD are:
- Separate SKUs for “standard” vs “disrupted” trips, with explicit inclusion of a free airport wait window and a defined, capped paid wait band after that.
- Rules for flight delays and reroutes that link billing to airline data and trip logs, not to verbal claims, with pre‑approved paths for major disruptions (e.g., reschedule vs cancellation vs re‑assignment).
- Conditions under which a no‑show or late cancellation is vendor‑billable versus absorbed, using defined time thresholds and documented communication attempts.
- Documentation and evidence requirements for any non‑standard charge, using GPS/trip logs and centralized dashboards as the single source of truth.
These outcomes should be reflected in the commercial models (per‑km, trip‑based, FTE, or pay‑per‑usage) and in the vendor governance framework. When delay handling is codified like this, Finance gains predictable, defensible billing and Admin gains operational clarity, which together prevent monthly reconciliations from turning into recurring conflict.
With multiple vendors, how do we map outcomes so our central control room can pin accountability correctly and avoid constant finger-pointing?
B0241 Clarify accountability in multi-vendor — In India corporate employee transport, what’s the right way to map outcomes for multi-vendor operations in the service catalog so a central NOC can hold the correct vendor accountable without turning every incident into a blame game?
In India corporate employee transport, outcomes in a multi-vendor setup need to be mapped at the service-catalog level to clear, measurable KPIs per route, shift, and service type, with a single “owning” vendor tagged in advance for each trip or route. The central NOC can then use trip data, SLA baselines, and pre-agreed exception codes to drive accountability, instead of running subjective, post-incident blame contests.
A practical pattern is to define outcome metrics directly in the service catalog for each service line, such as EMS, CRD, ECS, or LTR. Each catalog entry should specify OTP%, Trip Adherence Rate, safety and compliance requirements, and experience KPIs. These outcomes should cascade down to vendor-level SLAs through dashboards like the Transport Command Centre view and the single-window dashboards described in the collateral, so that NOC teams always see “who owns what” in real time.
A common failure mode is vague or overlapping responsibility across fleet owners, app providers, and EV/charging partners. This is reduced when every route or shift has one primary vendor-of-record linked in the catalog, along with clear tags for sub-vendors or infra partners and a documented escalation matrix. The NOC can then use alert systems, CO₂ and OTP tracking dashboards, and audit-ready logs to classify incidents by root cause code and assign them to the tagged owner, while still sharing data-driven insights across vendors to fix systemic issues rather than trading accusations.
images:
For shift EMS, how do we define outcomes for control-room response so fewer 3 AM calls is measurable and not reliant on a few heroes?
B0244 Measure NOC responsiveness outcomes — In India corporate shift-based EMS, how should a facility/transport head map outcomes for control-room responsiveness (acknowledge, triage, resolve) so the ‘no 3 AM calls’ promise is measurable and not dependent on heroic individuals?
In India EMS operations, a facility or transport head should map control-room responsiveness as three distinct, SLA-bound stages per incident ticket: acknowledge, triage, and resolve. Each stage needs its own timer, ownership, and evidence, so “no 3 a.m. calls” becomes a measurable outcome instead of a personal favour from one heroic supervisor.
First, the facility head should define what counts as an “incident” for EMS control-room purposes. This includes missed or delayed pickups, GPS or app failures, escort or women-safety breaches, vehicle breakdowns, and route deviation alerts raised by NOC tools or SOS systems. Every such event should open a ticket in a central command-center system, not be handled ad hoc over calls or WhatsApp.
Second, the acknowledge stage should be measured as the time from alert creation to first human confirmation. Control rooms should track a hard SLA for acknowledgement latency and staff should log how employees are informed. This shifts the burden from employees chasing updates to the command center pushing clear, time-stamped communication.
Third, the triage stage should be defined as the time from acknowledgement to a documented action plan. The control room should categorize severity, confirm whether alternative routing, vehicle replacement, or escort changes are needed, and update the ticket with decisions taken. Measurable triage SLAs help ensure that night-shift issues are stabilized quickly rather than drifting until they escalate to leadership.
Fourth, the resolve stage should be measured as time to restored service and closure. For shift-based EMS, resolution is not just “cab started moving again.” Resolution is when the employee is safely picked up or dropped, any escort or women-safety requirement is confirmed met, and the incident is logged with root-cause notes. Tracking resolution SLAs by incident type lets the facility head show that the system handles recurring issues predictably, even when specific individuals are off-duty.
To prevent dependence on a few “heroes,” the facility head should design staffing and SOPs so at least two levels in the command hierarchy can perform acknowledge, triage, and resolve for any timeband. The MSP governance structures and micro functioning of the command centre described in the collateral show how centralized and location-specific command centers collaborate to ensure round-the-clock coverage, escalation, and compliance. When combined with an Alert Supervision System, EV/ICE telematics dashboards, and an SOS control panel, this creates a repeatable, tool-backed process where responsiveness is driven by alerts and SLAs instead of individual memory or goodwill.
The facility head should also align these responsiveness metrics with broader employee mobility KPIs like OTP, safety incident rate, and escalation count. By linking control-room SLAs to reduced night-shift complaints and fewer HR escalations, the organization can verify that “no 3 a.m. calls” is not just a slogan but a predictable operating outcome under their EMS governance model.
With multiple vendors, how do we define KPIs so no one can game OTP or close issues without actually fixing them?
B0262 Prevent KPI gaming by vendors — In India corporate ground transportation with multi-vendor mobility, how should Procurement define service-line KPIs so vendors can’t game the metrics—for example, meeting OTP by skipping low-priority pickups or closing tickets without real resolution?
In multi-vendor corporate mobility, Procurement must define KPIs as outcome-linked, coverage-aware, and cross-validated across data sources, so a vendor cannot improve one metric by quietly degrading another. KPIs need clear scope definitions, dependency rules, and penalty logic that punish “shortcut behaviors” such as skipping pickups, selective routing, or cosmetic ticket closure.
Procurement should first define OTP and reliability against the complete, approved roster and passenger manifest. OTP must be calculated only when the cab serves all allocated pickups within the route and shift window. Trips where employees are left out, manifests are manually altered, or last-minute “no-show” markings do not have supporting HRMS or app evidence should be excluded from OTP calculations and flagged as exceptions.
Ticket closure KPIs should be tied to verifiable resolution, not just status changes in a system. Resolution time needs measured from alert creation (for example, from the Alert Supervision System or Transport Command Centre) to documented corrective action. This includes proof from GPS logs, driver and employee app feedback, and central command-center notes rather than relying on the vendor’s own narrative.
To further reduce gaming, Procurement can require a small, explicit set of cross-checks for every core KPI. OTP should be triangulated with roster data from HRMS integration, employee app check-ins, and NOC dashboards. Complaint closure rates should be cross-checked against recurring incidents on the same route, driver, or vehicle, using structured reports like the Indicative Management Report and single-window dashboards. Safety and compliance metrics must be supported by centralized compliance management logs, driver and fleet induction records, and periodic audit reports.
Procurement can then embed these definitions into contracts as part of a clear Vendor Governance Framework. KPIs should be linked to incentives and penalties only when data passes integrity checks such as audit trail completeness, tamper-proof GPS evidence, and reconciliation with billing. Vendors whose data shows frequent overrides, suspiciously low incident rates, or repeated route “optimizations” that conflict with employee or command-center feedback can be downgraded in performance tiers or face commercial consequences.
Finally, Procurement should insist on transparent, technology-backed observability. Centralized command-center dashboards, alert supervision systems, and data-driven insights platforms provide independent visibility into route adherence, safety events, and customer satisfaction. This enables Procurement, HR, and Transport Heads to jointly review KPI performance and detect patterns of metric manipulation early, before they translate into safety incidents, employee dissatisfaction, or audit issues.
For event/project commutes with tight timelines, how do we define KPIs like staging readiness and supervisor coverage so the project team can enforce accountability?
B0265 ECS peak-hour accountability KPIs — In India event and project commute services (ECS) with zero-tolerance delay windows, how should the service catalog define ‘time-bound delivery’ KPIs (staging readiness, dispatch adherence, on-ground supervisor coverage) so the Project Head can hold the mobility provider accountable during peak movement hours?
In India event and project commute services, ‘time-bound delivery’ KPIs need to translate zero‑tolerance delay windows into a few simple, auditable metrics around when vehicles are ready, when they move, and who is in control on the ground. The service catalog should therefore define hard, time-stamped KPIs for staging readiness, dispatch adherence, and on-ground supervision, with clear percentage targets and evidence sources for each peak movement window.
For staging readiness, the catalog should specify a “ready-to-roll” time for every batch of vehicles before the first planned boarding. This is usually expressed as a percentage of vehicles physically staged at the designated holding area, with driver and compliance checks completed, at least X minutes before the first scheduled pickup. The KPI should read as: “≥ 98% of event/project vehicles must be staged and logged as ready at the holding point 30 minutes before the first scheduled departure in that wave.”
For dispatch adherence, the catalog should define a maximum variance between scheduled and actual departure times for each wave, tied to OTP expectations at the venue or plant. The KPI should measure the share of trips dispatched within a narrow band, for example: “≥ 95% of departure events during peak movement windows must leave the dispatch gate within ±5 minutes of the locked schedule, as per GPS and trip logs.” This keeps room for minimal operational flex without diluting the zero‑tolerance intent.
For on-ground supervisor coverage, the catalog should mandate minimum supervisor-to-vehicle ratios and continuous physical presence across all critical nodes. The KPI should define: “Supervisors must be present and logged in at all predefined hubs, gates, and loading points from 30 minutes before the first wave until 30 minutes after the last wave, with a maximum coverage gap of 0 minutes.” Supervisor presence should be captured via check-in logs, time-stamped photos, or NOC acknowledgments, so that coverage is provable during audits or post‑event reviews.
To make these KPIs actionable for a Project Head, the catalog should specify three elements for each metric: the measurement method (GPS/timestamps/NOC logs), the reporting frequency during the event (e.g., live dashboard plus wave-wise SMS/WhatsApp/NOC updates), and an exception-closure SLA for any deviation detected during peak movement. This allows the Project Head to hold the mobility provider accountable in real time, not just after the event.
Useful adjacent dimensions include explicit linkage of these KPIs to commercial penalties or earn-backs, integration with a temporary project/event control desk, and alignment with the broader event SLA set (overall OTP to venue, no-show rate, and incident-response SLAs). Together, these elements turn “time-bound delivery” from a generic promise into a concrete set of operational commitments that can be enforced during high-pressure peak movement hours.
For business-park shuttles, how should we define manifests/boarding proof so HR can handle complaints and compliance has audit-ready records?
B0266 Audit-ready shuttle manifest rules — In India enterprise mobility where pooled shuttles serve a business park, how should the service catalog define boarding verification and manifests so that HR can answer employee grievances while Legal/Compliance can rely on an auditable record during investigations?
In pooled shuttle programs for Indian business parks, boarding verification and manifests need to be defined as formal “trip evidence objects” with clear data fields, capture methods, and retention rules. The service catalog should treat them as mandatory, standardized controls that support employee grievance resolution for HR and audit-ready investigation for Legal/Compliance.
The service catalog should define a boarding verification standard for every EMS or shared shuttle trip. Each trip should have a passenger manifest with employee ID, name, route, scheduled stop, and shift window. The catalog should mandate that boarding is confirmed through one primary method, such as app check-in, QR scan, OTP, or RFID/attendance integration. There should also be a fallback method for degraded conditions, such as supervisor-verified manual boarding with timestamp and GPS-backed duty slip, which is later digitized. This ensures that command-center operations and trip lifecycle management always have a verifiable record.
For manifests, the catalog should specify that the master passenger list is generated from HRMS-linked rosters before dispatch. This list should be frozen at a defined cut-off, with any changes logged as explicit exceptions. Each completed trip must produce a “final manifest” that records who was actually onboard, with timestamps at boarding and de-boarding, vehicle and driver identifiers, route version, and incident flags like SOS triggers, no-shows, or route deviations. The record should be tied to GPS logs and trip adherence audits so Legal and Security can reconstruct events during investigations.
To make HR grievance handling defensible, the catalog should define a standard trip evidence pack. For any complaint—such as “cab never came” or “I was dropped late”—HR should be able to pull a single record that includes the final manifest, OTP/check-in logs, ETA and actual-arrival times, GPS trace, and any command-center interventions. This supports the employee experience narrative and allows HR to answer leadership questions with data instead of fragmented anecdotes.
For Legal/Compliance, the catalog should state auditability requirements around these records. This includes minimum retention periods aligned with incident and labour law expectations, immutable or tamper-evident logs for manifests, and chain-of-custody practices for trip data. The design should emphasize audit trail integrity with clear versioning when manifests are corrected, and an escalation matrix for re-opening or re-verifying data in case of disputes. This moves the organization from episodic audits to continuous assurance.
Operationally, the catalog should also define how boarding verification interacts with safety controls, such as female-first policies, escort compliance for night trips, and geo-fencing. For example, the system should not allow trip closure if the manifest shows an unescorted woman on a night route that requires an escort, and any override should create an auditable exception entry with approver identity and reason. This linkage helps EHS and Security prove that escort policies are enforced in practice.
To keep the control-room manageable, the catalog should specify exception alerts instead of manual checking for every trip. Typical exceptions might include passengers on the roster but not boarded, un-rostered passengers onboard, manifest–GPS mismatches, or trips closed without mandatory boarding verification. These alerts should surface in the centralized command center and be bound to closure SLAs so the Facility/Transport Head can maintain control without constant firefighting.
A practical service catalog entry can be structured around a few concrete definitions:
- “Standard Boarding Verification Control” with accepted mechanisms, fallbacks, and when each is used.
- “Canonical Trip Manifest Schema” listing mandatory fields, ID linkages to HRMS, and time/geo data.
- “Trip Evidence Pack” as the default bundle HR and Legal receive when a case or grievance is opened.
- “Retention and Access Policy” setting how long data is kept, who can access it, and how it is logged.
- “Exception Typology & SLA” defining which anomalies must be investigated, by whom, and within what time.
This approach aligns EMS governance, command center operations, and compliance automation with HR’s need for quick, credible answers and Legal’s requirement for defensible, auditable records.
How do we set up the service catalog so escalation and accountability are clear for EMS vs CRD vs ECS, so I’m not the default 2 a.m. call for everything?
B0275 Service-line accountability and escalation — In India corporate ground transportation operations, how should the Facilities/Transport Head design a service catalog so escalation paths and accountability are explicit by service line (EMS vs CRD vs ECS), reducing the ‘everyone calls me at 2 a.m.’ failure mode?
A Facilities/Transport Head should design the service catalog so that each service line (EMS, CRD, ECS, LTR) has its own clearly named offering, mapped SLAs, and a documented escalation tree that is visible to HR, Security, and vendors. The catalog must separate who owns day-shift vs night-shift issues, who handles tech vs fleet vs safety incidents, and what “good” looks like per service line in OTP, safety, and cost terms.
A common failure mode is a single generic “transport service” description that hides differences between EMS, CRD, and ECS. That forces all escalations to default to the Transport Head. A better pattern is to define 3–4 catalog entries such as “Shift EMS,” “Executive CRD,” and “Project/ECS” that each specify: request channels, response-time SLA, primary owner (vendor vs in-house desk), and the command-center queue that monitors exceptions.
Accountability becomes stable when escalation paths follow the operating reality. For EMS, the service catalog should anchor on shift windows, OTP%, women-safety protocols, and a 24x7 NOC as first responder. For CRD, it should prioritize response-time and airport/intercity SLAs with the travel desk or vendor SPOC as the first escalation level. For ECS, it should point to an event/project control desk and time‑bound execution commitments.
A practical catalog entry for each service line should include at minimum:
- A short description of scope and who can use it.
- Standard SLAs (OTP%, response time, safety/compliance baselines).
- Primary ownership (internal role) and vendor of record.
- Escalation matrix with L1/L2/L3 roles and time thresholds.
- Linked SOP references for incidents, re‑routing, and BCP actions.
This structure shifts late‑night calls to the right first‑line owner, while keeping the Transport Head as governance and last‑resort escalation, not default fire‑fighter.
images:
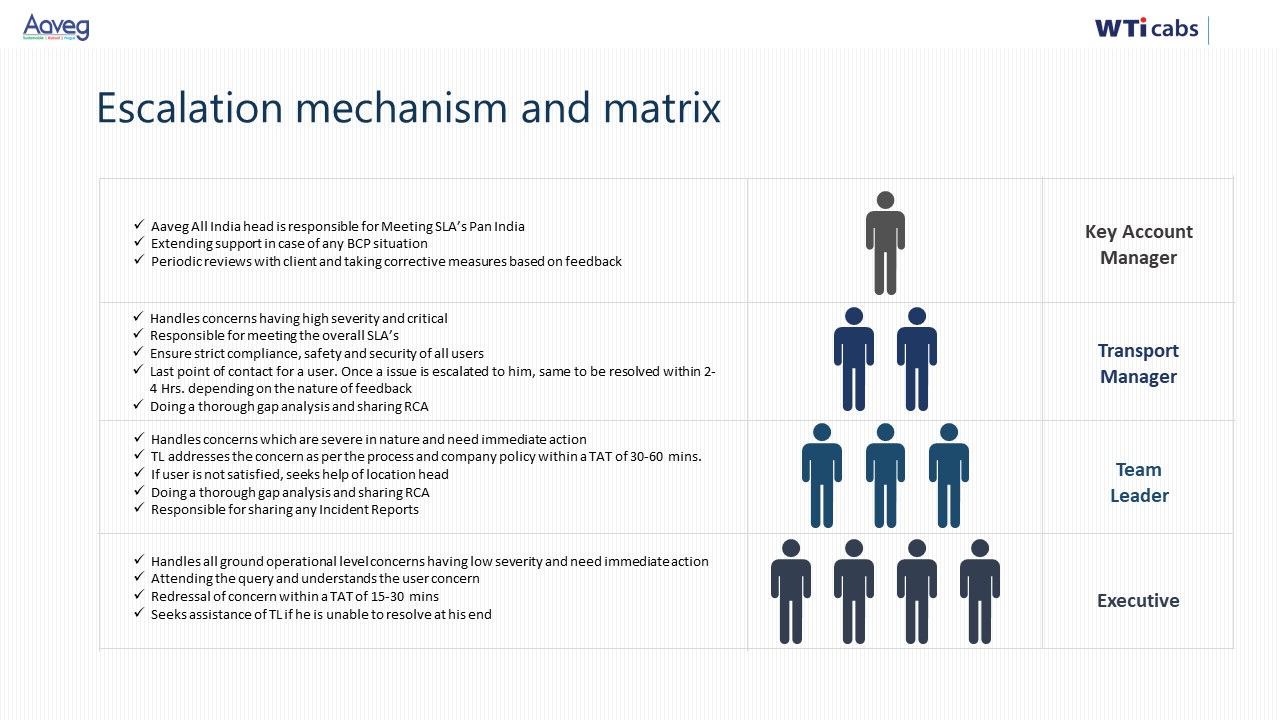
How do we set KPIs so we don’t look green on the dashboard while employees lose trust because of small repeated issues like cleanliness or behavior?
B0276 Prevent silent SLA deterioration — In India employee transport for pooled cabs and shuttles, how can we define service-catalog KPIs that prevent ‘silent deterioration’—where operations hits SLA on paper but employee trust drops due to cleanliness, behavior, or repeated minor delays?
Service-catalog KPIs that prevent “silent deterioration” in Indian employee transport must combine hard SLAs with soft-experience and early-warning indicators. Operations needs parallel KPIs for reliability, safety, cleanliness, driver behavior, and complaint handling so that pooled cabs and shuttles cannot “pass” on paper while trust erodes on the floor.
Most organizations avoid silent deterioration when each catalog item in Employee Mobility Services includes a small, fixed KPI set that blends quantitative thresholds and continuous feedback. Reliability needs OTP broken into bands, with stricter KPIs on first/last-pickup legs and recurring-delay flags at route level. Employee experience needs a commute-experience index fed by in-app feedback, no-show and drop-off complaints, plus a minimum sample size per route and per shift. Cleanliness and vehicle condition need binary “fit for duty” checks tied to fleet compliance audits and random route adherence audits rather than only annual fitness or paper-based logs.
A common failure mode is treating women-safety and behavior as policy statements instead of measurable KPIs. Service catalogs are more resilient when they define escort compliance, SOS response time, incident-to-closure SLA, and driver training completion as tracked metrics, and when these are linked to vendor scorecards and outcome-based commercials. Centralized command centers then use exception dashboards to surface recurring “minor” issues, such as 5–10 minute delays or repeated cleanliness complaints on specific vendors or timebands, before they become HR escalations.
Practical catalog KPIs that reduce silent deterioration include:
- On-Time Performance bands with route-level recurring delay flags.
- Commute Experience Index per site, route, and timeband with minimum monthly response counts.
- Cleanliness and comfort pass rate from random audits plus employee flags, mapped to specific vehicles.
- Behavior and safety scores from employee feedback, incident logs, and driver compliance status.
- Complaint closure SLA with aging buckets and escalation rules for repeat patterns.
How do we set shared KPIs like OTP/attendance so HR and ops don’t argue about ownership when Finance asks who’s accountable?
B0277 Shared KPI ownership rules — In India corporate mobility services, how should a service catalog handle shared KPIs across departments—like OTP impacting attendance—so HR and Operations don’t fight over ownership when the CFO asks, ‘Who is accountable for this number?’
In India corporate mobility programs, shared KPIs like OTP must be designed as “joint outcomes with split responsibilities” inside the service catalog, so every department sees its own accountable slice of the number and no one has to defend it alone to the CFO. The catalog should express each KPI as a single metric with a defined owner, but backed by transparent sub-metrics that map to HR, Transport, Procurement, and the vendor.
A common failure mode is when OTP or attendance impact appears as one undifferentiated percentage. HR then gets blamed for late logins, while Operations and vendors point to traffic, driver shortages, or app issues. In a governed service catalog, OTP is decomposed into operational drivers such as routing adherence, driver availability and GPS uptime, and policy drivers such as roster finalization cut-off, manager approvals, and no-show behavior. The top-line OTP remains visible to leadership, but the sub-metrics make root cause and ownership auditable.
A practical catalog entry for a shared KPI usually specifies four items. There is a definition that ties the KPI to business impact, such as OTP → attendance stability. There is a formula and data source that show how the number is calculated and from which systems. There is a responsibility matrix that assigns Transport and vendor to operational drivers, HR to policy and roster discipline, and Procurement to SLA construct and penalties. There is an escalation and review cadence that sets which forum examines the KPI and which corrective levers each function controls. This structure allows the CFO to see one coherent number while also seeing that accountability is distributed, evidence-backed, and contract-aligned rather than politically negotiated.
For exec car rentals, how do we define response-time KPIs separately for on-demand vs scheduled airport pickups so vendors can’t mask issues in a blended number?
B0280 Split CRD response-time KPIs — In India corporate car rental services for executives, how should the service catalog define ‘response time’ KPIs differently for on-demand bookings versus scheduled airport pickups so Admin can govern service fairly and vendors can’t hide behind one blended metric?
In corporate car rental for executives in India, the service catalog should define separate, clearly named response-time KPIs for on‑demand city trips and for scheduled airport pickups, with different start points, thresholds, and penalties. A single blended “response time” metric usually hides airport SLA failures and makes governance and vendor comparison unfair.
For on‑demand executive bookings, response time is best defined as the time from booking confirmation to vehicle reporting at pickup. This KPI should use short, tiered thresholds based on city and timeband, because Admin needs fast recoveries during peak hours and night shifts. It should link directly to dispatch behavior and fleet availability, and it should be measured only on trips that were actually requested as on‑demand, not on scheduled jobs.
For scheduled airport pickups, response time should be defined as punctuality against a committed reporting window at the terminal or hotel, with explicit rules for flight-linked tracking and delay handling. This KPI should focus on “reporting before scheduled time” and “no last‑minute car swaps” rather than raw minutes from dispatch, because executives and travel desks care about predictability at fixed times. It should be reported separately for arrivals and departures to surface missed meets, even when vendors dispatch early.
To keep vendors from hiding behind one blended metric, the service catalog should specify distinct KPI names, counting rules, and dashboards for each category, and it should forbid averaging them into a single “overall response time.” Penalties and incentives should be calculated per KPI stream, so good on‑demand performance cannot offset weak airport performance, and Admin can run clean vendor scorecards and fair QBRs.
images:
Executive alignment, persona KPIs, and outcome optics
Ensures executive dashboards reflect meaningful outcomes for large shifts and VIP rides while maintaining credibility with HR and Finance; prevents bias toward any single group.
For women’s night-shift transport, how do we set outcomes that create accountability without pushing vendors to hide incidents?
B0203 Women-safety KPIs without hiding — In India employee mobility services (EMS), how can a CHRO set outcome KPIs for women’s night-shift transport (escort compliance, route approvals, SOS response) in a way that creates real accountability without incentivizing under-reporting of incidents?
In India EMS programs, CHROs get better outcomes and honest reporting when women’s night‑shift transport KPIs measure both incident rates and incident handling quality, and when targets are set on response and auditability rather than “zero incidents on paper.” Pure “zero‑incident” targets almost always push vendors and internal teams toward suppression or reclassification of events.
CHROs create real accountability when safety KPIs explicitly span four areas. These areas are escort and chauffeur compliance, route and roster governance, SOS and escalation handling, and evidence quality for audits and investigations. Each area needs outcome measures, not just checkbox processes.
Escort compliance should be tracked as “escort-required vs escort-provided” by route and time-band. Automated manifests, GPS logs, and centralized compliance dashboards should be used to verify adherence instead of relying only on declarations. Route approvals should be tied to a rule-based routing engine and geo-fencing, with random route adherence audits and exception logs reviewed by Security or EHS.
For SOS and incident response, CHROs should prioritize metrics like median time from SOS to first human contact, time to safe closure, and employee satisfaction with incident handling. These metrics encourage fast and empathetic response. They also discourage burying tickets because unresolved events directly show up in dashboards and QBRs.
To reduce under-reporting, the performance framework should reward transparent reporting and continuous assurance. This is easier when there is a centralized command center with real-time alerts, a documented safety escalation matrix, and an audit-ready trail of trip and incident data. HR should work with Security, IT, and Transport to ensure that every SOS, geo-fence violation or fixed-device tampering alert flows into a single window system and is visible across stakeholders.
Structuring contracts and internal scorecards around a balanced set of KPIs can support this approach. CHROs can combine lag indicators such as verified incidents per 10,000 trips with lead indicators such as onboarding and refresher completion for drivers, escort rosters locked before shift start, and route approval SLAs. They can then add “quality of closure” measures, such as complaint closure time and post-incident feedback scores from affected employees.
Finally, CHROs should design incentives and penalties around behaviors that improve safety culture instead of only focusing on the headline incident number. Vendors and internal teams can be rewarded for high audit trail integrity, timely escalation to the command center, and willingness to self-report near misses. This shifts the system from fear of disclosure to a culture where early visibility of risk is seen as professionally safe and operationally expected.
For campus pooled mobility, how do we measure if mapping is improving experience—boarding friction, predictability, grievance closure—beyond anecdotes?
B0208 Measure EX improvements objectively — In India campus or business-park pooled mobility (shuttles + cabs), how can a Facilities head measure whether the service catalog mapping is improving employee experience (boarding friction, predictability, grievance closure) without relying on anecdotal complaints?
In campus or business-park pooled mobility, a Facilities head can move beyond anecdotal complaints by defining a small, fixed KPI set for “experience at the edge” and wiring those KPIs directly to shuttle/cab operations, apps, and command-center logs. The same telemetry that powers routing, tracking, and SOS can be reused to measure boarding friction, predictability, and grievance closure in a repeatable way.
The starting point is to treat employee experience as a measurable output of the ETS operation cycle rather than a survey-driven afterthought. Trip manifests, real-time tracking, no-show reports, and exception logs already exist in employee, driver, and admin apps. These can be combined into simple, shift-wise metrics such as check-in success rate, wait-time at stop, and number of manual interventions per route. This turns everyday control-room data into a live “Commute Experience Index” instead of relying on who shouts the loudest on email.
To link this back to service catalog mapping, each route and slot in the shuttle-plus-cab catalog should carry attributes like timeband, capacity, expected load, and type of service (shuttle vs point cab). The Facilities head can then compare experience metrics across catalog entries and timebands. Routes that routinely need ad-hoc cabs or manual rescheduling indicate poor service mapping even if complaint volume is low. Routes where boarding is smooth, ETA adherence is high, and exceptions are auto-resolved without calls suggest that the catalog is aligned with real demand.
A practical, low-noise way to track this is to set up a standard weekly “experience scorecard” at the command center level, using existing ETS dashboards, Alert Supervision System alerts, SOS panel data, and complaint tickets. Once the pattern is visible, Facilities can tune the catalog calmly: shifting frequencies, resizing vehicles, or switching marginal timebands from shuttle to pooled cabs. Over a few cycles, improving scores with stable or lower exception volume is a reliable signal that the service catalog mapping is reducing daily firefighting instead of just moving problems around.
As leadership, what outcomes should we expect to see from service catalog mapping without getting dragged into operational noise?
B0221 Executive-level outcomes from mapping — In India enterprise-managed employee transport (EMS), what should a CEO or COO expect to see as the “executive dashboard” outcomes from service catalog mapping—without drowning leadership in operational noise?
In India enterprise-managed employee transport, CEOs and COOs should see a small, fixed set of outcome KPIs on the executive dashboard that roll up the full EMS service catalog into reliability, safety, cost, ESG, and experience signals. The dashboard should expose how EMS is performing against business goals, while hiding routing, rostering, and vendor-level noise behind drill-down layers.
A concise EMS executive view usually focuses on five outcome clusters. Reliability is summarized through on-time performance percentage, trip adherence rate, exception detection-to-closure time, and high-level route adherence audit score. Safety and duty of care appear as incident rate, women night-shift compliance status, driver credential currency, and integrity of audit trails for trips and SOS events.
Cost and TCO are surfaced via cost per employee trip, cost per kilometer, dead mileage trend, and utilization metrics like vehicle utilization index and trip fill ratio. ESG and EV outcomes are shown through EV utilization ratio, gCO₂ per passenger-km, and a carbon abatement index that ties commute emissions to Scope 3 narratives. Employee experience is represented by a commute experience index or NPS, complaint closure SLA compliance, and adoption or attendance deltas linked to transport reliability.
Service catalog mapping should bind these KPIs back to EMS, CRD, ECS, and LTR entitlements, but at the CEO level only the outcomes and gaps are visible. Detailed views of shift windowing, routing, vendor tiers, and command-center alerts should sit one or two clicks below, owned by Transport, HR, and Procurement rather than the corner office.
images:
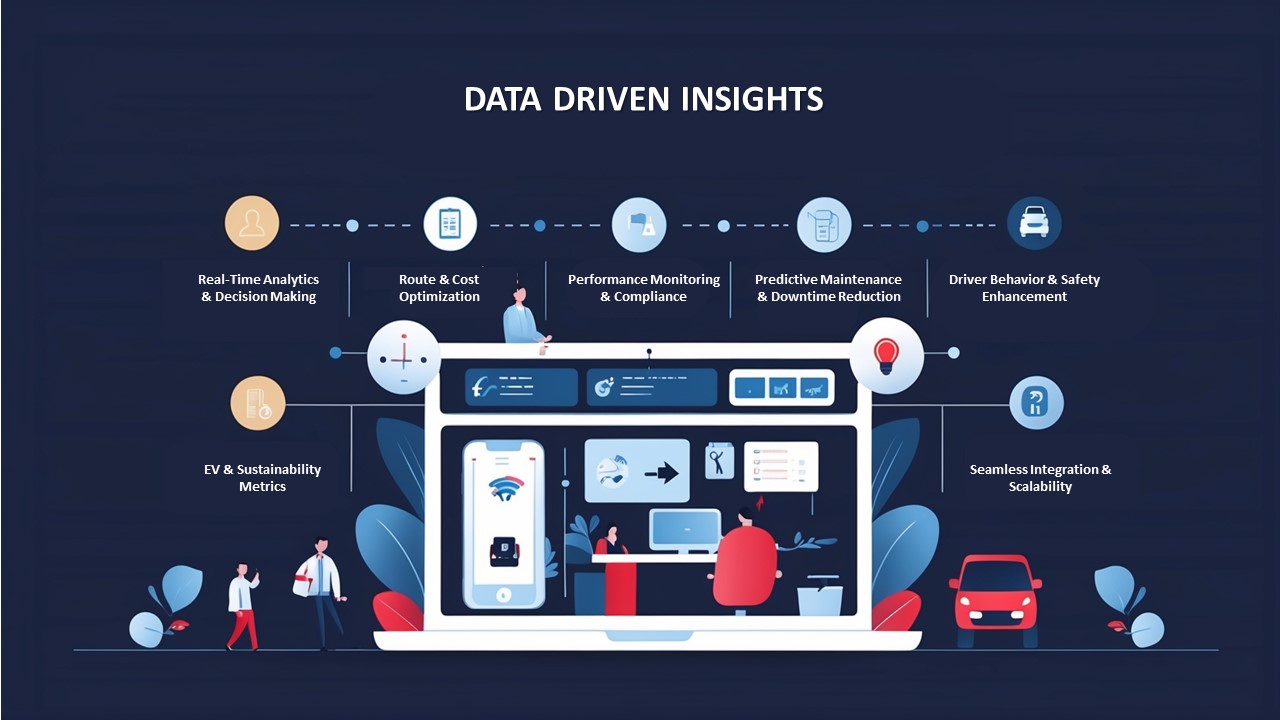
How do we set different outcomes for large employee shifts vs executive rides so we don’t improve one and upset the other?
B0229 Balance exec vs shift outcomes — In India corporate employee transport and executive car rental, how do CHRO and Facility/Transport leaders define separate outcomes for “large shift populations” versus “executive rides” so the program doesn’t optimize for one group while quietly failing the other?
For Indian enterprises running both large employee shifts and executive car rental, CHRO and Facility/Transport leaders define separate outcomes by treating “shift populations” and “executive rides” as two distinct service lines with different success metrics, SOPs, and governance, even if they share vendors and platforms. Programs that fail usually apply one generic standard to both, which improves one side while creating silent dissatisfaction or risk on the other.
For large shift populations under Employee Mobility Services, CHROs anchor outcomes in safety, predictability, and attendance stability. Facility/Transport leaders focus on end-to-end shift-based route planning, rostering, pooled routing, on-time performance, and women-safety compliance. The operational emphasis is on pooled cabs, high seat-fill, reduced dead mileage, central or site-based NOC monitoring, and auditable SOS and escort mechanisms.
For executive rides under Corporate Car Rental, CHROs and Admin/Travel desks define outcomes around experience and dependability for official business travel. Facility/Transport leaders emphasize centralized booking, SLA-bound response times, airport and intercity punctuality, standardized vehicles, and service consistency. The focus is not on pooling or cost per seat, but on predictable response, flight-linked tracking, and minimal friction for senior users.
A common failure mode is forcing shift-style pooling logic and cost KPIs onto executive rides, which degrades perceived status and reliability. Another failure mode is applying executive-style on-demand behavior to large shifts, which overwhelms rostering, reduces seat-fill, and increases cost per employee trip.
To avoid optimizing one segment at the expense of the other, mature organizations usually:
- Define separate KPI sets. Shift mobility is measured on OTP for shifts, Trip Adherence Rate, seat-fill, safety incidents, and attendance impact. Executive mobility is measured on response-time SLAs, vehicle quality compliance, airport pickup reliability, and complaint rates.
- Run differentiated routing and dispatch rules. Shift routes use pooling, shift windowing, and dynamic route recalibration. Executive rides use on-demand dispatch with priority rules and airport-linked triggers.
- Use one governed platform but role-based service catalogs. The same command center, data layer, and apps support both, while EMS and CRD each have distinct service entitlements and escalation paths.
- Review performance separately in governance forums. CHRO and Facility/Transport leaders examine shift operations with HR and Security, and executive rides with Admin/Travel and Finance, so issues from one group do not get masked by the other’s aggregate metrics.
For airport/intercity bookings, what outcomes should Travel/Admin define so executive experience isn’t just a vague promise and we can manage it properly?
B0232 Define executive CRD outcomes — In India corporate airport pickup and intercity Corporate Car Rental (CRD), what outcome definitions should a travel desk and admin team use in the service catalog mapping to prevent “executive experience” from becoming a vague promise that collapses into complaints and escalations?
In India corporate airport pickup and intercity CRD, “executive experience” needs to be defined as a small set of measurable trip outcomes, not attributes of the car or driver. Admin and travel desks should codify these outcomes in the CRD service catalog and link them to SLAs, billing, and vendor scorecards so every complaint maps to a clear metric gap.
The most stable pattern is to group outcomes into four buckets. The first is reliability. This uses on-time performance for pickup and drop, trip adherence rate for planned routing, and exception detection-to-closure time for issues like no-shows or vehicle substitutions. The second is service quality. This uses vehicle standard compliance, chauffeur behavior scores, and closure SLAs for executive complaints. The third is predictability of cost and process. This uses pre-agreed rate cards for airport and intercity, clean linkage of trip logs to invoices, and a low dispute rate per 100 trips. The fourth is safety and duty of care. This uses incident rates, credentialing currency for drivers and vehicles, and auditability of trip logs including OTP, GPS traces, and approvals.
A travel desk can operationalize these outcomes by defining, per service type, a small set of contract-level KPIs with thresholds and remedies. For example, airport pickups can carry a strict pickup OTP band around flight ETA, mandatory flight tracking, and a response-time SLA for last-minute changes. Intercity CRD can carry limits on dead mileage and guaranteed vehicle category. These outcomes should be visible in admin dashboards, reconciled in billing, and reviewed in vendor QBRs so “executive experience” translates to verifiable reliability, safety, and cost control rather than subjective expectations.
How can we translate commute experience outcomes into credible exec-level language so HR/Ops get support, without the CFO feeling it’s fluff?
B0248 Translate outcomes for executives — In India corporate ground transportation, how can a Head of Marketing or Internal Comms map service-line outcomes (especially employee commute experience) into credible executive language so HR and Operations gain a ‘seat at the table’ without overselling or triggering skepticism from the CFO?
In Indian corporate ground transportation, a Head of Marketing or Internal Comms helps HR and Operations gain a “seat at the table” by translating commute outcomes into a small set of executive-safe KPIs that link directly to risk, cost, and credibility rather than feelings or features. The language must connect employee commute experience to on-time performance, safety assurance, cost per trip, and ESG disclosure in a way the CFO can defend in an audit.
The most credible narratives start from operational facts. These facts include on-time arrival rates, incident-free shifts, driver and fleet compliance currency, and reduction in fire‑drill escalations to leadership. Marketing then reframes these as business outcomes that matter to CHRO, CFO, and ESG leaders, such as improved attendance stability, lower volatility in transport costs, and audit-ready safety trails for women’s night shifts.
A common failure mode is to oversell “delight” or “AI routing” without baselines. Executives trust simple before–after statements with numbers, not adjectives. For example, a facility head can present that automated routing and EV fleet uptime have raised OTP from 86% to 93% while keeping cost per km roughly flat, instead of claiming “smart mobility transformation.”
To avoid CFO skepticism, every claim should be paired with its data source and control. Commute NPS or employee satisfaction scores should be cross-referenced to HRMS attendance and exception logs. Safety narratives should point to structured SOPs, women-centric protocols, and command-center observability, not just app screenshots. ESG claims should align commute emissions data with recognized reporting frameworks and carbon baselines.
Practical communication guardrails include:
- Lead with 3–5 transport KPIs the CFO recognizes, such as OTP%, incident rate, cost per employee trip, EV utilization ratio, and complaint closure SLA.
- Anchor “experience” in risk language, such as fewer night-shift escalations, auditable women-safety compliance, and predictable SLA delivery, rather than in marketing language.
- Show commute improvements as reducing noise for Finance and leadership, by cutting billing disputes, fragmented vendor touchpoints, and last‑minute emergency interventions.
- Treat ESG and EV adoption as evidence-backed risk and reputation levers, by connecting reduced CO₂ per km and EV uptime to corporate disclosures and stakeholder expectations.
When HR and Operations present commute outcomes this way, they are not asking leaders to fund “nice-to-have transport apps.” They are demonstrating controlled reliability, defensible costs, and verifiable safety and ESG performance, which are central concerns for the CFO, CHRO, and board.
When HR wants stricter safety/experience but Finance wants lower cost, how do we design the service catalog and outcomes so the trade-offs are clear and we don’t create a problem that explodes later?
B0251 Make HR–CFO trade-offs explicit — In India corporate mobility, when HR wants stricter experience and safety outcomes but the CFO pushes back on cost, how can the service catalog mapping be designed to make the trade-offs explicit—so the decision is transparent and not a hidden cost cut that blows up later?
A service catalog for corporate mobility in India should explicitly tier commute options by experience and safety outcomes, with each tier mapped to clear unit economics, SLAs, and compliance controls. This makes trade-offs visible to HR and the CFO in advance, so “cost savings” are linked to defined changes in OTP, safety scope, and governance rather than becoming an invisible cut that later shows up as incidents, escalations, or hidden spend.
A practical pattern is to use outcome-based service tiers across EMS, CRD, ECS, and LTR, instead of a single “take it or leave it” model. Each tier describes commutable elements such as On-Time Performance %, women’s night-shift safeguards, escort rules, command-center coverage, driver credentialing depth, and EV penetration, and then directly links these to cost per km (CPK), cost per employee trip (CET), and vendor SLA structure. HR can see which levers truly improve commute safety and experience. Finance can see which levers actually move TCO, dead mileage, and Trip Fill Ratio.
Most organizations gain transparency when the catalog is built on a few stable design rules:
• Each service line (EMS, CRD, ECS, LTR) has 2–3 standard tiers with named SLAs, not ad-hoc exceptions.
• Every uplift in OTP, women-safety compliance, command-center observability, or EV utilization ratio is priced as an explicit premium.
• Every discount is paired with a quantified exposure in reliability, safety, or governance, expressed as ranges rather than vague “no impact” promises.
Once mapped this way, HR and the CFO are choosing between visible bundles of reliability, safety, ESG impact, and cost, rather than negotiating line items in isolation. This reduces the risk that a lower-cost option quietly drops escort rules, reduces NOC coverage, or loosens driver vetting, only to reappear months later as attendance volatility, incident response strain, and board-level questions.
How do we set different KPIs for exec car rentals vs employee shuttles/cabs so VIP priority doesn’t hurt overall reliability?
B0258 Balance exec vs workforce KPIs — In India enterprise ground transportation, how do we define persona-specific KPIs for executives using Corporate Car Rental (CRD) versus large shift-based employee populations in EMS, so that VIP service doesn’t quietly cannibalize operational reliability for everyone else?
In enterprise ground transportation in India, organizations prevent VIP corporate car rental (CRD) from cannibalizing employee mobility services (EMS) by assigning different KPI sets by persona and then locking those KPIs into separate service catalogs, SLAs, and capacity rules. CRD KPIs emphasize executive experience and responsiveness per trip, while EMS KPIs emphasize shift-wide reliability, seat-fill, safety, and ESG outcomes at scale.
For executives using CRD, most organizations define KPIs at a trip and user level. Typical CRD metrics include on-time performance for airport and intercity pickups, SLA-bound response time from request to vehicle confirmation, vehicle quality adherence, and complaint closure time per executive booking. Finance and procurement usually add KPIs around cost per kilometer and billing accuracy for CRD, because CRD spend is visible as official business travel and must reconcile cleanly with centralized billing and audit expectations.
For shift-based EMS populations, KPIs are defined at route and shift level rather than at individual-trip level. Common EMS metrics include OTP across the entire shift window, trip adherence and route adherence rates, trip fill ratio for pooled rides, and incident-free operations for women’s night shifts with escort and SOS protocols. Command center teams also monitor fleet uptime, vehicle utilization, and exception detection-to-closure latency, because one delayed EMS route can affect dozens of employees and shift productivity.
To prevent VIP CRD demand from undermining EMS reliability, organizations use separate capacity and routing rules for each persona group. Fleet and dispatch teams tag a fixed, audited pool of vehicles and drivers to EMS rosters and guard them with constraints on reallocating EMS cabs to ad-hoc CRD bookings during peak shift windows. CRD KPIs are then structured so that “rescuing” an executive trip by pulling EMS inventory is treated as a failure in EMS OTP and route adherence rather than a win in executive service.
Facility and transport heads rely on the command center to enforce these boundaries. Command center dashboards present EMS and CRD KPIs side by side but not as a single blended reliability score, which prevents VIP trips from masking shift-level delays. Data-driven insights on utilization and dead mileage help transport heads justify a small, dedicated CRD buffer fleet while keeping the majority of capacity optimized around EMS shift patterns.
A practical persona-specific KPI structure typically includes: - For executives (CRD): on-time pickup rate for priority trips, SLA response time, vehicle standard compliance rate, and dispute-free billing ratio. - For employees (EMS): shift OTP, trip fill ratio, incident rate on night routes, command-center closure SLA for SOS or deviations, and emission intensity per employee trip where EVs are in use.
This approach allows HR, Finance, and ESG leads to see that EMS reliability, safety, and EV utilization are being protected as first-order outcomes. At the same time, executives receive high-touch CRD service that is measured and optimized in its own lane, instead of quietly drawing down the operational buffers that keep shift operations stable.
For executive trips, what KPIs can we use that make ‘experience’ measurable—vehicle standards, behavior issues, and punctuality—so it’s not just opinions?
B0264 Quantify executive experience KPIs — In India corporate car rental operations, what service-catalog KPIs should an Admin/Travel Desk use to measure “executive experience” in a way that is concrete (vehicle standard adherence, driver behavior incidents, pickup punctuality) rather than subjective complaints?
In India corporate car rental operations, Admin and Travel Desks should translate “executive experience” into a small, fixed set of operational KPIs that are objective, auditable, and mapped to the service catalog. Each KPI should be measured at trip level and rolled up by city, vendor, and cost center.
Core service-catalog KPIs for executive experience
Pickup punctuality should be tracked as On-Time Performance (OTP%). Admin teams should define a clear SLA window (for example, on-time if the vehicle reaches within −5 to +10 minutes of scheduled pickup) and measure the percentage of trips meeting this standard by airport, intercity, and local rentals.
Vehicle standards adherence should be tracked as a Vehicle Compliance & Standardization Score This should measure whether the allocated vehicle matches the booked category, model-year band, and required features such as air-conditioning, Wi‑Fi, water, and cleanliness. Non-conformant trips should be flagged and trended by vendor and location.
Driver conduct should be monitored through a Driver Behavior & Incident Rate. This KPI should count safety or behavior incidents per 1,000 trips, using data from SOS alerts, complaint logs, and telematics such as over-speeding alerts, geofence violations, or harsh driving signals.
Trip adherence should be expressed through a Trip Adherence Rate (TAR). This should verify that the driver followed the planned route and complied with security rules such as route approvals and geo-fencing for sensitive movements.
Service recovery performance should be captured via an Exception Detection-to-Closure Time KPI. This should measure the average time taken to acknowledge and resolve issues such as vehicle no-shows, last-minute vehicle changes, or app glitches that affect executive travel.
Booking and coordination reliability should be measured through a Trip Lifecycle Completion Rate KPI. This should track the percentage of trips that move cleanly from booking to boarding to closure without manual override, escalation, or re-routing.
Admin teams can also define an Executive Experience Index by combining OTP%, vehicle standard adherence, driver incident rate, and exception closure time into a single composite score. This should be reported per service type (airport, intercity, hourly) and vendor in management dashboards to guide vendor governance and improvement actions.
What’s a practical checklist to define KPIs per service line for Finance, HR, and Facilities so everyone agrees what ‘success’ means?
B0267 Align persona KPI definitions — In India employee transport, what is a practical checklist to create persona-specific KPI sets (CFO vs CHRO vs Facilities Head) per mobility service line, so leadership stops talking past each other with mismatched definitions of “success”?
In India employee transport, a practical checklist for persona-specific KPIs starts by fixing three things per service line: a shared trip data model, clear “owner” for each metric, and an agreed view of which KPIs are “primary” vs “supporting” for CFO, CHRO, and Facilities. Leadership alignment improves when every KPI is explicitly tied to one buyer priority such as cost, safety, or reliability, and when all three personas read from the same operational data instead of separate spreadsheets.
A workable pattern is to define KPI sets separately for core mobility service lines like Employee Mobility Services, Corporate Car Rental, and Project/Event Commute, because the success definition and SLA pressure differ by use case. For each service line, organizations can then map CFO to cost/TCO and commercial control KPIs, CHRO to safety, experience, and attendance-linked KPIs, and Facilities Head to reliability, utilization, and exception-closure KPIs.
A practical checklist to build persona-specific KPI sets contains the following steps.
- Define one canonical trip and cost dataset.
- For each service line, write one-page “success definition” per persona.
- Select 3–5 primary KPIs per persona per service line.
- Attach each KPI to a data field, SLA, and owner.
- Separate board-level KPIs from command-center KPIs.
- Make ESG/EV metrics explicitly secondary, not hidden in cost or safety KPIs.
- Lock definitions in a mobility governance note and reuse them in contracts and QBRs.
1. Start with one shared operational spine per service line
Most KPI conflicts arise because Finance, HR, and Facilities use different source data for the same trips.
For each service line such as Employee Mobility Services or Corporate Car Rental, organizations should first fix the shared operational spine.
- Define canonical fields such as trip ID, employee ID, route ID, scheduled versus actual times, vehicle type, and vendor ID.
- Ensure cost-per-kilometer and cost-per-trip are derived from the same ledger that powers invoices.
- Tie safety and compliance events such as SOS triggers or escort deviations back to trip IDs.
Without this shared spine, persona-specific KPIs degenerate into parallel truths that leadership cannot reconcile.
2. Write short “success definitions” per persona per service line
Before picking metrics, each persona needs one paragraph that describes success in their own language for that service line.
For Employee Mobility Services, a CFO’s success definition usually emphasizes predictable cost per employee trip, clean audit-ready billing, and visibility into leakage such as dead mileage.
For the same service line, a CHRO’s success definition emphasizes zero serious incidents, stable attendance and retention, and commute experience scores that never become a board topic.
For the Facilities or Transport Head, success means on-time performance at or above target, few night-shift escalations, and early alerts instead of last-minute failures.
These plain-language definitions later act as filters to accept or reject candidate KPIs.
3. Select 3–5 primary KPIs per persona per service line
Each persona should have a very small primary set and a longer supporting set.
Primary KPIs are the ones discussed in leadership reviews.
Supporting KPIs stay in the command center or analytics layer for diagnosis.
For the CFO, primary KPIs for Employee Mobility Services often include cost per employee trip, cost per kilometer, utilization or seat-fill, and billing dispute rate.
For the CHRO, primary KPIs typically include on-time performance percentage, safety incident rate, commute experience or satisfaction index, and women-safety compliance score.
For the Facilities Head, primary KPIs usually include trip adherence rate, exception detection-to-closure time, vehicle utilization index, and driver attrition or fatigue proxy.
The same approach applies to Corporate Car Rental or Project Commute Services, but with emphasis shifting to response time and service reliability for executives or event timelines.
4. Attach each KPI to one owner, one SLA, and one data definition
KPI conflicts reduce when ownership is unambiguous.
Each KPI should be linked to one primary owner, even if multiple teams contribute.
For example, cost per employee trip is primarily owned by Finance but uses trip data from Facilities and contracts from Procurement.
On-time performance is primarily owned by Facilities but co-owned with vendors via SLA.
Safety incident rate is primarily owned by Security or EHS but depends on HR’s policies and Facilities’ routing discipline.
For every KPI, organizations should document one definition, one formula, one data source, and one review cadence.
5. Separate executive scorecards from control-room dashboards
Leadership confusion often comes from mixing tactical metrics with strategic ones.
Executive scorecards should contain a small number of aggregated KPIs for each persona, consistently shown across quarters.
For Employee Mobility Services, the CFO might see aggregated cost per kilometer and cost per employee trip by site, along with trend lines.
The CHRO might see commute experience index and safety incident rate per thousand trips.
The Facilities Head might see overall on-time performance, exception-closure latency, and vehicle utilization index.
The command center, in contrast, can track dozens of metrics like no-show rate, dead mileage, and specific route deviations, but these should not be rebranded every quarter as new “top” KPIs.
6. Make ESG and EV KPIs explicit adjuncts, not hidden drivers
EV and ESG targets influence all three personas but in different ways.
To avoid confusion, organizations should create a small ESG KPI band that sits alongside, not inside, cost and safety KPIs.
For example, Employee Mobility Services can track EV utilization ratio, emission intensity per trip, and a carbon abatement index.
The CFO views ESG primarily through total cost of ownership and verified carbon reduction.
The CHRO reads ESG through employer brand and inclusion outcomes.
The Facilities Head cares about EV uptime, charger density, and range risk for night shifts.
Keeping these ESG metrics explicit allows trade-offs such as cost versus EV penetration to be debated with shared numbers.
7. Standardize KPI definitions in contracts, dashboards, and reviews
Once persona-specific KPIs are selected and defined, they need to be embedded into procurement templates, SLAs, and quarterly review decks.
For the CFO, contracts should clearly link payment terms or penalties to KPIs like on-time performance or cost baselines rather than vague service-quality language.
For the CHRO, women-safety provisions, night-shift escort rules, and incident-response SLAs should be explicitly measurable and visible in audit trails.
For the Facilities Head, vendor governance frameworks should map daily operations directly to these KPIs through the command center, ensuring that alerts, escalations, and business continuity plans all reference the same measures.
Leadership then sees a consistent narrative where cost, safety, and reliability are different views of the same governed mobility program, instead of isolated scorecards that talk past each other.
How can HR define KPIs that link commute reliability to attendance/attrition in a credible way that Finance will accept?
B0271 HR KPIs credible to CFO — In India enterprise mobility services, how can the CHRO define service-line KPIs that connect commute reliability to HR outcomes (attendance stability, attrition hotspots) without over-claiming causality and losing credibility with the CFO?
In India enterprise mobility, CHROs are most credible when they treat commute reliability as a contributing risk factor to HR outcomes, not the sole cause, and design KPIs that show directional linkage rather than hard causality. The most defensible pattern is to track mobility KPIs and HR KPIs on the same time axis, by site and shift, and speak in terms of correlation, risk reduction, and avoided disruption instead of “commute causes attrition.”
CHROs can start by defining a small, stable KPI set on the mobility side that is already understood by operations and vendors. Typical examples include on‑time performance percentage by shift band, exception detection‑to‑closure time for missed or delayed pickups, incident and complaint rates for night shifts and women employees, and seat‑fill versus no‑show rates on high‑volume routes. These mobility indicators can then be sliced by location, line of business, and time band, which aligns naturally with attendance stability and rostered shift adherence.
On the HR side, the CHRO can mirror this structure with an “attendance stability index” built from late logins, commute‑tagged leave codes, and repeat no‑shows per employee, as well as simple flags for attrition hotspots such as teams or locations where resignations cluster after sustained service issues. The CHRO can then run periodic side‑by‑side views, showing that when mobility KPIs deteriorate on a given corridor or shift, commute‑tagged complaints, lateness, or exit‑interview mentions tend to rise in the same pockets.
This approach keeps the narrative CFO‑friendly because it avoids asserting that commute KPIs cause attrition or absenteeism. Instead, it frames mobility as a controllable operational lever that influences risk to HR outcomes. The CHRO can present this in reviews as “evidence‑backed risk linkage” with clear caveats, use it to justify targeted route or vendor interventions, and then show whether subsequent reliability improvements coincide with stabilization of attendance in the same segments over the following months. That preserves analytical integrity while still making a strong, board‑defensible case for investing in governed, SLA‑driven employee mobility.
Implementation practicality, frontline adoption, and IT/HR integrations
Translates mapping into actionable steps for frontline teams, system integration, privacy compliance, and site rollout; emphasizes fast 5-minute execution and repeatable procedures.
From an IT view, how do we check that service catalog mapping will integrate with HRMS/attendance without one-off custom work per site?
B0204 IT check for clean integrations — In India corporate mobility operations, how should a CIO evaluate whether a vendor’s service catalog mapping can integrate cleanly with HRMS rosters and attendance systems without creating brittle one-off mappings for each site and service line?
A CIO should evaluate a mobility vendor’s service catalog integration by insisting on a clear, API-first service taxonomy that is roster- and policy-driven, not hard-coded to individual routes, sites, or vendors. The goal is a single canonical catalog that maps employee entitlements and shift rosters in HRMS to mobility services, without per-location custom logic that will break under change.
A robust service catalog for Employee Mobility Services, Corporate Car Rental, Project/Event Commute, and Long-Term Rental should be expressed as standardized “products” and attributes. Each product should expose machine-readable parameters such as shift window, vehicle type, SLA class, geography, and commercial model. HRMS rosters and attendance systems should only pass stable identifiers like cost center, persona tier, shift code, and location, while the mobility platform performs policy-based routing to the right catalog entry.
CIOs should treat one-off mappings as a red flag because they drive integration debt and make it impossible to scale hybrid work, new locations, or EV adoption. Instead, they should require a vendor to demonstrate: a canonical service catalog across EMS/CRD/ECS/LTR, API contracts that accept HRMS identifiers rather than route IDs, and configuration-driven rules for entitlements and exceptions. Command center dashboards and mobility data lakes are easier to operate and audit when the underlying catalog is normalized and stable.
Key evaluation checks include:
- Whether new sites or shift patterns can be onboarded by configuration in the catalog, without code changes.
- Whether entitlements and routing logic are expressed as reusable rules, not per-route mappings.
- Whether attendance, OTP, and cost KPIs can be reported consistently across all service lines using shared identifiers.
This approach reduces brittle point-to-point links, enables outcome-based procurement, and keeps IT from owning a growing backlog of custom mapping fixes whenever operations, HR policies, or vendors change.
When we move to mapped services and persona KPIs, what training/change-management do site teams and the control room typically need?
B0216 Change management for mapped KPIs — In India employee mobility services (EMS), what training or change-management is usually required for site teams and control-room staff when moving from informal expectations to service catalog mapping with persona-specific KPIs?
In Indian employee mobility services, shifting from informal expectations to a service catalog with persona-specific KPIs usually demands structured, operations-focused change-management for both site teams and control-room staff. Most organizations need to formalize roles, codify SOPs, and train teams to work against defined KPIs for reliability, safety, cost, and employee experience instead of ad‑hoc problem solving.
Site teams and NOC staff typically need orientation on the service catalog itself. They need clarity on the four core verticals like EMS versus CRD or project commute and how entitlements differ by persona such as regular staff, women on night shifts, or executives. This is usually followed by training on shift windowing, roster optimization, and route adherence so that KPIs like on-time performance, trip adherence rate, and trip fill ratio have a clear operational meaning.
Control-room operators also need training on command-center operations, escalation matrices, and exception workflows. They need to understand how to use alert supervision systems, SOS workflows, geo-fencing alerts, and incident response SOPs and how exception closure times and incident rates are now measured. Without this, centralized NOC monitoring and SLA governance stay on paper.
A common failure mode is leaving KPIs as MIS-only metrics. Teams then see them as audit demands and not as tools for daily decision-making. Practical change-management programs therefore include:
- Classroom and on-the-road coaching linking each KPI to concrete actions like rerouting, buffer deployment, or driver substitution.
- Walkthroughs of dashboards and single-window systems so staff can interpret real-time OTP, exceptions, and compliance status.
- Role-specific playbooks for CHRO, Transport Head, Security/EHS, and Finance-aligned reporting, so each persona gets the right view and cadence.
- BCP and emergency drills using business continuity plans, so NOC and site teams practice command-center runbooks under disruption.
Organizations that embed these routines into daily shift briefings, driver management and training programs, and periodic audits usually see better route adherence, higher fleet uptime, and fewer escalations to senior leadership.
images:
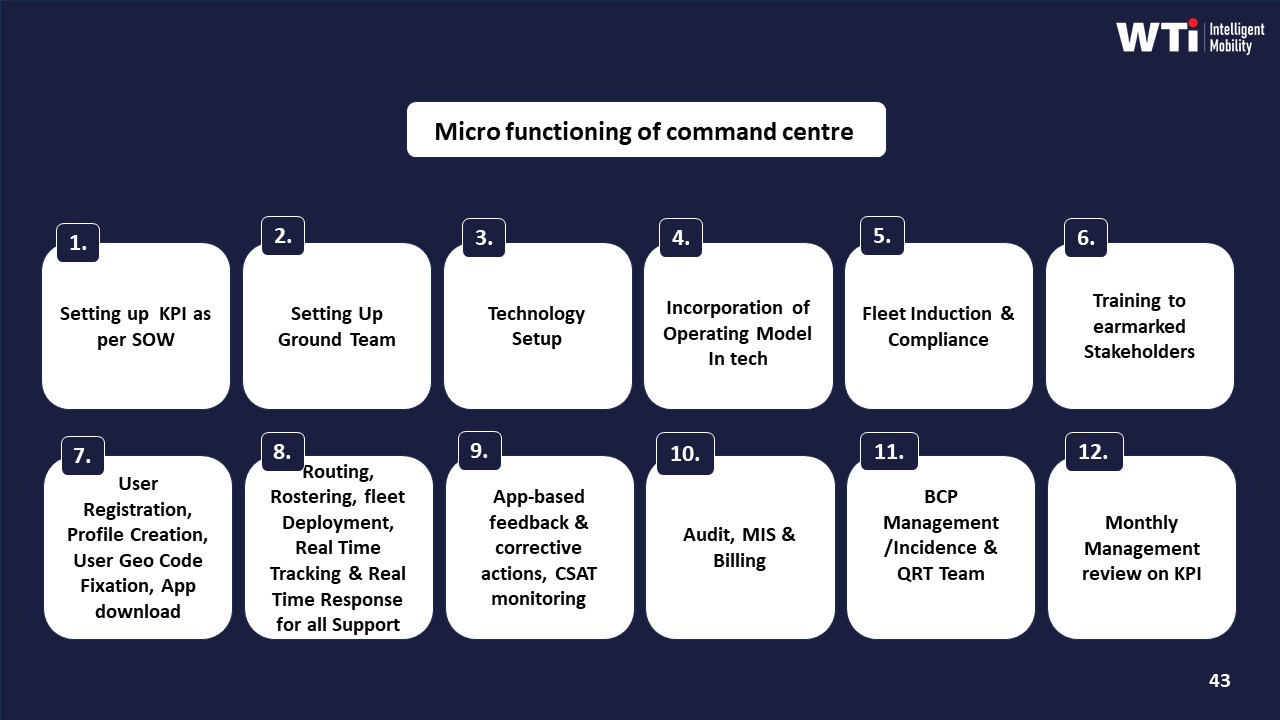
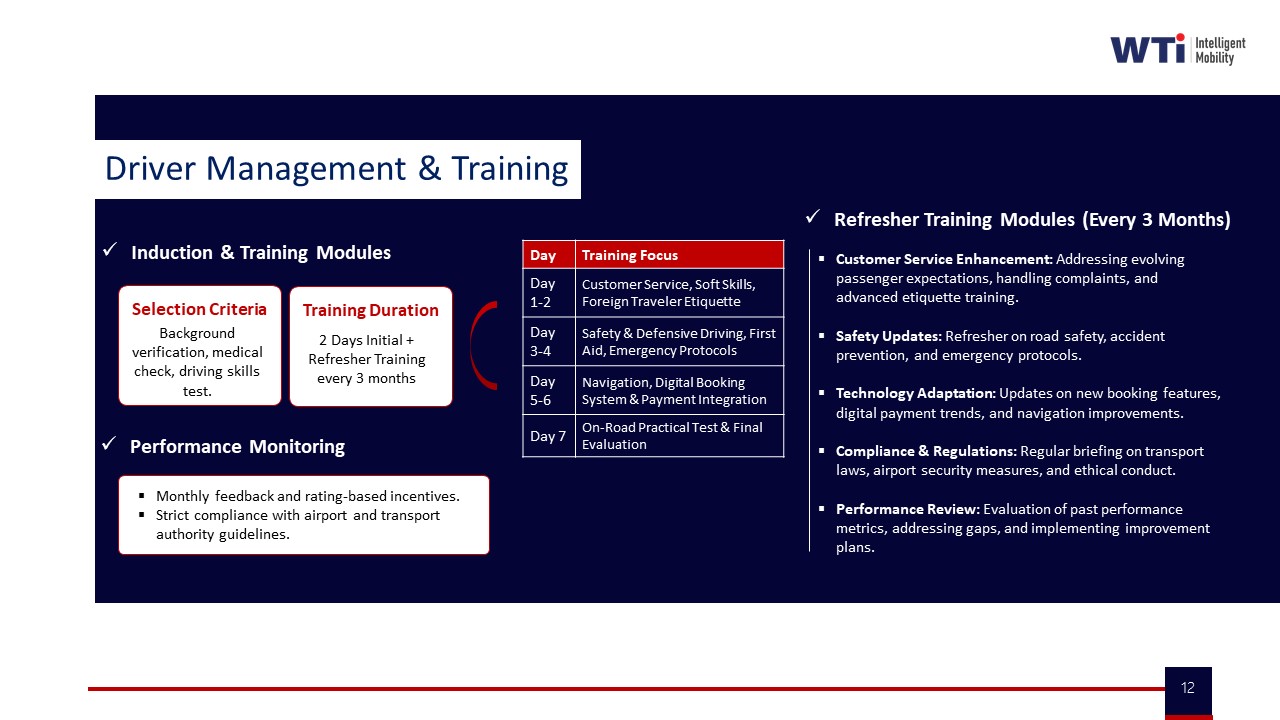
How do we define night-shift women safety outcomes in EMS so they don’t get buried under generic on-time KPIs and we have proof if something happens?
B0231 Map night-shift safety outcomes — In India Employee Mobility Services (shift-based commute), how should HR and Security/EHS define women’s night-shift outcomes within the service catalog mapping so “safety compliance” is not diluted into generic OTP metrics and the organization can produce incident-ready evidence under scrutiny?
In India EMS programs, HR and Security/EHS need to define women’s night‑shift outcomes as a separate safety and compliance service line, with its own KPIs, controls, and evidence trails, instead of treating it as a sub‑metric of generic OTP. Safety must be specified as “escort, routing, and documentation outcomes per trip” that can be reconstructed under audit, not as a vague commitment.
They should first separate the women’s night‑shift commute in the service catalog as a distinct entitlement. This category should have explicit scope, such as shift windows, eligible locations, and mandatory escort or routing rules. Generic EMS KPIs like overall OTP and cost per trip should be listed as adjacent but not primary metrics for this category.
They should then define a minimal outcome set that is clearly measurable. Typical women’s night‑shift outcomes include zero escort non‑compliance, zero unapproved route deviations, zero tampered GPS logs, and full completion of trip‑level safety checklists. Each outcome should attach to a specific enforcement mechanism such as geo‑fencing, mandatory check‑ins, driver KYC and POSH training, and real‑time alert supervision.
They should explicitly map these outcomes to evidence. The catalog entry should describe the mandatory artefacts, such as trip manifests with timestamps, escort presence logs, GPS route traces, SOS and alert logs, and driver credential records. It should also describe how long these artefacts are retained and how HR or Security/EHS can retrieve a case file for an incident or external inquiry.
They should add closure KPIs that are unique to safety. These include incident detection‑to‑closure time, compliance audit scores for women‑specific routes, and the percentage of safety complaints closed within agreed SLAs. OTP should be referenced as a supporting indicator, but safety KPIs should drive evaluation and penalties for this service line.
They should embed escalation and governance rules inside the catalog mapping. Women’s night‑shift safety should specify escalation paths, decision rights, and mandatory post‑incident reviews. It should also codify the role of the centralized command center in monitoring alerts and documenting actions taken.
They should finally align billing and contracts with these defined outcomes. Vendor contracts for women’s night‑shift services should link payment, penalties, and potential off‑boarding to safety compliance scores and evidence quality rather than only to punctuality. This approach reinforces that safety is a governed outcome with its own performance logic, not a soft add‑on to generic reliability.
From IT’s side, how do we check that our service catalog (EMS/CRD/ECS/LTR) is structured in a way that won’t create heavy custom integration with HRMS and finance later?
B0236 Check catalog integration readiness — In India corporate ground transportation, how can a CIO evaluate whether the service catalog mapping is “integration-ready,” meaning each service line has consistent identifiers and data fields that won’t explode into custom work when integrating HRMS rosters, attendance, and finance systems?
A CIO can evaluate whether a mobility service catalog is “integration‑ready” by checking if every service line (EMS, CRD, ECS, LTR) is modeled on a single, consistent trip and asset schema that uses stable IDs, shared reference tables, and clearly defined status fields across all products. Integration‑ready catalogs expose this schema through documented APIs and mapping tables so HRMS rosters, attendance events, and finance line items can all point to the same identifiers without per‑service custom logic.
A basic test is whether Employee Mobility Services, Corporate Car Rental, Project/Event Commute, and Long‑Term Rental all resolve to the same core entities. Those entities usually include employee profile and policy tier, trip header and trip leg, vehicle and driver records, vendor and contract, and billing unit (per‑km, per‑trip, per‑seat, rental block). If any service line introduces its own incompatible definitions for employee, trip, or vehicle, then downstream HRMS integration and ERP mapping will fragment, and custom ETL will proliferate.
A second test is whether the provider offers an API‑first “mobility data lake” or at least a canonical KPI layer. In a mature setup, attendance/roster events, routing outputs, NOC exception logs, and billing records all reference the same trip ID, employee ID, route ID, and cost center. That consistency allows Finance to calculate Cost per Employee Trip and Cost per Kilometer using the same semantics that HR uses to correlate late logins and that Security uses to audit route adherence.
A third test is versioning and extensibility discipline. Integration‑ready catalogs allow new attributes such as EV battery telemetry or ESG emission metrics to be added without breaking existing fields and mappings. Providers who treat EV telemetry, SOS incidents, or ESG tags as bolt‑ons with ad‑hoc fields will force the CIO’s team into repeated remapping whenever new services like EV fleets, project shuttles, or community shuttles are introduced.
A CIO can structure the evaluation around a few concrete checks:
- Request the provider’s canonical data model that spans EMS, CRD, ECS, and LTR.
- Verify that HRMS integration for rosters and attendance uses the same employee and trip identifiers that appear in billing and SLA dashboards.
- Confirm that outcome KPIs such as On‑Time Performance, Trip Adherence Rate, and Cost per Employee Trip are derived from a shared event model, not per‑service logic.
If these checks pass, the service catalog is likely integration‑ready. If they fail, any new city, new business unit, or new EV initiative will require one‑off integration work, increasing long‑term risk and IT maintenance load.
How do we map and explain service outcomes so transport coordinators use them day-to-day, instead of falling back to WhatsApp firefighting?
B0246 Drive frontline adoption of mapping — In India corporate employee transport, what’s a realistic way to map and communicate service-line outcomes so frontline transport coordinators actually follow the process, instead of reverting to WhatsApp-based firefighting that undermines the entire service catalog?
A realistic way to make frontline transport coordinators follow defined service-line outcomes is to give them a single, shift-friendly “command view” where every trip, alert, and SLA is mapped to a small set of clear SOPs, and to hard-wire these SOPs into alerts, escalations, and reports that leadership actually reviews. When coordinators see that the same system they use in the night also drives billing, OTP metrics, safety audits, and performance reviews, the incentive to bypass it with WhatsApp drops sharply.
The starting point is to define outcomes per service line in operational language that matches daily reality. Employee Mobility Services need OTP%, safe routing, and no-show control. Corporate Car Rental Services need response-time assurance and vehicle-quality consistency. Project/Event Commute needs dispatch certainty and time-bound closure. Long-Term Rental needs uptime and continuity. Each outcome needs 1–3 KPIs and a simple SOP tree for exceptions, so coordinators know what “good” looks like for every trip category during a shift.
The next step is to bring these outcomes into a single-window dashboard that transport teams actually live in. Real-time visibility of routes, battery levels or fuel usage, driver compliance, and SOS events helps front-line staff intervene early instead of firefighting late. If that same dashboard feeds indicative management reports, audit trails, and CO₂ dashboards, then skipping the system creates visible gaps in billing, safety records, and ESG reporting rather than being the easy option.
Organizations that reduce WhatsApp dependence usually do three things consistently:
- They anchor daily shift briefings and handovers on the command-center view, not on chat histories, and they log every exception and SLA breach in the system.
- They connect that data to billing, vendor penalties, and performance reviews, so coordinators see that accurate logging protects them and clarifies accountability.
- They use alert supervision systems and SOS panels as the default path for geofence violations, overspeeding, or safety incidents, making side-channels visibly non-compliant.
A micro-level command-centre workflow that includes KPI setup, fleet and driver compliance checks, real-time monitoring, and structured escalation gives coordinators predictable steps to follow under pressure. When this is backed by a documented business continuity plan for strikes, tech failures, and cab shortages, coordinators retain control even when systems degrade, without abandoning the service catalog itself.
To reinforce adoption, organizations can expose coordinators to CO₂ reduction dashboards, EV fleet performance summaries, and user satisfaction indices, so they see how their disciplined logging feeds into ESG claims and employee NPS, not just into local reporting. This shifts the perception of the platform from “extra admin” to “the system that proves we did our job correctly.”
images:
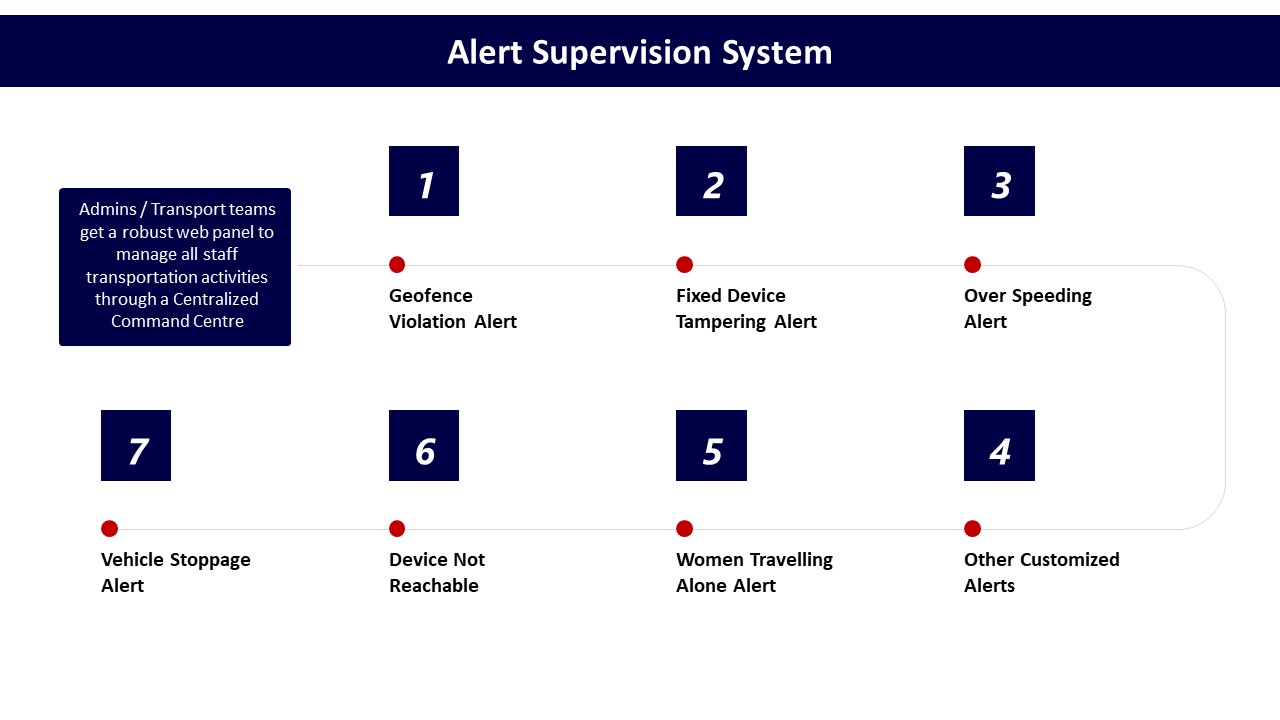
How do Legal and IT ensure our service outcomes don’t force unnecessary employee tracking that could cause DPDP/privacy issues or backlash?
B0247 Avoid privacy overreach in outcomes — In India corporate ground transportation, how should Legal and IT influence service catalog mapping so outcome definitions don’t inadvertently require excessive employee tracking under the DPDP Act, creating privacy pushback and reputational risk?
In India corporate ground transportation, Legal and IT should shape the service catalog so that every outcome (OTP, safety, cost, ESG) is defined in terms of minimal, purpose‑bound, and aggregated data rather than exhaustive individual tracking. Outcome definitions that require continuous location visibility on named employees are high‑risk under the DPDP Act and often unnecessary for reliability, safety, or ESG reporting.
Legal should first classify commute data elements explicitly as personal or non‑personal and then tie each to a lawful purpose, retention window, and access rule. IT should then enforce this model in routing engines, command center tooling, and dashboards so operations teams see what they need for OTP, safety, and compliance, but do not have open‑ended access to individual employee trails. Most operational KPIs such as OTP%, Trip Adherence Rate, Trip Fill Ratio, or gCO₂/pax‑km can be computed from trip‑level and route‑level data without exposing full historical movement of identified employees.
A structured approach is to treat “service catalog mapping” as a joint Legal–IT design exercise, not a post‑fact audit of an ops proposal.
- Define each catalog item (EMS, CRD, ECS, LTR) with a clear set of required KPIs and SLAs that are data‑light at the user level and rich at the trip/route level.
- Separate “live operations” needs from “post‑fact analytics,” and for each define maximum location and identity granularity, lookback window, and who can see what.
- Force the use of pseudonymized or aggregated data for dashboards used by management and ESG, reserving identified data only for exception handling and incident investigation.
- Make vendor RFPs and contracts reflect this: mandate DPDP‑aligned data minimization, role‑based access, audit logs, and explicit exit/data‑portability provisions as part of the service catalog definition.
If Legal and IT do not co‑own these boundaries at the catalog stage, operations teams tend to over‑spec data capture to “be safe,” which increases privacy exposure, creates employee distrust, and raises the risk of DPDP non‑compliance and reputational damage without improving OTP, safety, or cost outcomes.
How should we define a clean service catalog across EMS, airport/intercity, events/projects, and long-term rentals so scope and ownership are clear for each service?
B0252 Define mobility service catalog — In India corporate ground transportation and employee mobility services, how do we map a clear service catalog across shift-based Employee Mobility Services (EMS), airport/intercity Corporate Car Rental (CRD), event/project commute (ECS), and long-term rentals (LTR) so that each service line has an unambiguous scope, owner, and outcome definition?
Clear service catalog mapping starts by defining each mobility line by use-case, scope of work, operational owner, and measurable outcomes rather than by vehicle type or vendor.
For shift-based Employee Mobility Services, enterprises usually define the scope around rostered home–office–home movement, pooled routing, night-shift escort rules, and centralized NOC coverage. The operational owner is typically Transport or Facilities under HR governance. The primary outcomes are on-time performance, safety incident rate, seat-fill, and audit-ready compliance for women’s safety and labour norms.
For Corporate Car Rental covering airport, intra-city, and intercity use, the scope is individual or small-group official travel on-demand with standardized vehicles, SLAs for response and wait times, and flight-linked tracking for airports. Administration or Travel Desk usually owns this line, with Finance oversight. Outcomes focus on SLA adherence for response and trip completion, executive experience, and cost-per-km and leakage control supported by centralized booking and billing tools.
Event and project commute services are catalogued as time-bound, high-volume deployments with rapid fleet ramp-up, temporary route design, and dedicated on-ground supervision or control desks. Project, Operations, or Facilities teams own them, with outcomes centered on start-time adherence for events or shifts, safe crowd movement, and execution within agreed timelines and commercial envelopes.
Long-term rentals are scoped as dedicated vehicles and chauffeurs on 6–36 month tenures with fixed commercial terms, uptime targets, and preventive maintenance responsibilities. Admin, Procurement, or Operations usually own this line. Outcomes prioritize vehicle uptime, continuity of availability, predictable monthly cost, and lifecycle compliance of vehicles and drivers over daily dispatch optimization.
Most organizations stabilise this catalog by linking each service line to distinct KPIs, commercial models, and governance cadences. Employee mobility emphasizes OTP, safety, and roster integration. Corporate car rental emphasizes booking discipline and trip-level cost visibility. Events and projects emphasize time-bound delivery and on-ground control. Long-term rental emphasizes budget stability and asset uptime. Centralized command centers, EMS/CRD platforms, and compliance dashboards then sit across all four as shared enablers rather than separate services.
When a site swings between normal shifts and project ramp-ups, how do we clearly split EMS vs ECS in the service catalog so ops and billing don’t get messy?
B0253 Separate EMS vs ECS scope — In India employee mobility services for shift-based commutes, what is a practical way to separate EMS versus ECS in the service catalog when the same site alternates between steady-state shifts and temporary project ramp-ups, without creating billing disputes or operational confusion?
In Indian employee mobility for shift-based commutes, the most practical way to separate EMS and ECS at the same site is to define them as two distinct “modes of operation” in the service catalog, anchored to clear triggers, KPIs, and billing rules that are visible to Transport, HR, Finance, and vendors. The steady-state mode maps to EMS with predictable routes and rosters, and the ramp‑up or special‑event mode maps to ECS with explicit time-bound scope, rates, and governance.
In practice, EMS works best as the baseline program for that site. EMS covers all regular, recurring shift commutes that follow the standard ETS Operation Cycle with defined routing, rostering, and SLA metrics for OTP, safety, and seat-fill. EMS should use long-lived route IDs, stable commercial models (per km, per trip, per seat, or LTR-style monthly rentals), and shared governance through the existing command center, compliance dashboards, and standard billing workflows.
ECS should then be positioned as a temporary overlay for the same site. ECS activates only when specific ramp-up conditions are met, such as a new project, industrial peak, or event with time-bound volume spikes, and it draws on the same fleet, driver pool, and command center but under separate project codes and schedules. ECS should use project-specific route tags, control desks, rapid deployment SOPs, and commercial terms aligned to project duration, peak-load days, or fixed event windows.
To avoid billing disputes and operational confusion, organizations should codify three things. First, a simple decision rule for when a trip is tagged EMS versus ECS, using attributes like project code, time window, and roster type recorded in the transport platform and visible in the ETS dashboards. Second, distinct but compatible commercial models, where EMS remains the steady cost baseline while ECS uses pre-agreed surge or project tariffs that are clearly mapped to billing models such as per-trip, per-seat, or temporary FTE-based deployments. Third, unified but filterable reporting, where the same dashboards and billing systems produce separate EMS and ECS views, allowing Finance, Procurement, and Transport to reconcile trips, costs, and SLA outcomes by mode without manual reclassification.
images:
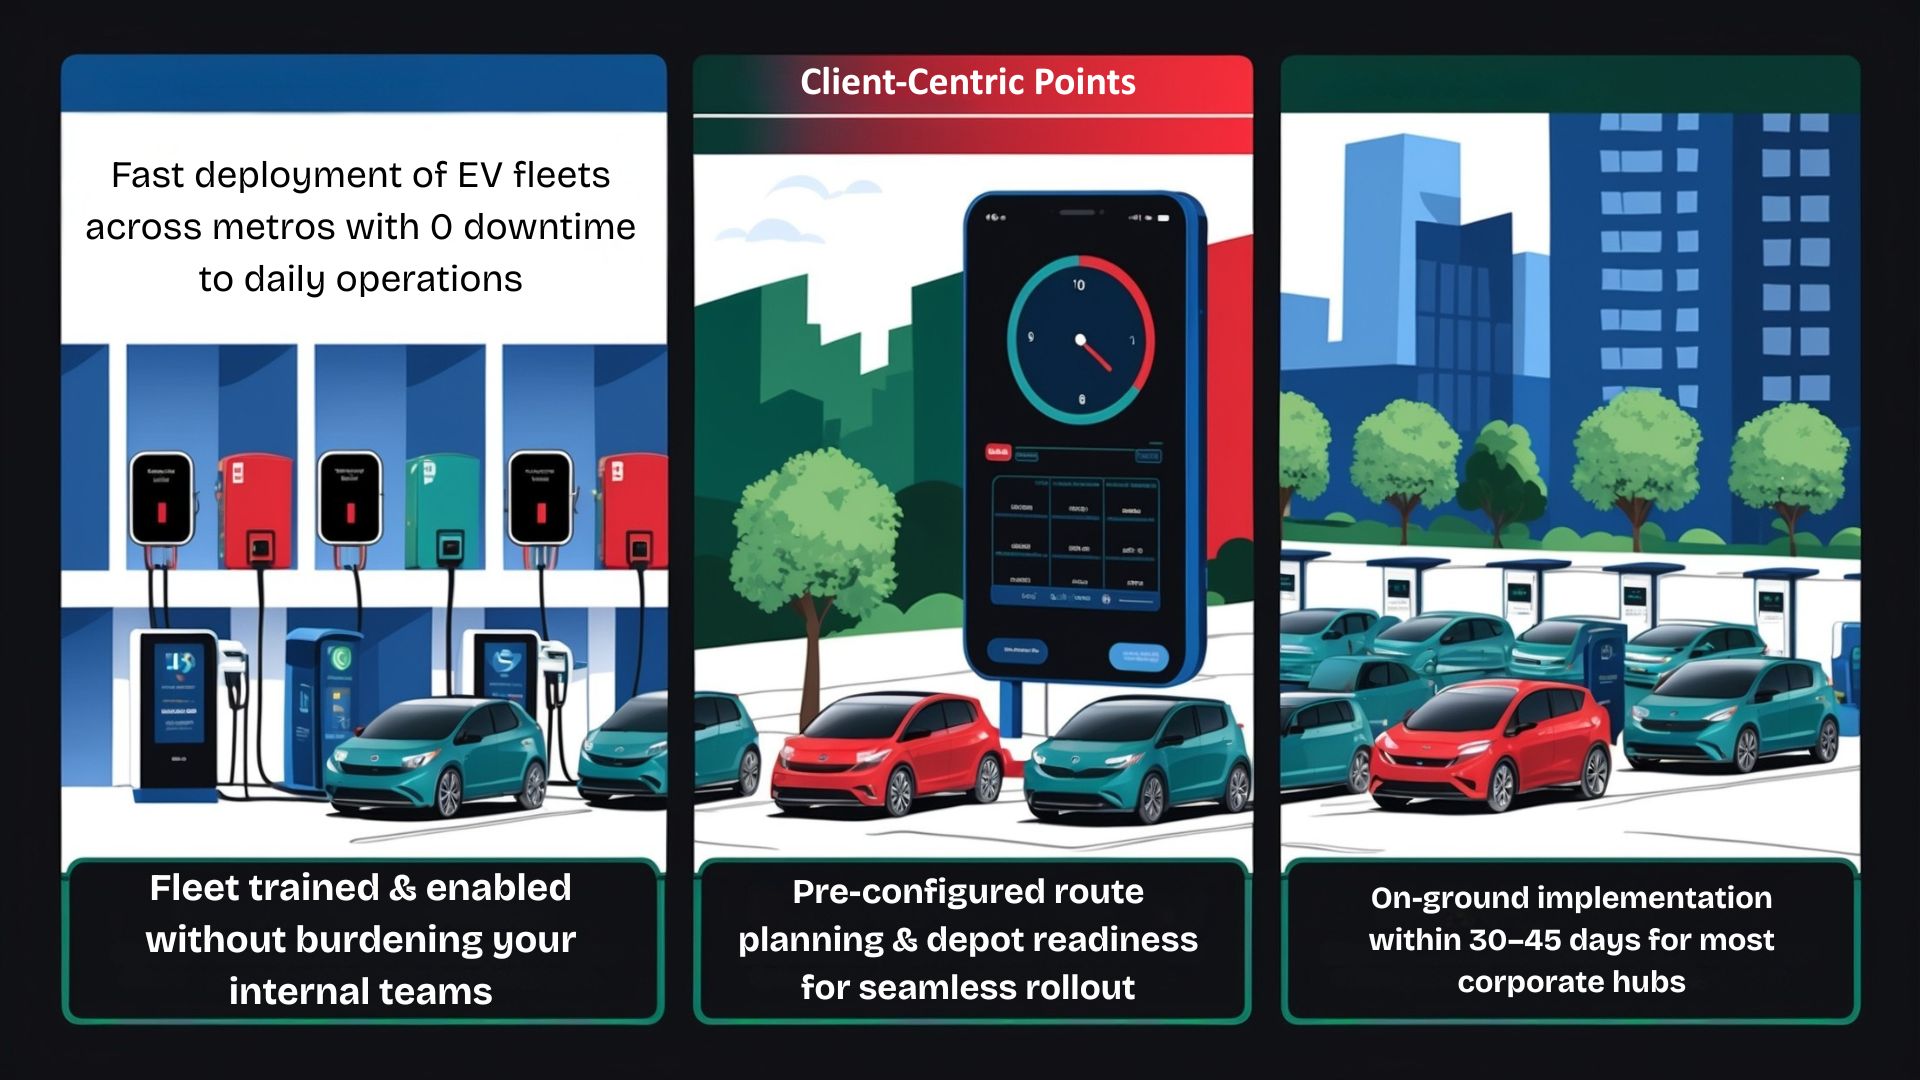
For airport/intercity trips, how do we define flight delays, waiting, and meet-and-greet in the service catalog so the travel desk and finance don’t fight each month?
B0254 Clarify airport exception definitions — In India corporate car rental (airport and intercity mobility), how should a service catalog define what is included in “airport meet-and-greet,” “flight delay handling,” and “wait time” so the Travel Desk and Finance Controller stop arguing about what counts as SLA compliance versus a chargeable exception?
In corporate airport and intercity rentals in India, “airport meet-and-greet,” “flight delay handling,” and “wait time” need explicit, measurable definitions in the service catalog so that SLA compliance is binary and anything outside those boundaries is pre-agreed as a chargeable exception. Each term should specify start/stop conditions, channels of information used (PNR/API vs manual updates), free-of-charge buffers, and the exact point at which billing or no-show rules apply.
For airport meet-and-greet, the catalog should define the standard reporting time before Scheduled Arrival Time, the physical meeting point (gate/column/counter), the maximum time the chauffeur must display signage and attempt contact, and the evidence expected in case of disputes. A clear link to corporate car rental SLAs and employee experience is important because airport mobility is highly visible to executives and HR.
For flight delay handling, the catalog should distinguish between auto-tracked delays (from PNR or airline feed) that stay within a predefined buffer and longer delays that require explicit approval from the travel desk. Auto-tracked delays within the buffer should be treated as SLA compliance, while extended delays convert into either chargeable extra wait time, re-booking, or cancellation according to predefined rules agreed with Finance.
For wait time, the catalog should define free wait-time slabs separately for airport pickups, airport drops, and intercity point-to-point, and then specify the per-15-minute or per-30-minute charge outside that slab. The definition should also clarify when the meter starts (e.g., “Actual in-bay time” vs “STD of pickup”), how no-shows are determined, and how exceptions like security holds or baggage delays are treated. This reduces ambiguity at billing time and allows Finance to map SLAs and exceptions directly into reconciliation and audit trails.
A practical catalog structure that reduces Travel Desk–Finance friction usually includes:
- Clear operational definitions for each term with time stamps and data sources.
- Standard free buffers versus chargeable thresholds for each scenario.
- Evidence rules for disputes, aligned to centralized car rental dashboards and trip logs.
- Examples of “SLA met” versus “chargeable exception” for common edge cases like missed baggage, immigration queues, or last-minute flight reschedules.
For pooled shuttles on a campus, what should we define around capacity, seat-fill, and feeder rules so HR and ops can both stand behind it?
B0255 Define pooled shuttle commitments — In India enterprise employee transport for large campuses and business parks using pooled shuttles, what should the service catalog say about capacity guarantees, seat-fill targets, and last-mile feeder rules so HR can defend the employee experience while Operations can defend feasibility?
In Indian enterprise shuttle programs for large campuses and business parks, the service catalog should define capacity guarantees, seat-fill targets, and last‑mile feeder rules as explicit, quantified bands with clear operating conditions and exception paths. HR needs employee-facing promises in simple language, while Operations needs parameters, buffers, and flex rules that are realistic under traffic, weather, and demand variability.
Capacity Guarantees
The service catalog should publish capacity as guaranteed frequency and floor capacity, not just total seats. Each corridor should state fixed peak and off-peak frequency bands in minutes and a minimum percentage of seats that will be available to pre-registered users on each run. The document should define buffer capacity per route or timeband for unplanned spikes, and it should clarify under what events the operator can temporarily relax guarantees using a published incident playbook.
The catalog should link corridor capacity to known shift windows and campus headcount, and it should distinguish between pooled trunk shuttles and limited reserved executive or special-needs capacity. It should describe how often capacity is recalibrated based on actual load and no-show patterns.
Seat-Fill Targets
The catalog should set seat-fill as an internal optimization metric with defined comfort caps, not as a rigid promise to employees. It should specify a target fill band per timeband, such as a typical operating range and a hard maximum occupancy threshold used to protect experience and safety. The document should allow Operations to run lower fill on early pilots or low-demand corridors while still staying within an agreed systemwide efficiency target.
The catalog should define a review cadence where HR and Transport jointly review fill versus complaints, on-time performance, and standing incidents. It should describe how seat-fill policies interact with ESG goals and cost per employee trip baseline, and it should clarify that cost and carbon optimization will not override standing rules on maximum occupancy or women-safety protocols.
Last-Mile Feeder Rules
The service catalog should define which neighborhoods or catchment zones qualify for last‑mile feeders, with explicit radius or travel-time limits from trunk shuttle stops. It should state minimum booking thresholds, notice periods, and operational hours for feeders, and it should differentiate between fixed-route feeders, on-demand shared cabs, and reimbursed public-transit legs.
The document should encode guardrails for late-night feeders, including escort and women-first rules, and it should specify maximum acceptable wait times at interchange points. It should also define what happens during disruption scenarios, such as how long a feeder will wait beyond schedule, when alternate modes are triggered, and how communication and escalation work from the command center.
How HR Defends Experience and Ops Defends Feasibility
HR can point to published capacity bands, comfort caps, and last-mile entitlements as a clearly communicated “mobility policy,” and can use on-time performance and complaint closure metrics to show control. Operations can use the same catalog to justify fleet sizing, buffer levels, and feeder coverage, and can refer to exception rules and recalibration cycles when conditions make strict adherence temporarily impossible.
A practical catalog will also reference driver availability assumptions, traffic variability, and charging or refuelling windows for EV fleets, so that capacity and feeder promises remain aligned with actual fleet uptime and infrastructure constraints.
For EMS, how do we define OTP in a way that’s fair and audit-proof—grace time, no-shows, and wrong pins included?
B0256 Make OTP definition audit-proof — In India shift-based Employee Mobility Services (EMS), how do we translate the outcome “on-time pickup/drop” into a service-catalog KPI definition that is audit-proof—covering grace windows, no-show handling, and what happens when the employee location pin is wrong?
On-time pickup and drop in Indian shift-based Employee Mobility Services is best defined as a precise, time-windowed SLA per trip, with explicit rules for grace, no-shows, and bad location data, and with every event backed by app and GPS logs that can be replayed later. An audit-proof KPI treats “OTP” not as a feeling but as a timestamp comparison between a committed schedule and verifiable telematics and app events.
The scheduled time must be frozen from the final roster and route plan, and the grace window must be defined by policy for each lane, for example “On-Time Pickup = vehicle arrival at geofenced pickup point from 10 minutes before to 5 minutes after scheduled time.” Any arrival outside this window is “late,” even if the shift still runs. The same structure applies for drops, anchored to scheduled shift-end or agreed drop-slot, and not to whatever time the driver actually reaches.
No-show handling must be separated from vendor delay, with its own status codes. The KPI should state that a no-show is counted only when the vehicle is inside the pickup geofence during the SLA window, the driver raises a “waiting” status in the driver app, and the employee app or IVR fails to confirm boarding within a defined wait period. OTP calculation should then exclude these trips from “late vendor” counts but include them in a separate “employee no-show rate.”
Wrong or stale location pins need a clear, pre-agreed rule so operations do not end up firefighting accusations. A robust definition sets a maximum allowed deviation radius between the HRMS/roster address and the live GPS stop used by the routing engine. If the employee updates location in the app before a cutoff time, the new pin becomes the scheduled point, and OTP is measured to that geofence. If not, the vendor is only responsible for reaching the last confirmed pin. Any additional delay caused by an incorrect or changed location after cutoff is tagged as “employee location exception” and is excluded from vendor OTP but logged for HR and Transport review.
To make the KPI audit-proof, all of these rules must be encoded into the service catalog and trip lifecycle, rather than resolved by manual judgment. Each ride should carry a machine-derived status such as “On-Time,” “Late – Vendor,” “No-Show – Employee,” or “Exception – Location Mismatch,” derived from GPS traces, app events, and SLA rules. Centralized command-center tooling and compliance dashboards, as described in the command centre and alert supervision collateral, can then present OTP%, exception counts, and closure times in a way that can be drilled down trip-by-trip during audits or investigations.
- Define OTP windows per shift band and site, with different grace for peak, night, and high-risk routes.
- Use standardized exception codes for no-shows, app failures, GPS gaps, and pin mismatches.
- Lock roster and address changes behind cutoffs, with every change time-stamped and visible to HR and audit.
- Align vendor contracts so payment, penalties, and incentives follow these codified and replayable KPI rules.
How do we define KPIs per service so the NOC can use them live, not just in month-end reports for HR/Finance?
B0259 Make KPIs operational for NOC — In India employee transport operations, what is a good way to map KPIs by service line so frontline NOC teams can act on them in real time (alerts and thresholds) instead of Finance and HR only seeing monthly scorecards?
A practical way to map KPIs by service line in India employee transport is to define a small, actionable KPI set per service (EMS, CRD, ECS, LTR), then convert each KPI into NOC-facing alerts with clear thresholds and SOP-based responses, while Finance and HR still receive the same KPIs as monthly scorecards rolled up from the live data.
For Employee Mobility Services, frontline NOC teams work best with a tight set of reliability, safety, and utilization KPIs. OTP%, Trip Adherence Rate, No-Show Rate, and Seat Fill Ratio can each have two to three bands. A yellow band can indicate early risk where routing or driver allocation must be adjusted. A red band can trigger escalation and use of buffers or standby vehicles, aligned with existing business continuity plans and “Management of on Time Service Delivery” SOPs. Safety-related KPIs like SOS triggers, route deviations, and escort compliance can be tied into the existing Alert Supervision and Command Centre tooling so night-shift violations generate immediate workflow tickets, not just post-facto reports.
For Corporate Car Rentals and Event/Project Commute, NOC teams can focus on response-time SLAs, airport/flight-linked pickups, and project-timeband adherence. CRD can map KPIs like response time and vehicle quality incidents to alerts that prompt reallocation or vendor substitution in real time. ECS can track high-volume movement windows with countdown views, flagging late reporting of vehicles or route bottlenecks so on-ground supervisors can intervene.
Long-Term Rental needs fewer real-time KPIs. Fleet uptime, preventive-maintenance compliance, and incident counts can be monitored via telematics and compliance dashboards. Deviations (e.g., uptime dropping below contract) can still be alerted daily so replacements or maintenance windows are scheduled before Finance sees the impact.
To keep NOC actions aligned with Finance and HR, the same KPI definitions should feed three layers from one data source. The NOC sees live alerts and shift-wise dashboards. Transport leadership sees daily and weekly trend views, including root-cause tags. Finance, HR, and ESG teams see monthly and quarterly scorecards (CET, CPK, incident rate, EV utilization, CO₂ per trip) that are rollups of the same events the NOC acted on. This prevents “two versions of truth” and lets leadership see, over time, whether NOC interventions are actually improving service reliability, safety performance, and cost outcomes.
From an IT angle, how do we check that KPI mapping will integrate cleanly with HRMS/ERP instead of creating another silo we’ll have to reconcile?
B0268 IT check for KPI data flow — In India corporate mobility programs, how should the CIO evaluate whether service-catalog KPI mapping will create clean integration points to HRMS/attendance and ERP/finance, versus creating yet another reporting silo that IT will have to reconcile manually?
In Indian corporate mobility programs, CIOs should evaluate service-catalog KPI mapping by asking whether every KPI is defined once in a governed “mobility layer” and then consumed by HRMS and ERP, or whether each vendor and function is inventing its own metrics that IT must reconcile manually. KPI mapping works when trip, safety, cost, and ESG data are modeled as canonical fields that align with attendance, payroll, and GL dimensions. It fails when mobility reports use ad-hoc definitions that cannot be tied back to HR and Finance systems.
CIOs should first check if the mobility service catalog is explicitly tied to core enterprise processes. Each EMS, CRD, ECS, or LTR service should have clear trip lifecycle events that map to shift windows, attendance rules, approval status, and cost objects. A clean design exposes trip start–end, OTP%, Trip Adherence Rate, seat-fill, and incident data as normalized entities. A weak design leaves KPIs trapped inside dashboards that HR and Finance cannot verify.
The integration fabric is the second filter. CIOs should insist on API-first access to a mobility data lake or semantic KPI layer, not CSV exports or bespoke feeds per stakeholder. A robust platform lets HRMS pull roster and trip outcomes to reconcile attendance and no-shows. It lets ERP/finance consume unit-economics like Cost per Kilometer and Cost per Employee Trip against cost centers and projects. A reporting silo forces IT to build custom ETL for every new report.
Data governance is the third test. Service-catalog KPIs must incorporate DPDP-compliant schemas, role-based access, and audit trail integrity from the start. IT should verify that a single source of truth exists for trip logs, exceptions, incident records, and billing events. Multiple overlapping KPI definitions increase audit risk and break trust with Finance, Security, and ESG teams.
Practically, CIOs can use a short decision checklist:
- Does each catalog service (EMS, CRD, ECS, LTR) have a documented KPI set with unambiguous formulas.
- Are those KPIs expressed in a canonical model that already includes HR identifiers, shift IDs, and finance cost objects.
- Can HRMS and ERP consume those KPIs through stable APIs mapped to their own master data, without one-off transformations.
- Is there a governed mobility data layer that IT can own, or are KPIs locked inside vendor dashboards and PDFs.
When the answers are positive, service-catalog KPI mapping becomes a clean integration surface for HRMS and ERP. When the answers are negative, it becomes another reporting silo that IT teams must reconcile manually release after release.
If GPS/app data drops on night shifts, how do we define a fair fallback for KPI tracking so ops isn’t punished but safety reporting still holds up?
B0269 Fallback KPI rules during outages — In India shift-based EMS operations, when GPS or mobile data failures occur during night shifts, how should the service catalog define fallback KPI measurement (manual check-ins, NOC verification) so Operations isn’t unfairly penalized but Safety reporting remains credible?
In India shift-based EMS operations, fallback KPI measurement for GPS or mobile data failures should be explicitly defined in the service catalog as a controlled “degraded mode,” where primary SLAs (OTP, route adherence, safety checks) are measured through predefined manual check-ins and NOC verification rather than penalizing Operations for telemetry loss itself. The catalog should draw a clear line between technology-availability KPIs and service-delivery KPIs so that safety reporting stays audit-ready while night-shift teams are not blamed for network outages.
The service catalog should first state normal-mode measurement. OTP, Trip Adherence Rate, and safety compliance are measured from trip logs, GPS traces, driver and rider apps, and the command centre dashboard. These metrics should be tied to standard EMS expectations like 24x7 NOC monitoring, geo-fencing alerts, SOS availability, and automated compliance visibility.
The catalog should then define a specific “Fallback Measurement SOP – Network / GPS Down” with its own controls. Drivers should be required to perform time-stamped voice or IVR check-ins, SMS/WhatsApp check-ins, or telephonic confirmation with the NOC at defined legs of the trip. NOC staff should log these events in the command centre system with trip ID, location description, and time, creating a manual but auditable trail. Safety-critical checks, such as women’s night-shift escort compliance, should be recorded via call logs and NOC forms.
KPI logic in fallback mode should be defined as follows. OTP is measured from NOC call or SMS timestamps at pickup and drop instead of GPS ETA. Trip adherence is measured from NOC logs, duty slips, and employee confirmations instead of continuous route tracking. Safety incidents and exceptions are logged through the SOS panel, call-centre tickets, and security escalation matrix, which remain active even in partial data loss.
To keep Operations from being unfairly penalized, the catalog should introduce two separate SLA families. The first family is “Service Delivery SLAs,” covering OTP, cancellation rate, safety incident rate, and complaint closure. These SLAs remain binding, and fallback measurement is accepted as valid evidence when primary telemetry fails. The second family is “Tech & Telemetry Availability SLOs,” covering GPS uptime, app uptime, and data latency. Breaches in this second family should not trigger the same penalties as service failures if manual SOPs are correctly executed.
The catalog should define clear conditions for invoking fallback mode. Examples include area-wide network outage, OEM device failure, or confirmed GPS malfunction, detected by the NOC and tagged at the trip or route level. When fallback is triggered, the vendor should be required to run specific command-centre steps such as alerting Security/EHS for high-risk routes, running additional call-based checks for women travelling alone, and reinforcing driver compliance by voice briefing.
Finally, the service catalog should specify evidence standards so that Safety and ESG reporting remain credible. Manual OTP and route adherence should be supported by NOC call logs, IVR reports, SMS records, duty slips, and employee app feedback, and these should be retained as part of the audit trail. Compliance dashboards and CO₂ or EV utilization reports should flag segments measured under fallback mode so that auditors and leadership can differentiate between telemetry-driven and manually verified data without discounting the safety assurance.
With hybrid attendance swings, how do we define ‘flex capacity’ outcomes so ops can keep buffers but finance doesn’t pay for waste?
B0270 Define flex capacity outcomes — In India corporate employee mobility with hybrid-work volatility, how should the service catalog define outcomes for ‘flex capacity’ so Facilities can plan buffers while Finance can prevent paying for unused vehicles and dead mileage?
In hybrid-work corporate mobility, flex capacity works best when the service catalog defines outcomes in terms of used capacity and service levels, not in terms of fixed vehicles. Flex capacity should be framed as measurable buffers around shift windows and OTP%, with payment indexed to actual trips, seat-fill, and capped dead mileage rather than a notional standby fleet size.
Flex capacity fails when it is defined only as “extra cars on standby” without clear triggers, metrics, and billing rules. This usually creates daily fights between Facilities and Finance because buffers are either missing when demand spikes or overbought and underutilized when attendance drops. A better pattern is to define flex capacity as a contracted range of capacity and response times, governed by SLAs and pay-per-use or outcome-based commercials.
Facilities teams need explicit rules for when buffers can be pulled into service and what lead times apply. Finance teams need explicit rules for what portion of that buffer is billable only on utilization versus what, if anything, is a retainer for readiness. Both sides gain control when the catalog encodes flex capacity as parameterized ranges, trigger conditions, and chargeable units that are visible in a shared dashboard.
A practical service catalog entry for flex capacity in Employee Mobility Services can be structured around a small set of outcome-linked fields:
- Target on-time performance (OTP%) within defined shift windows.
- Minimum and maximum seat capacity commitment per timeband or site.
- Response time SLA for “surge add” requests within and beyond the base roster.
- Dead-mileage caps per vehicle or per trip, with non-productive kilometers above the cap non-billable.
- Trip Fill Ratio (TFR) or minimum average occupancy targets for pooled routes.
- Commercial basis tied to per-trip, per-seat, or per-shift usage with clear rules for what counts as billable deployment.
For Facilities, this structure allows planning buffers as a percentage over forecasted demand per shift window. It also supports dynamic routing and shift windowing, which lets operations reallocate vehicles as hybrid attendance patterns change. For Finance, this structure links vendor payouts to OTP, Trip Adherence Rate, and utilization indices, which makes flex capacity an auditable outcome instead of a fixed cost.
If flex capacity is defined as a banded entitlement, the catalog can specify base capacity and multiple flex tiers. Each tier can carry different SLA and pricing attributes, such as higher per-trip rates for last-minute surge but zero fixed retainers, or discounted retainers for scheduled flex blocks that are locked in advance. This encodes the trade-off between guaranteed readiness and strict pay-per-use economics.
In practice, most organizations benefit from three elements in the catalog for flex capacity:
- A base “committed capacity” layer priced on predictable demand and LTR-style economics.
- A “scheduled flex” layer that can be pre-booked for known peaks and billed on reserved blocks within utilization thresholds.
- A “true surge” layer billed only on actual completed trips, subject to higher per-unit pricing but zero dead-mile commitments.
Command center tooling and data-driven insights are needed to support this model. Facilities and Finance should both have access to a single-window dashboard that shows live flex capacity usage, dead mileage against caps, and current OTP%. This helps Facilities tune buffers and helps Finance verify that billed flex aligns with observed utilization.
I do not have this information (please fix this gap).
For campus commutes, what KPIs should we set for access-control/boarding verification so Security is covered but employees don’t get stuck at the gate?
B0282 Access-control integration KPI definitions — In India corporate employee transport for campuses, how do we define service-catalog KPIs for access-control integration (boarding authentication success rate, exception handling) so Security is satisfied while HR avoids employee frustration at the gate?
Service-catalog KPIs for access‑control integration need to prove three things in parallel. They must show that boarding is authenticated and auditable for Security, that delays and friction are tightly controlled for HR, and that exceptions are handled fast and fairly in real time. Each KPI should be defined per service line in the mobility catalog (EMS, CRD, ECS, LTR) and tied to clear SOPs and data sources from the transport system and access‑control system.
A core KPI is the Boarding Authentication Success Rate. This is the percentage of trips where employees are authenticated at boarding via OTP, QR, RFID, or manifest match without manual override. Security sees this as proof of trip ledger integrity and chain‑of‑custody for who actually boarded. HR sees it as acceptable only if it coexists with low friction at the gate.
To prevent gate frustration, a separate Average Boarding Time per Employee KPI is needed. This is measured from first scan/OTP entry to successful authentication. It must be tracked by shift window and route to surface patterns where access‑control or app UX is slowing boarding and causing queues that affect on‑time performance.
Exception handling needs its own KPIs. Exception Rate at Boarding measures how often boarding needs manual override or supervisor intervention. Exception Resolution Time at Gate tracks how quickly no‑record employees, app failures, or ID mismatches are resolved, with a target expressed in seconds, not minutes. A False‑Negative Rejection Rate KPI is also required to reassure HR that valid employees are not being blocked due to data mismatch between transport rosters and access‑control systems.
Security will require Audit Trail Completeness for Boarding Events as a KPI. This captures the percentage of trips where the transport manifest, access‑control logs, and GPS trip data can be reconciled automatically. It provides evidence for incident reconstruction and Health, Safety, Security, and Environment (HSSE) reviews. HR, in turn, will look for Boarding‑Related Complaint Rate and Complaint Closure SLA Compliance as KPIs that link employee frustration at the gate to measurable closure performance.
Practical service‑catalog targets typically bind these KPIs together, for example:
- Boarding Authentication Success Rate ≥ a defined threshold while Average Boarding Time per Employee ≤ a defined threshold.
- Exception Rate at Boarding ≤ a defined threshold with Exception Resolution Time at Gate ≤ a defined threshold.
- Audit Trail Completeness for Boarding Events ≥ a defined threshold with Boarding‑Related Complaint Rate trending down over time.
Such paired thresholds give Security measurable control and evidence while giving HR a guardrail against creating a “security theater” that damages employee experience and on‑time arrival.
At what level should we define the service catalog—by city/site/timeband/vehicle type—so KPIs stay actionable and people trust the reports?
B0283 Choose service catalog granularity — In India corporate mobility operations, what is the right granularity for a service catalog—service line, city, site, timeband, vehicle type—so KPI reporting stays actionable and not a confusing maze that nobody trusts?
In India corporate mobility operations, service catalogs work best when KPIs are defined at a small set of stable “control dimensions” (service line, city/cluster, timeband, vehicle segment, vendor tier), and everything more granular is treated as drill-down, not as a primary KPI slice. Over-granular catalogs by micro-site, lane, or individual route usually collapse into noisy dashboards that operations and Finance do not trust.
The most effective pattern is to anchor the catalog first on service line, because EMS, CRD, ECS, and LTR have different success metrics. Within each service line, organizations then standardize a small number of dimensions that map directly to governance and contracts. City or region is usually one such dimension, because regulatory conditions, supply dynamics, and cost baselines differ by geography. Timeband is another critical dimension for EMS and ECS, because day vs night or peak vs off-peak materially changes safety controls, escort rules, and EV feasibility.
Vehicle type works best at the level of segment and powertrain, not individual models. Segments such as sedan, MUV, shuttle, and coach, combined with ICE vs EV, are sufficient for tracking TCO, Fleet Uptime, EV Utilization Ratio, and emission intensity without overwhelming teams with model-level fragmentation. Vendor should usually appear as a tier or cluster in the catalog, and vendor-specific KPIs are better managed in vendor scorecards rather than cluttering enterprise-wide views.
Service catalogs become unmanageable when every site code, micro-route, or client stakeholder request is added as a standalone catalog entry. A common failure mode is defining KPIs per site and per route for EMS and ECS. These fragmented slices inflate dashboard objects and make trend analysis impossible. Most organizations do better by rolling sites into logical city or zone groupings for standard KPIs and using route-level analytics only as diagnostic drill-down when OTP or safety indicators degrade.
A pragmatic operating rule is to cap primary KPI segmentation at three or four dimensions that map cleanly to decision rights. Transport or Facility Heads typically act on service line, city, and timeband. CFOs and Procurement primarily use service line, city/region, and vehicle segment for Cost per Kilometer and Cost per Employee Trip, and vendor tier for outcome-based commercial reviews. Security or EHS teams care most about service line, timeband, and, where relevant, gender-sensitive night-shift categories to monitor incident rates and escort compliance.
The catalog should therefore be designed so that every KPI view answers a specific owner’s question in one or two clicks. If a KPI slice does not have a clear “action owner” or SLA attached to it, it usually belongs in exploratory analytics, not in the front-line catalog. Service lines, major cities or clusters, timebands, and vehicle segments are durable enough to support benchmarking, vendor comparisons, and outcome-linked contracts without constant reconfiguration.