How to turn scenario models into a 5-lens playbook for daily reliability
This is a practical playbook for Facility Heads who run in-the-trenches operations. It translates complex scenario models into repeatable guardrails your NOC can execute, even when GPS is flaky or drivers are late. Use the five lenses to align governance, resilience, data integrity, people safety, and site-transition planning into a single, auditable playbook that reduces firefighting and keeps leadership calm.
Is your operation showing these patterns?
- Escalations spike during peak/night shifts with no documented playbooks
- GPS/app outages derail live tracking and force last-minute re-planning
- Vendor response delays push manual coordination and scrambling
- NOC staffing buckles under sudden demand swings or after-hours pressure
- Roster changes and policy updates create late-night routing gaps
- Executives keep asking for status updates even when dashboards show 'green'
Operational Framework & FAQ
Defensible scenario governance
Establish repeatable modeling conventions, anchor baselines to SLA and policy, and require explicit sign-offs before decisions. Tie model outputs to guardrails and governance rather than marketing hype.
In our employee transport setup, what exactly is a scenario model, and how is it different from the regular monthly KPI dashboards?
B0552 Scenario models vs KPI dashboards — In India corporate Employee Mobility Services (EMS), what does a “scenario model” actually mean in day-to-day commute governance, and how is it different from a monthly KPI dashboard for OTP, cost per trip, and incidents?
A scenario model in Indian Employee Mobility Services is a forward-looking playbook and simulation tool that prepares transport teams for specific operating conditions, while a monthly KPI dashboard is a backward-looking report that summarizes what has already happened on metrics like OTP, cost per trip, and incidents. A scenario model changes routing rules, fleet mix, buffers, and SOPs before disruption hits, but a KPI dashboard only tells whether targets were met after the fact.
A scenario model is usually built around named operating situations such as “normal working day,” “heavy rain / monsoon,” “political strike,” “citywide event,” or “partial app / GPS outage.” In each situation, EMS teams define expected demand, risk level, fleet requirements, buffer vehicles, escort rules, and special routing logic. Documents like Business Continuity Plans and “Management of On Time Service Delivery” show this by mapping how operations adapt to cab shortages, natural disasters, or political strikes using predefined mitigation steps and additional vehicles.
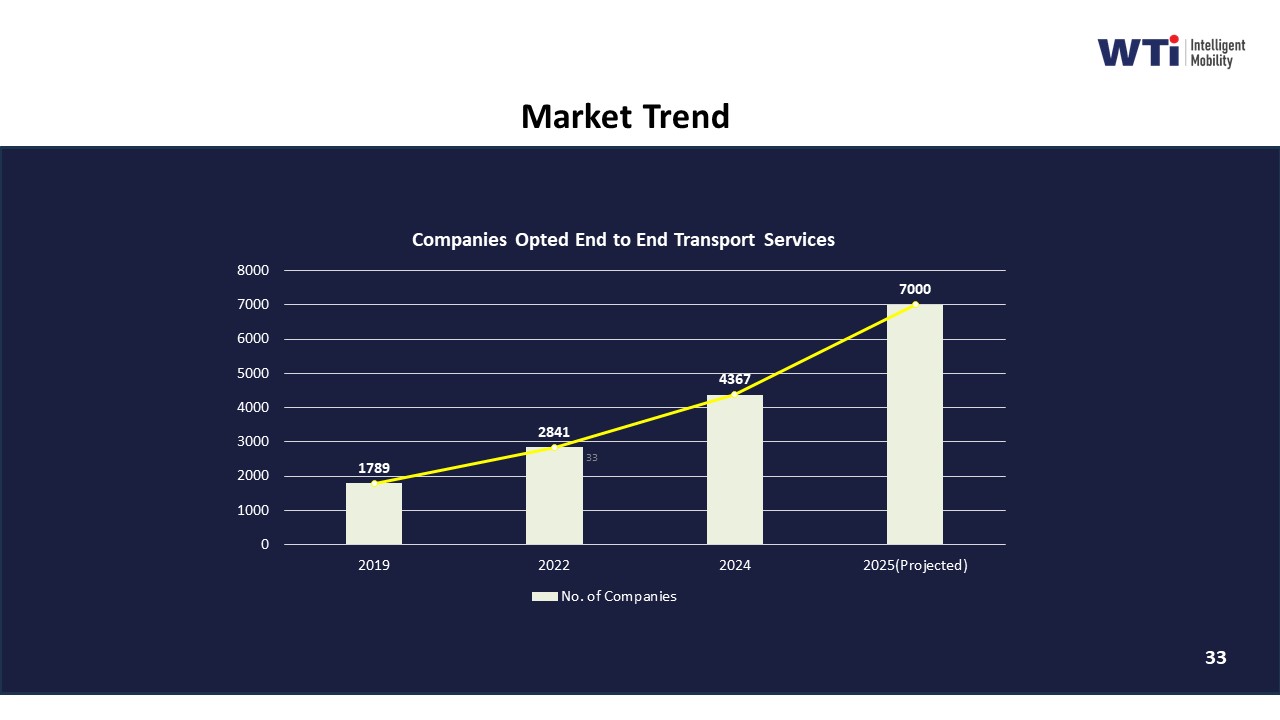
Scenario models also encode trigger thresholds and decisions. For example, specific OTP deterioration, weather alerts, or road-closure information can trigger activation of the “monsoon” or “strike” scenario. This changes how the command center allocates vehicles, sets reporting times, manages vendor support, or escalates to leadership. Case studies, such as the Mumbai monsoon routing example, evidence how a scenario model plus real-time command-center supervision can maintain a 98% on-time arrival rate under stress.
By contrast, a monthly dashboard aggregates performance indicators like OTP%, cost per kilometer, fleet uptime, incident counts, and user satisfaction into a single window for review. Artifacts such as the “Dashboard – Single Window System,” “Indicative Management Report,” and tech-based performance collateral illustrate these dashboards as tools for compliance visibility, operational analysis, and SLA tracking. They support governance, QBRs, and contract discussions, but they do not themselves change live routing or driver instructions.
For day-to-day commute governance, operations teams typically use scenario models to shape live decisions in the command centre and to drive early alerts and playbooks, and then use monthly dashboards to validate whether these choices delivered the expected reliability, safety, cost, and ESG outcomes over time.
Why do companies like ours need what-if models for demand and policy changes if we already have SLAs and penalties with the transport vendor?
B0553 Why scenario models are needed — For India corporate ground transportation programs (EMS/CRD), why do buyers build what-if scenario models for demand volatility and policy changes instead of relying on vendor SLAs and penalty clauses alone?
Buyers in India build what‑if scenario models for demand volatility and policy changes because SLAs and penalty clauses only address failures after they occur, while scenario models help design a transport program that remains stable under stress. Scenario modeling turns unpredictable attendance, hybrid work, and regulatory shifts into quantified capacity, routing, fleet-mix, and commercial decisions that reduce the need for firefighting and escalation.
Vendors can commit to OTP, safety, and uptime through SLAs, but they cannot control core enterprise drivers such as roster volatility, hybrid WFO/WFH switches, new night-shift rules, or sudden site expansions. Scenario models let organizations test different EMS and CRD configurations against these internal uncertainties. This enables buyers to define seat-fill targets, dead-mile caps, and buffer capacity policies that keep Vehicle Utilization Index and Cost per Employee Trip within acceptable bands even when patterns change.
Most Indian mobility programs also face structural constraints such as fragmented multi-city supply, evolving women-safety norms, DPDP-driven data policies, and emerging ESG disclosure needs. Scenario models help buyers understand how changes in escort rules, route approval logic, EV penetration, or shift windowing will impact On-Time Performance, safety incident risk, and gCO₂/pax‑km before they commit to contracts. This reduces dependence on post‑facto penalties and renegotiation.
A common failure mode is over-optimizing SLAs for a “steady state” that rarely exists. When demand spikes, routes change, or work patterns shift, static SLAs and penalty ladders generate disputes rather than operational resilience. What‑if models allow Procurement, Finance, HR, and Transport Heads to align on outcome-linked commercials, flexible fleet sizing, and routing policies that can be adjusted over time, while still remaining auditable and defensible to internal audit and regulators.
How can HR tell if our OTP issues are because attendance keeps changing or because the operator is underperforming, using a simple what-if model?
B0555 Diagnose volatility vs performance — In India corporate EMS shift transport, how can an HR head diagnose whether recurring OTP failures are mainly a demand-volatility problem (attendance swings) versus an operator performance problem, using simple scenario-model inputs rather than opinions?
An HR head can separate demand-volatility issues from operator-performance issues by building a few simple “what should have happened” scenarios from roster data and then comparing them to what actually happened in trip logs and OTP reports. The gap between planned demand and supplied capacity indicates volatility, while gaps between supplied capacity and on-time performance indicate operator failure.
The starting point is to lock one clean baseline week per major shift pattern and export three basic inputs per shift window. HR should collect planned attendance from HRMS rosters, actual swipe or login attendance, and transport trip logs with ETA, ATA, and vehicle counts. For each shift, HR can calculate percentage attendance deviation from plan, vehicle utilization per trip, and OTP by vendor or route cluster.
HR can then model three simple scenarios. In a “stable demand” scenario, HR assumes the actual attendance equals planned attendance and checks if OTP is still poor when seat-fill is within a reasonable band. In a “high volatility” scenario, HR uses actual attendance and checks whether large late bookings or cancellations correlate tightly with OTP drops on specific shifts or days. In a “capacity stress” scenario, HR identifies shifts where seat-fill is consistently very high and checks if OTP degrades mainly on those high-load trips.
Clear diagnostic signals are straightforward to read. If attendance swings are small but OTP is erratic across vendors, times, or depots, then operator performance and command-center discipline are the primary issues. If OTP failures cluster on days or shifts with big last-minute attendance changes or high seat-fill, then demand volatility and current routing rules are the real constraints, and HR should work on cutoff policies, roster-freeze times, and dynamic routing support rather than simply escalating the operator.
As Finance, what scenario-model outputs help us explain cost spikes during audits without relying on the vendor’s black-box assumptions?
B0556 Audit-defensible cost spike narratives — For a CFO evaluating India corporate employee transport (EMS), what scenario-model outputs are most defensible in an audit to explain cost spikes—dead mileage, seat-fill drops, or surge fleet add-ons—without getting trapped in vendor-provided black-box assumptions?
For a CFO evaluating Indian employee mobility services, the most defensible scenario-model outputs are those that decompose cost into simple, audit-traceable drivers such as cost per employee trip, dead mileage percentage, seat-fill ratio, and surge fleet exposure, with each metric directly reconcilable to trip logs, rosters, and invoices. Outputs that separate structural pattern shifts (policy, attendance, shift timing) from vendor-behavioral factors (routing efficiency, fleet mix, EV vs diesel) help explain cost spikes without relying on vendor “black-box” assumptions.
The strongest models start from a clean historical baseline for cost per kilometer and cost per employee trip. They then quantify how much variance comes from three primary levers in EMS: dead mileage above a defined cap, seat-fill drops versus target pooling, and incremental surge vehicles beyond contracted buffers. Each lever should be expressed as both a percentage change and a rupee impact, with a clear link to underlying operational data such as trip manifests, route plans, and attendance records.
A common failure mode is accepting composite “optimization savings” or “algorithmic” adjustments that cannot be re-created from first principles. Auditable models instead expose assumptions explicitly, such as average kilometers per shift window, minimum pooling thresholds, or buffer capacity for peak bands, and allow Finance to sensitivity-test them. This avoids vendor lock-in to proprietary indices and reduces dispute risk during audits.
For EMS in India, CFOs gain particular defensibility when scenario outputs align to outcome-linked procurement logic. Examples include OTP-linked penalties, seat-fill linked incentives, and caps on chargeable dead mileage per route or per vehicle. When scenario models forecast cost spikes, they should also show whether contracted SLAs, such as on-time performance or safety incident rates, improved sufficiently to justify higher spend.
Useful, audit-ready scenario outputs typically include: - Variance-bridges that reconcile month-on-month cost per employee trip changes into contributions from dead mileage, seat-fill, surge add-ons, and shift pattern changes. - Fleet utilization indices that separate contracted capacity from actual used capacity, highlighting under-utilization versus genuine demand spikes. - Route adherence and trip adherence scores that indicate whether higher costs correlate with increased reliability or merely inefficiency.
Scenario modeling becomes most robust when it incorporates basic ESG-linked parameters, such as the share of EV kilometers and emission intensity per trip, but keeps these separate from core financial drivers. CFOs should treat sustainability metrics as an additional layer, not as a substitute for hard unit-economics, so that EV adoption or green initiatives can be defended both on cost and on ESG grounds.
images:
How can scenario models help Procurement avoid picking a vendor that looks cheapest on paper but fails when demand fluctuates?
B0559 Preventing lowest-bid trap — For India corporate EMS vendor governance, how do scenario models help Procurement avoid being blamed for “choosing the wrong vendor” when demand volatility makes the lowest-cost bid look artificially attractive on paper?
Scenario models help Procurement test vendor performance under realistic demand volatility instead of relying only on static, “average case” unit rates. They prevent “wrong vendor” selection by showing how low bids behave when shifts spike, attendance swings, and routing complexity increases, so Procurement can document why a resilient vendor beats the cheapest one in real operating conditions.
Scenario modelling replaces single-point comparison with a structured set of “what-if” runs that mimic hybrid work, peak seasons, and city-specific constraints. Each scenario can apply the same assumptions on OTP targets, seat-fill, dead mileage caps, escort rules, and SLA penalties to all bidders. Procurement can then compare not just rate cards, but cost per employee trip, SLA breach exposure, and fleet utilization across scenarios.
A common failure mode is evaluating vendors only on base CPK or CET without modelling late-night windows, low-demand tails, or event spikes. In practice, the lowest-cost bid often deteriorates fastest when driver retention, fatigue management, and buffer capacity are stressed. Scenario models surface these fragilities before award, so Procurement is not surprised later by hidden dead mileage, surge add-ons, or chronic OTP failures.
For India EMS programs, robust models usually include at least three dimensions.
- Hybrid attendance patterns across weeks, including WFO/WFH shifts and no-show rates.
- City and corridor differences in traffic, monsoon disruption, and night-shift women-safety routing.
- EV vs ICE fleet mix where relevant, including range, charging windows, and uptime parity.
Scenario outputs also create a defensible audit trail. Procurement can attach the model, input assumptions, and comparative outcomes to the RFP file, proving that vendor choice was based on lifecycle economics and SLA risk, not headline tariffs. This documentation is what shields the category manager when leadership later asks why the absolute lowest bidder was not selected, or why a chosen vendor remains the right call despite short-term cost noise.
In an RFP, what what-if questions should we ask to uncover hidden assumptions like peak buffers, dead-mile caps, and roster change delays?
B0565 RFP prompts for hidden assumptions — For India corporate EMS procurement, what scenario-model questions should be asked during RFPs to surface hidden assumptions around peak vs non-peak buffers, dead-mile caps, and roster change latency that vendors often gloss over in proposals?
For corporate EMS RFPs in India, buyers should use concrete “day-in-the-life” scenarios to force vendors to expose how they size buffers, control dead mileage, and handle roster changes under real constraints. Scenario questions work best when they ask for numbers, SOPs, and data, not generic assurances.
Below are concise, scenario-based prompts that surface hidden assumptions.
-
Peak vs non-peak capacity buffers
Ask vendors to respond with exact vehicle counts, lead times, and SLA commitments. -
“For a site with 1,000 daily commuters and three main shift windows (07:00–16:00, 14:00–23:00, 22:00–07:00), what percentage capacity buffer do you plan for each window on: a) a normal weekday, b) a month-end payroll day, c) a festival week with road closures?”
- “In the above scenario, how many standby vehicles per 100 active vehicles will be: a) physically on-site, b) within 30 minutes’ reach, c) purely ‘on paper’ via your wider network?”
-
“If OTP falls below 98% for the 22:00–07:00 window for three consecutive days due to high demand, what is your escalation and buffer-adjustment SOP, and what are the concrete timeframes for adding more fleet?”
-
Dead-mile caps and routing economics
Force vendors to show how they cap dead mileage and who pays when caps are breached. -
“For a campus located 25 km from the city center with dispersed employee residences, what dead-mile cap (as % of total km) do you design for: a) first trips of the day, b) last return-to-garage trips, c) inter-shift repositioning?”
- “If actual dead mileage exceeds your proposed cap by 5%, 10%, and 15% in any month: a) how is this detected, b) how is responsibility apportioned (client policy vs routing engine vs vendor network), c) who absorbs the additional cost under your commercial model?”
-
“Share an anonymized example (before/after) where you reduced dead mileage by ≥10% through route re-design. What design assumptions changed?”
-
Roster change latency and hybrid attendance
Make them quantify how fast they can safely react to late changes. -
“Assume 20% of employees in a shift change their status (WFH vs WFO, different pick-up location) inside the last 90 minutes before shift start.
a) What is your cut-off time for guaranteed routing with SLA-grade OTP?
b) What % of late changes will you accept with full SLA commitment, and what % will be treated as ‘best effort’?” - “Describe, step-by-step, what happens in your system if 10% of riders cancel and 5% new riders are added 45 minutes before shift start.
a) What is the maximum routing recalculation time you design for?
b) What is the maximum additional travel time you allow for existing riders when re-clustering routes?” -
“For each of these latency bands (T‑120, T‑60, T‑30, T‑15 minutes to shift start), specify: a) what types of changes are allowed,
b) what SLA you commit to,
c) how OTP is calculated and reported so Finance and HR can audit the impact.” -
Night-shift and adverse-condition stress tests
Tie buffers, dead miles, and latency to realistic Indian constraints. -
“On a heavy-rain evening with 30% traffic slow-down and 10% driver no-shows in a metro, what are your pre-defined rules for: a) increasing buffer vehicles,
b) temporarily relaxing or tightening dead-mile caps,
c) freezing further roster changes?” -
“In a night-shift scenario with women-first routing and escort compliance, what is the maximum additional buffer you add to fleet and time compared to day shifts, and how is this costed?”
-
Data, governance, and transparency around these assumptions
Ensure the assumptions are visible and auditable, not hidden in the black box. -
“Which specific dashboards or reports will show: a) daily peak vs non-peak buffer utilization,
b) dead-mile % by site and shift window,
c) average and 95th-percentile roster change latency from request to confirmed route?” - “How often can buffer levels, dead-mile caps, and change cut-off times be renegotiated under the contract, and what data triggers those reviews?”
These scenario questions push vendors to expose operational guardrails, not just headline SLAs. They also give Facility/Transport Heads concrete levers to manage OTP, cost per km, and daily firefighting once operations go live.
What’s the minimum scenario model we should run before approving a big policy change or a new site launch—without getting stuck in over-analysis?
B0569 Minimum viable scenario model — For India corporate EMS leadership, what’s the simplest “minimum viable” scenario model to run before approving a major policy change or site launch, so the organization avoids analysis paralysis but still de-risks the big unknowns?
The simplest “minimum viable” scenario model for India EMS leaders is a three-scenario stress test built around one route archetype, one shift band, and one bad-night event, using a small, fixed KPI set. This model trades perfect accuracy for fast learning, so leadership can see reliability, cost, and safety impact before any major policy change or new site launch.
The starting point is a single “reference corridor” per site. This reference corridor is a representative cluster of employees and routes that includes one high-risk band such as a 21:00–06:00 shift with women employees. EMS leadership defines a baseline using existing data for this corridor that includes OTP%, trip fill ratio, cost per employee trip, incident and escalation rate, and no-show rate. This becomes the control to compare against policy or design changes. Policy examples include seat-fill thresholds, escort rules, EV share, or aggregation rules during hybrid workdays.
The minimum viable scenario set then tests three cases on that corridor. The first case is a “business-as-usual” baseline under the current policy. The second case is the “new-policy steady state,” such as higher pooling or more EVs, simulated against the same shift windows and headcount. The third case is a “bad-night shock” where one constraint fails, such as a 20% vehicle shortfall, app downtime for 30 minutes, or a sudden storm, and leaders measure how fast operations recover and what buffers are required.
To keep the model practical, the calculation can stay spreadsheet-based instead of using a full routing engine. Route lengths can be approximated by historical averages per zone and time band. Fleet capacity can be represented by simple ratios like vehicles per 100 employees per shift window, with dead mileage caps or target seat-fill percentages applied. The focus is on relative deltas between scenarios rather than precision forecasting of every trip.
EMS leadership can then set simple go/no-go criteria tied to this corridor-level model. A typical guardrail is that the new policy must not push OTP% below a defined threshold, increase escalations per 1000 trips beyond a tolerance, or increase cost per trip beyond an agreed band unless there is a clear safety or ESG justification. If the bad-night scenario still stays within business continuity thresholds for backup vehicles, manual rostering, and command center load, the policy or site design can move from pilot to scale with confidence.
This minimum model also helps avoid analysis paralysis by deliberately excluding lower-impact variables from the first pass. Instead of modeling every micro-variant, the EMS team can freeze assumptions like driver mix, vendor mix, or small-time-band variations. Only high-leverage levers such as fleet mix, pooling rule, escort or women-safety rule, and EV penetration level are changed between scenarios. This keeps the question focused on whether the system holds under realistic stress, not whether the forecast is perfectly precise.
How do we test if a vendor’s AI routing actually works when we simulate attendance spikes, route blocks, or tighter pickup windows?
B0571 Stress-testing AI routing claims — For India corporate EMS, how can a buyer test whether a vendor’s “AI routing” claims hold up under scenario-model stress tests like sudden attendance spikes, blocked routes, or tightened pickup windows?
For India corporate EMS, a buyer can validate a vendor’s “AI routing” by running controlled, data-backed simulations against known stress scenarios and then checking hard KPIs like OTP%, seat-fill, dead mileage, and exception-closure time before signing scale contracts. The goal is to move from demo narratives to measurable, repeatable outcomes under hybrid-work volatility, safety constraints, and real traffic conditions.
A robust test starts with synthetic but realistic rosters that reflect shift windowing, hybrid attendance, women-first policies, and escort rules. Transport or HR teams should provide historical trip data and define clear KPI baselines such as On-Time Performance, Trip Fill Ratio, and dead mileage. The vendor’s routing engine should then run multiple “what-if” scenarios on this same data, particularly sudden attendance spikes, blocked routes, and tightened pickup windows. AI routing holds up when it consistently maintains OTP and fleet utilization while keeping exception counts and manual overrides low.
Scenario-model stress tests work best when the command center and NOC teams are involved. Operations should track how quickly the routing engine recalibrates under constraints like last-minute bookings, no-shows, and temporary geo-fencing blocks. A common failure mode is that algorithms look efficient on paper but rely on manual dispatch when GPS, driver apps, or telematics streams become unreliable, which exposes weak observability and routing logic. Strong vendors can show audit trails and explain route changes, while weak ones cannot connect their “smart routing” to verifiable service-level metrics.
How can Finance use scenario models to design outcome-linked pricing without creating incentives for the vendor to game closures or avoid tough routes when demand changes?
B0572 Avoiding perverse incentives in contracts — In India corporate EMS contracting, how can Finance use scenario models to set outcome-linked commercials that don’t accidentally incentivize vendors to game the system when demand volatility changes (e.g., manipulating closures or avoiding hard routes)?
Finance teams in India EMS contracts can use scenario-based modeling to stress-test outcome-linked commercials against demand volatility and explicitly cap where vendors can benefit from “gaming” behavior. The core principle is to simulate multiple demand and risk scenarios in advance, and then design KPIs, thresholds, and payout curves so that vendors earn more only when reliability, safety, and cost efficiency improve together, not when ticket closures are delayed or hard routes are avoided.
Scenario models work best when they use real EMS demand patterns, including hybrid attendance, shift windowing, peak vs non-peak capacity, and route difficulty clusters. Finance can combine trip logs, seat-fill data, OTP%, no-show rates, and dead mileage to build a baseline picture of costs per employee trip and per km under “normal,” “peak,” and “disrupted” conditions. These baselines allow Finance to model how different SLA-linked payout formulas behave when volumes spike, drop, or shift geographically.
To reduce gaming risk, outcome-linked commercials should avoid single-metric dependence. OTP-based payouts can be paired with route adherence audits, Trip Adherence Rate, and exception detection-to-closure time so vendors cannot simply cancel or reclassify difficult trips. Seat-fill incentives can be bounded by dead mileage caps so vendors do not over-consolidate at the expense of reliability. Finance can run sensitivity analyses to see how vendor revenue changes if demand swings between different occupancy levels, or if more trips fall into “hard route” buckets.
Three design moves are particularly useful for Finance teams setting these contracts:
- Define scenario bands and guardrails. Finance can predefine demand bands (e.g., low, medium, high attendance or route-mix profiles) and simulate vendor earnings under each band using historical EMS data. Guardrails can cap incentive payouts as a percentage of base revenue per band. This prevents windfall gains in unusual weeks and discourages behavior such as routing away from known congestion corridors purely to protect OTP, because payout upside is constrained unless overall reliability and coverage stay within agreed thresholds.
- Use composite indices instead of raw KPIs. A Service Level Compliance Index that blends OTP%, Trip Adherence Rate, exception closure time, safety incident rate, and seat-fill can dilute the effect of manipulating any single KPI. Finance can scenario-test how the index moves if, for example, OTP is protected by cancelling trips on difficult routes, versus actually improving routing through dynamic dispatch. In such a model, cancelling or avoiding hard routes would hurt Trip Adherence and coverage components, lowering the overall index and thus payouts.
- Encode “hard route” and disruption logic upfront. Finance and Transport can jointly tag routes and timebands by risk and difficulty, based on geo-analytics, monsoon impact, night-shift safety requirements, and congestion history. Scenario models can then test separate payout curves for normal vs hard routes, ensuring vendors are not penalized for taking on difficult corridors. Contracts can mandate minimum service levels per difficulty tier and use Random Route Audits to verify that vendors are not steering away from tagged hard clusters when demand becomes volatile.
When building these models, a common failure mode is ignoring vendor cost structures under low-utilization or high-variance scenarios. Finance should therefore test unit economics from both sides, modeling how fleets, duty cycles, and driver fatigue indices behave when volumes oscillate. If scenario modeling shows that certain outcome-linked penalties push vendors below viable margins in high-volatility bands, Finance can introduce buffers, such as peak-capacity retainers or banded penalties, to preserve vendor stability while still protecting On-Time Performance and safety outcomes.
By treating outcome-linked commercials as algorithms to be stressed under multiple operational scenarios, rather than static rate cards, Finance can systematically identify and patch incentive loopholes before contracts go live. This approach aligns with centralized command-center observability, real-time SLA tracking, and data-driven vendor governance, and it supports a shift toward outcome-based procurement without increasing the risk of hidden gaming or degraded service on hard routes.
What operating rhythm makes scenario models usable—who approves assumptions, how often do we refresh them, and what events trigger re-running them?
B0579 Operational governance for scenario models — For India corporate EMS, what governance rhythm makes scenario models actually get used—who signs off assumptions, how often they’re refreshed, and what triggers a re-run (site launch, vendor transition, policy change, or EV scale-up)?
Scenario models in Indian corporate employee mobility are used consistently only when they are embedded into a formal governance rhythm with clear owners, fixed cadences, and defined triggers for re-runs.
Transport or Facility Heads usually own the operational model and first-cut assumptions because they control rosters, routes, and vendor behavior. CHROs and HR Ops typically sign off people-side assumptions such as shift patterns, work-from-office policies, and women-safety routing norms. CFOs or Finance Controllers validate cost baselines, tariff structures, and savings hypotheses so that model outcomes can be defended in audits. ESG or Sustainability Leads sign off any EV or carbon assumptions before those numbers enter ESG or CSR reports.
Most mature organizations review and refresh scenario assumptions at least quarterly so that shift-windowing, seat-fill targets, and cost-per-trip benchmarks stay aligned with hybrid-work patterns. Some enterprises also include a lighter monthly check-in at a transport governance or command center review to catch obvious drifts in OTP, fleet utilization, or cost per kilometer trends. IT and Security teams usually join only when routing logic, data flows, or safety controls change, but their approval is required for any new data sources or telemetry.
Scenario models are typically re-run on specific triggers. Site launches or closures require fresh routing, fleet-mix, and vendor-allocation models. Vendor transitions or tier changes trigger re-modelling of capacity, SLAs, and standby buffers. Policy changes such as new hybrid-attendance rules, women-first night routing, or revised escort norms force updates to demand patterns and safety constraints. EV scale-up initiatives demand new assumptions on range, charging topology, uptime, and emissions so that EV utilization ratio and CO₂ abatement indices remain credible.
In practice, these models are discussed in scheduled transport governance forums such as monthly service-delivery reviews and quarterly business reviews. These meetings map model outputs directly to KPIs like on-time performance, trip adherence rate, vehicle utilization index, cost per employee trip, and incident rates so that scenario work translates into routes, SLAs, and commercial decisions instead of remaining a one-time planning exercise.
How can we use what-if models to set budget guardrails for demand spikes and expansions so we don’t get surprise invoices mid-quarter?
B0581 Budget guardrails for volatility — For a Finance Controller in India corporate EMS, how can scenario models be used to set a downside-risk cap (budget guardrails) for demand spikes and site expansions so Finance doesn’t face surprise invoices and ad-hoc approvals mid-quarter?
Scenario models allow Finance Controllers in Indian EMS programs to pre‑price “what if” demand patterns and site changes into explicit budget guardrails. Scenario models convert uncertain spikes and expansions into bounded, pre-approved ranges for volume, cost per trip, and vendor commercials so finance teams do not face surprise invoices or frequent mid‑quarter approvals.
Scenario modelling works best when it is built on the same KPIs and constructs used in EMS operations. Finance can collaborate with transport and HR to define baseline parameters such as cost per kilometer, cost per employee trip, trip fill ratio, fleet mix, and on‑time performance expectations. These baselines then anchor multiple demand and footprint scenarios, for example adding new shifts, opening a new site, or raising work‑from‑office targets at an existing location.
Finance Controllers can use three families of scenarios to set downside‑risk caps. The first family models volume variance at existing sites, such as +10% or +25% trips in a quarter, with seat‑fill and dead‑mileage assumptions held constant or tightened. The second family models network changes such as new sites or new cities, where route length, fleet mix, and SLA assumptions are recalibrated for each geography. The third family models strategic shifts such as EV adoption in long‑term rental or EMS, where unit‑economics and uptime assumptions are validated using live EV operations data and carbon abatement metrics.
In practice, guardrails emerge when Finance links each scenario to a specific budget envelope and commercial construct. Controllers can set a base budget for the “most likely” case and a clearly defined ceiling for “stress” cases like rapid headcount growth or mandatory full‑office weeks. Contracts can then codify per‑km, per‑trip, or per‑seat pricing bands, escalation rules, and outcome‑based incentives that are valid up to those scenario thresholds.
To keep scenarios auditable and actionable, Finance can insist on three design rules. Scenario inputs should be traceable to HRMS, ERP, and EMS operational data rather than vendor spreadsheets. Scenario outputs should map to the same reporting structure used for monthly reconciliations and cost reviews. Commercial clauses and SLAs should reference explicit scenario bands, so that any movement beyond the guardrail automatically triggers a review rather than silent cost drift.
This approach reduces ad‑hoc approvals and reactive explanations during audits. It also aligns EMS planning with hybrid‑work elasticity, multi‑vendor aggregation, and EV transition strategies without compromising financial discipline.
images:
As CFO, how do I validate the what-if models for RTO and demand changes so our EMS cost-per-trip forecasts don’t fall apart at month-end?
B0583 CFO sanity-check demand scenarios — In India corporate Employee Mobility Services (EMS), how should a CFO sanity-check scenario models for demand volatility (RTO swings, seasonal hiring, ramp-downs) so the forecasted cost-per-trip and dead-mileage reduction won’t blow up during monthly close?
In India EMS, a CFO should sanity-check demand-volatility models by stress-testing them against real attendance patterns, clearly separating fixed vs variable cost blocks, and validating that routing assumptions match on-ground constraints before locking cost-per-trip targets into budgets. Forecasts that do not reconcile back to HRMS rosters, shift windows, and vendor SLAs usually understate dead mileage and inflate savings.
A robust check starts with data provenance. The CFO should insist that all demand and seat-fill assumptions are derived from HRMS or approved roster data, not from app sign-ups or “average utilization” claims. Monthly forecast volumes should map explicitly to known RTO policies, seasonal hiring plans, and planned ramp-downs. A common failure mode is using a single annual utilization number that ignores high-variance weeks such as quarter-ends or festive seasons.
Cost sanity checks work best when the model is decomposed. The CFO should ask to see cost-per-kilometer and cost-per-trip calculations split into fixed components such as minimum guarantees or base fleet buffers and variable components such as per-km charges or per-seat pricing. If the dead-mileage reduction claim is central to the ROI, then the routing engine’s assumptions about shift windowing, pooling rules, and no-show rates must be made explicit and benchmarked against historic Vehicle Utilization Index and Trip Fill Ratio.
To prevent surprises at monthly close, the CFO should request parallel runs where the EMS vendor’s projected billing is reconciled against current billing for at least one or two pilot sites. Any promised savings from dynamic routing, hybrid fleet mixes, or EV adoption should be validated through these pilots before being annualized. Outcome-linked commercials tied to OTP%, seat-fill, and dead mileage can then be layered on, but only after the CFO confirms that the underlying trip and cost data can be exported, audited, and re-calculated independently.
images:
In our RFP, how can Procurement test the what-if models so vendors aren’t burying risk in utilization and dead-km assumptions?
B0585 RFP-proofing scenario assumptions — In India corporate ground transportation, how do procurement leaders pressure-test scenario models used in an RFP so vendors can’t hide commercial risk in assumptions about utilization, detention time, and dead-kilometers?
Procurement leaders in India corporate ground transportation pressure-test vendor scenario models by standardizing assumptions, forcing vendors onto comparable baselines, and then stress-testing commercial outcomes under multiple utilization and delay conditions before award.
Most organizations reduce hidden commercial risk by explicitly defining baseline inputs such as expected seat-fill, duty hours, dead mileage caps, and typical detention time instead of letting each vendor choose its own assumptions. Procurement teams insist that every bidder price against the same Employee Mobility Services or Corporate Car Rental Services service catalog and shift window definitions. This approach is especially important where hybrid work patterns and variable attendance can otherwise mask real Cost per Kilometer or Cost per Employee Trip exposure.
Scenario models are then stress-tested across low, medium, and high utilization bands to see how commercials behave as Trip Fill Ratio, dead kilometers, and wait times change. A common pattern is to run at least one “bad day” case that includes extended congestion, higher no-show rates, and route recalibration to expose how vendors treat detention and extra kilometers. Outcome-linked procurement language ties payouts to On-Time Performance, route adherence, and seat-fill so commercial models are anchored in observable KPIs instead of optimistic volume projections.
Procurement also uses outcome-based vendor governance concepts such as SLA breach rates and exception-closure SLAs to test whether proposed pricing remains viable when operations are managed through a centralized command center with real-time monitoring. Vendors that resist transparent scenario modeling, or that cannot reconcile their pricing to route design and fleet-mix assumptions, are flagged as higher risk even if headline rates appear lower.
How can leadership use a few clear what-if stress scenarios—like site launch, demand spike, vendor failure—to show we’re ready and stop this coming up in every board review?
B0594 Executive stress-case readiness — In India corporate ground transportation, how can a CEO or COO use scenario models to stop recurring board-level questions about “the transport problem” by defining a small number of stress cases (site launch, demand spike, vendor failure) and proving readiness against them?
A CEO or COO can stop recurring board-level questions about “the transport problem” by hard-coding a few recurring stress scenarios into the operating model and then proving, with data and SOPs, that employee mobility will stay reliable, safe, and cost-controlled under those exact conditions. The most practical stress cases in India corporate ground transportation are a new site launch, a sudden demand spike, and a partial vendor or fleet failure, each modeled with clear triggers, playbooks, and measurable KPIs.
For a new site launch, leadership can insist on a standard “go-live mobility pack” that includes a pre-transition plan, a Project Planner-style timeline, clear infrastructural requirements per branch, and an indicative transition plan that runs from pre-transition to fleet deployment. The model should define upfront buffer fleet, command-center coverage, and compliance checks so that launch readiness can be shown as a checklist instead of a promise.
For a demand spike, the CEO or COO can define what constitutes a spike in employee mobility services or corporate rentals, specify temporary capacity buffers, and pre-approve rapid EV or ICE redeployment using project commute or event commute constructs. Fleet utilization, on-time performance, and exception-closure times become the board-facing metrics that prove resilience.
For vendor or fleet failure, a modelled business continuity plan is essential. This includes explicit coverage for cab shortages, political strikes, and technology failures, combined with a dual command-center structure and escalation matrix that shows who acts, within what SLA, when a vendor or system drops. Readiness is proven through documented BCPs, central command-center workflows, and technology-based observability that links incident detection to closure.
A short set of scenario dashboards can then frame board conversations around stress-tested outcomes instead of anecdotes. The dashboards should expose OTP%, exception latency, EV utilization ratio, and cost per employee trip under each modeled scenario, aligned with business continuity, safety, and ESG targets. This shifts the narrative from “will transport fail again?” to “we know what happens in our top three stress cases, and here is the evidence that we remain within agreed service and risk thresholds.”
For CRD, how can Finance model flight delays, airport waiting, and cancellations so we don’t get billing surprises that become an audit headache?
B0598 CRD delay and billing exposure — For India corporate Corporate Car Rental (CRD) services, how should a Finance Controller use scenario models to estimate exposure from flight delays, airport wait time, and cancellation policies so billing surprises don’t become an audit issue?
For Corporate Car Rental airport use in India, a Finance Controller should build simple scenario models that convert flight delays, free‑wait limits, and cancellation rules into expected monthly cost ranges under different behaviours and seasons. These models must mirror vendor SLAs and billing logic so that “extra” airport charges are predicted, provisioned, and fully reconcilable during audits rather than appearing as unexplained leakage.
The starting point is to codify every airport‑related commercial term from current CRD contracts. Each vendor’s free‑wait window, slabs for extra hours or kilometers, night‑time charges, and cancellation/no‑show rules should be translated into clear formulae for “cost per minute of delay,” “cost per missed pickup,” and “cost per re‑dispatch.” These formulae should be linked directly to the contract text so Internal Audit can trace each scenario back to an agreed term.
Scenario inputs should then be layered on top of this tariff logic. Typical dimensions include historical flight delay patterns by route and time band, planned booking volumes by segment (domestic vs international, peak vs off‑peak), cancellation rates from travel desk history, and night‑shift percentages. Finance can then define three standard scenarios per route cluster. One scenario assumes normal operations with historical average delays. A stress scenario assumes seasonal disruption such as monsoon congestion. A control scenario assumes strict policy compliance with tighter booking cut‑offs and fewer last‑minute changes.
For each scenario, the Finance Controller should estimate the share of trips that fall into free‑wait versus billed‑wait buckets and the share that trigger cancellation or no‑show fees. This produces an expected “airport overhead factor” such as “airport trips typically carry plus 8–12% over base fare during monsoon windows due to wait‑time billing.” That factor can then be embedded into monthly budgets and accrual models. Finance can pre‑define thresholds at which variance against these scenario ranges automatically triggers an exception review with the transport desk.
A common failure mode is to ignore behavioural levers. Scenario models should explicitly test the impact of simple policy shifts on exposure. Examples include enforcing minimum booking lead times for high‑risk routes, aligning free‑wait windows to realistic arrival patterns, or routing more senior executive trips to vendors with more generous free‑wait terms but slightly higher base fares. These what‑if comparisons help Finance justify trade‑offs such as “marginally higher contracted base rate reduces unplanned extras and reconciliation effort.”
To avoid audit friction, Finance should ensure the scenario logic and actual invoices share a single source of truth. Trip‑level data from the CRD platform or vendor MIS should export billed base fare, wait‑time minutes, and cancellation flags in a structured format. That feed can be reconciled monthly against the scenario model so that over‑ or under‑spend is explained by documented changes in flight behaviour, volumes, or compliance. When audit teams ask why airport extras increased, Finance can point to the scenario assumptions, variance analysis, and linked operational drivers instead of relying on ad‑hoc explanations.
In practice, a robust approach for a Finance Controller is to maintain a short, recurring checklist for airport exposure governance.
Key items include:
• Updating delay and cancellation assumptions quarterly based on vendor and airline data.
• Reviewing a sample of invoices where billed wait‑time exceeds a defined threshold.
• Publishing a one‑page “airport terms and cost driver” summary for HR and the travel desk so upstream behaviour aligns with the cost model.
How can Procurement write the RFP so all vendors disclose scenario assumptions—traffic, seat-fill, dead-mile—so we can compare fairly and avoid black boxes?
B0600 Comparable scenario disclosures in RFP — In India corporate employee transport, how can a category manager structure an RFP requirement so vendors must disclose scenario model assumptions (traffic, seat-fill targets, dead-mile caps) in a comparable way rather than using proprietary black-box outputs?
In India corporate employee transport RFPs, a category manager can force comparable, non–black‑box proposals by prescribing a standard “assumptions template” and making its completion a scored, non‑negotiable requirement. Vendors then submit model outputs only alongside declared inputs on traffic profiles, seat‑fill targets, and dead‑mile caps in that common format.
A structured RFP usually works best when the category manager fixes the comparison frame in advance. The RFP can define standard shift windows, sample rosters, and geography clusters, and require every bidder to run scenarios on exactly those inputs instead of their own preferred samples. The RFP can also ask for explicit declarations of targeted Trip Fill Ratio, allowed dead mileage per route, and assumed On‑Time Performance percentage for each scenario, so that procurement can line up vendors on the same KPI axes.
Strong RFPs also separate “what you assume” from “what you promise.” The document can ask for a dedicated “Routing & Capacity Assumptions” annex with parameters such as traffic timebands, seat‑fill targets by shift, fleet mix policies, buffers for peak‑hour variability, and routing recalibration frequency. Scenario outputs like cost per employee trip and fleet size are then evaluated only in light of those disclosed parameters.
To keep vendors from hiding critical logic, the RFP can make disclosure of model constraints and guardrails a compliance item. This may include maximum duty hours, rules on routing women at night, and hard caps on dead mileage. Vendors that do not map these assumptions cleanly to required KPIs like Vehicle Utilization Index and Trip Adherence Rate can be marked down or treated as non‑compliant.
A practical RFP structure often includes:
- A standardized input pack describing rosters, sites, and shift windowing.
- A mandatory assumptions sheet listing traffic bands, seat‑fill goals, dead‑mile caps, and peak buffers.
- A KPI mapping table that links each assumption to outputs such as cost per km, OTP%, and Trip Fill Ratio.
How do we link OTP/closure/seat-fill commercials to agreed scenario baselines so we don’t end up fighting every month about what was assumed?
B0601 Commercials anchored to baselines — For India corporate mobility contracts, what is a practical way to tie outcome-linked commercials (OTP, closure SLAs, seat-fill) to scenario-model baselines so Finance doesn’t get trapped in endless disputes about ‘what was assumed’?
For India corporate mobility contracts, the most practical way to tie outcome-linked commercials to scenario-model baselines is to freeze a jointly validated “design baseline pack” before go-live and then pay incentives/penalties only on clearly defined deltas from that pack. Finance needs the baseline to be version-controlled, data-backed, and auditable so that every later dispute can be answered with “this is exactly what we all signed off.”
First, organizations should separate assumptions from outcomes. The baseline pack should capture shift windows, expected attendance patterns, target seat-fill, agreed dead-mile caps, and committed fleet mix for EMS, CRD, ECS, or LTR. This baseline should sit in a single repository linked to roster data, HRMS, and historic trip logs where available. Any subsequent routing or capacity optimization should be traced back to these frozen inputs.
Second, outcome metrics such as OTP%, complaint closure SLA, Trip Fill Ratio, and exception-closure time should be defined as contract KPIs, not as informal expectations. Each KPI needs a clear formula, data source (command center logs, GPS, ticketing), and minimum sample size per month. This reduces arguments about whether a reported OTP value is “real” or selectively sampled.
Third, the commercial logic should be expressed as simple, laddered bands anchored to the baseline. For example, a banded incentive or penalty around OTP linked to the agreed shift structure, or a per-seat saving share once seat-fill exceeds a baseline threshold without breaching safety or compliance limits. Finance can then reconcile payouts against a deterministic rule-set rather than debating assumptions.
To keep disputes low, organizations should mandate three operational disciplines:
- Monthly joint “assumption variance” reviews that distinguish demand-side changes (e.g., new shift timings, hybrid policy changes) from vendor performance.
- Immutable audit trails from the command center that tie trip events, incident logs, and closure SLAs to specific invoices.
- Explicit change-control for any structural assumption shifts, so a new baseline version is created instead of retrofitting commercials to old scenarios.
When baselines are frozen in an agreed scenario model and every change passes through a simple versioned change-control, Finance gains predictable, defendable numbers instead of recurring arguments about “what was assumed.”
What red flags show the scenarios are just sales theater, and what quick checks can ops run before trusting them for a site launch or vendor switch?
B0602 Spotting scenario model theater — In India corporate mobility platform implementations, what are the warning signs that scenario modeling is being used as ‘sales theater’—and what simple reality checks should a Transport Head run before trusting the numbers for a site launch or vendor transition?
In corporate mobility platform pitches, scenario modeling becomes “sales theater” when it hides operational risk, ignores local constraints, or cannot be traced back to real-world execution patterns. A Transport Head should treat any model as unproven until it passes a few simple, shift-level reality checks using operational metrics and on-ground scenarios.
Warning signs that modeling is sales theater include models that assume perfect OTP and fleet uptime with no buffers, ignore predictable disruptions like monsoon traffic or political strikes, and promise double‑digit cost reductions without explaining dead mileage control or seat‑fill assumptions. Another warning sign is when EV scenarios show diesel‑parity uptime and cost per km without disclosing charging topology, night‑shift feasibility, or fleet mix rules between EV and ICE vehicles. Scenario outputs that quote aggregate KPIs such as “10–15% idle time reduction” or “25% fuel savings” but cannot be mapped to a detailed ETS Operation Cycle, routing logic, or Business Continuity Plan are usually not implementation-ready.
A Transport Head should run basic reality checks before trusting any modeled numbers for a new site launch or vendor transition. The first check is to demand route‑wise and shift‑wise OTP, Trip Adherence Rate, and fleet uptime assumptions, and then stress‑test them against known peak traffic windows, hybrid‑work attendance volatility, and night‑shift escort rules. The second check is to ask for a concrete routing and capacity plan that shows seat‑fill targets, dead‑mile caps, and buffers for driver shortages or vehicle breakdowns, aligned to an ETS Operation Cycle and Command Center escalation matrix. The third check is to verify that modeled EV performance matches proven case studies with six‑month trajectories for emissions, cost per km, and uptime, rather than relying on one‑time snapshots.
A Transport Head can also insist on a limited pilot where modeled KPIs like OTP%, Trip Fill Ratio, and Cost per Employee Trip are compared against live data under typical disruption conditions such as heavy rain or partial tech downtime. Platform claims about AI routing or data‑driven insights should be validated by checking whether the NOC or Transport Command Centre can demonstrate live triage, alerts, and closure workflows instead of static dashboards. Any scenario that cannot survive these simple reality checks should be treated as sales theater rather than a basis for launch decisions.
How can Finance use scenarios to set downside guardrails—like demand spikes or vendor shortfalls—so overruns are capped and board-explainable?
B0605 Downside guardrails for budgets — In India corporate mobility budgeting, how should a CFO use scenario models to set guardrails for downside risk (worst-case demand spike, vendor capacity shortfall) so cost overruns are capped and explainable to the board?
In Indian corporate mobility, a CFO should build 2–3 explicit “stress-test” scenarios around demand spikes and vendor shortfalls, assign each a clear cost ceiling, and then lock these ceilings into contracts, SOPs, and board narratives. Scenario models are most useful when they convert messy operational volatility into pre-agreed ranges for cost per km (CPK), cost per employee trip (CET), and total monthly mobility spend.
A practical starting point is to define a “base case” tied to current roster patterns, seat-fill, and on-time performance, and then layer two downside cases. One downside case should model a worst‑week demand spike from hybrid-work changes or events. Another downside case should assume vendor capacity failure that forces use of higher-cost backup supply. Each scenario should quantify dead mileage, extra fleet buffers, and emergency ECS or CRD usage, and translate these into incremental CPK and CET bands.
Guardrails are most credible when scenario outputs are wired into outcome-linked contracts. A CFO can cap exposure by defining per‑trip and per‑km bands, specifying when surge ECS or spot CRD can be triggered, and tying payouts to OTP%, Trip Adherence Rate, and seat-fill, rather than pure volume. Procurement can then embed surge rules, buffers, and substitution playbooks into the Vendor Governance Framework so that operations cannot exceed the pre-modelled spend without a defined approval path.
To make these guardrails explainable to a board, Finance should maintain a simple bridge: base budget, modeled downside allowances for spikes and vendor failure, and the controls that keep real CPK and CET inside those modeled bands. This links EV transition costs, hybrid-work elasticity, and emergency ECS usage back to a single, defensible narrative of predictable, governed risk.
How should Finance push back on ‘guaranteed savings’ scenarios by demanding sensitivity ranges—traffic, attrition, absenteeism, fuel/energy—instead of one best-case number?
B0609 Savings sensitivities not single number — In India corporate mobility, how should a Finance Controller challenge scenario models that promise EBITDA-impacting savings by asking for sensitivity ranges (traffic, attrition, absenteeism, fuel/energy price) rather than a single ‘best-case’ number?
A Finance Controller in Indian corporate mobility should challenge EBITDA-saving claims by forcing vendors to express outcomes as sensitivity ranges across key drivers like traffic, attendance, driver attrition, and fuel/energy prices instead of a single best-case number. Scenario models become decision-useful only when they show how cost per km, cost per employee trip, and EBITDA move under realistic variability in these parameters.
The Finance Controller should first anchor the conversation in current baselines for cost per kilometer, cost per employee trip, dead mileage, and on-time performance. Scenario outputs should then be requested in low, medium, and high bands for each driver, rather than a single average. Finance should insist that route-optimization, EV transition, and utilization gains are modeled under different traffic congestion and hybrid-attendance patterns that reflect actual shift windowing and peak-load behavior.
A common failure mode is accepting route-cost reduction claims that assume perfect attendance and stable driver supply. Another failure mode is ignoring EV-related exposure to energy tariffs and charging availability when projecting TCO and EBITDA uplift. The Finance Controller should ask vendors to show how EBITDA and CET behave when driver attrition rises, or when Trip Fill Ratio and Vehicle Utilization Index fall below targets.
Key practical asks include: - A sensitivity table that links each 5–10% change in OTP, Trip Fill Ratio, and dead mileage to EBITDA impact. - Separate lines for diesel and EV fleets that stress-test fuel and power price bands. - Explicit linkage between SLA breach rates and expected credit notes or penalties in outcome-based contracts.
This approach reduces the risk of over-optimistic business cases and supports cleaner audit narratives about mobility transformation economics.
For our employee commute program, how can our CFO sanity-check scenario models for attendance swings so we don’t get surprise cost spikes later?
B0612 CFO stress-test demand volatility — In India corporate Employee Mobility Services (shift-based employee transport), how should a CFO pressure-test what-if scenario models for demand volatility so the savings story doesn’t collapse when attendance patterns swing and the monthly mobility bill spikes?
In corporate employee mobility in India, a CFO should pressure-test what‑if models by stress‑running them against real attendance volatility, linking every scenario back to unit economics like cost per employee trip and cost per kilometer, and validating that SLAs and billing logic still hold when rosters and shift-fill swing sharply. A robust model must show how OTP, fleet mix, and dead mileage behave across low, medium, and surge demand, and it must keep invoices reconcilable to trip data even when patterns change week to week.
The first failure point is usually optimistic, “average” attendance assumptions. CFOs should insist on scenarios built from historical roster variability, hybrid-work patterns, and peak events in Employee Mobility Services. A common weakness is models that show savings at 85–90% seat-fill but never simulate what happens to CET when fill drops or when extra cabs are rushed in to protect on-time performance.
A second failure mode is commercials that are not outcome-linked. CFOs should test whether per‑km or per‑trip contracts include guardrails such as dead‑mile caps, seat‑fill thresholds, and OTP‑linked incentives and penalties. Models should explicitly show cost impact when attendance falls but minimum guarantees or long‑term rental style commitments continue.
CFOs also need to test data integrity and reconciliation under stress. Scenario models should be validated against how the EMS platform actually records trips, exceptions, and no‑shows, and whether monthly invoices still tie cleanly back to SLA metrics and trip logs when operations are in firefighting mode. Without that, a “savings” story can vanish into disputes and manual reconciliations once volatility hits.
images:
What are the typical unrealistic assumptions in scenario models—seat-fill, dead miles, driver availability—and how do we catch them before signing?
B0617 Spot unrealistic model assumptions — In India corporate Employee Mobility Services, what are the most common ‘too-good-to-be-true’ assumptions in scenario models (seat-fill, dead mileage, driver availability, traffic, roster stability), and how can Operations expose them before a contract is signed?
Most “too-good-to-be-true” mobility models in India assume away variability in people, vehicles, and traffic. Operations teams need to stress-test these assumptions with real rosters, real-route data, and worst-case day simulations before any contract or SLA is finalized.
Common failure-prone assumptions in EMS scenario models relate to seat-fill, dead mileage, driver availability, traffic, and roster stability. These assumptions usually hold in spreadsheets but break under hybrid attendance, night-shift safety rules, and city-specific congestion patterns. When they fail, on-time performance drops, driver fatigue rises, and escalation load on the transport head increases.
Operations leaders can expose weak assumptions by insisting on a data-backed baseline. This baseline should come from recent trip logs, route adherence audits, and on-ground observations for each major shift window. It should reflect actual Trip Fill Ratios, dead-mileage patterns, and no-show rates rather than vendor-declared norms. This protects the Facility / Transport Head from inheriting an unworkable model that only functions on paper.
Practical guardrails that Operations can use before signing a contract include:
• Running pilot routes using the proposed routing logic and shift windowing.
• Comparing promised OTP%, seat-fill, and Cost per Employee Trip against pilot outcomes.
• Stress-testing driver and fleet availability under night-shift and weekend peaks.
• Incorporating buffer capacity and contingency playbooks into the scope and SLAs.
By challenging optimistic inputs early, Operations can convert scenario models into realistic playbooks. This reduces daily firefighting, preserves driver morale, and keeps leadership escalations under control.
How do we connect the scenario model outputs to billing rules so the ‘expected savings’ don’t become monthly invoice fights?
B0618 Link scenarios to invoice rules — In India corporate Employee Mobility Services finance governance, how can Finance tie what-if scenario outputs (volume bands, route changes, shift elasticity) to invoice rules so ‘model savings’ don’t turn into recurring billing disputes?
In India EMS finance governance, Finance can prevent “model savings” from turning into billing disputes by converting every what‑if scenario assumption into an explicit, machine-readable invoicing rule with a matching audit trail. Finance teams need contracts, billing logic, and reports to use the same definitions for volume bands, route changes, and shift elasticity that the optimization models use.
Finance governance usually fails when commercial constructs drift from operational reality. Modelled seat-fill, dead mileage caps, or volume bands sit in a slide deck, while invoices still follow legacy per‑km or per‑cab practices. A common failure mode is unpaid or disputed invoices because Procurement, Transport, and the vendor interpret “band thresholds,” “minimum billing units,” or “cancellation windows” differently.
To keep scenarios and invoices aligned, Finance can enforce a few concrete disciplines:
- Define canonical units and thresholds. Volume bands, CET/CPK baselines, and shift windows should be parameterized in the contract. The same parameters must drive route optimization and the billing engine.
- Bind SLAs and penalties to measurable EMS KPIs. OTP%, Trip Fill Ratio, dead mileage, and no‑show rules should feed directly into credit notes or penalty lines instead of ad‑hoc negotiations.
- Require a single “trip ledger” as source of truth. HRMS-linked rosters, GPS trip logs, and command-center exceptions should reconcile into one data set that both parties use for billing and dispute resolution.
Operationally, this ties into centralized command-center observability, data-driven insights, and indicative management reports that already track utilization, safety, and exceptions. When those same dashboards also compute billable units per band and show how each optimization scenario changes CET/CPK, Finance gains a defendable bridge from scenario modelling to monthly EMS invoices.
How can our leadership tell if scenario modeling will genuinely reduce late pickups and escalations, instead of just giving us prettier dashboards?
B0619 Prove models change outcomes — In India corporate Employee Mobility Services, how should an executive sponsor decide whether scenario modeling is actually ‘solving the recurring board problem’ versus just producing nicer dashboards that don’t change late pickups or escalations?
An executive sponsor should treat scenario modeling as “solving the board problem” only when it changes operational KPIs like OTP%, exception-closure time, and incident rate, not just how dashboards look. Scenario modeling is valuable when it drives different routing, fleet-mix, and contract decisions that reduce late pickups, driver fatigue, and escalations in measurable, repeatable ways.
Scenario modeling helps when it is wired into the real Employee Mobility Services operating model. Scenario outputs must feed roster design, shift windowing, seat-fill targets, dead-mile caps, EV vs ICE allocation, and buffer policies for peaks or monsoon traffic. Modeling is impactful when the Command Center and routing engine use these scenarios to pre-position vehicles, adjust routes by timeband, and change standby logic before disruptions hit.
A common failure mode is treating modeling as a one-time consulting artifact. In that pattern, teams get attractive visualizations and “what-if” slides, but daily rostering, vendor allocation, and escalation SOPs remain manual and reactive. Another failure mode is focusing on long-range carbon or cost projections without linking them to daily SLA governance, exception workflows, and on-ground playbooks.
To distinguish real value from cosmetic analytics, an executive sponsor can insist on three checks:
- Every scenario must specify which knobs change in operations, commercials, or vendor governance.
- Each knob must have a target delta on OTP%, Trip Adherence Rate, no-show rate, or safety incidents.
- The Command Center must have clear SOPs and authority to act on those scenario-driven thresholds.
If scenario modeling does not alter routing rules, fleet buffers, EV adoption sequencing, or escalation triggers, then it is usually just nicer dashboards and not a solution to recurring board-level questions about late pickups and safety escalations.
How do we use scenarios to test if the pricing still works in a worst month—low seat-fill, more reroutes—so Finance doesn’t get shocked at quarter-end?
B0627 Test commercials under worst month — In India corporate ground transportation vendor selection for Employee Mobility Services, how can Finance use scenario models to test whether the vendor’s commercials still hold under ‘worst month’ conditions (higher cancellations, reroutes, lower seat-fill) so the CFO isn’t surprised at the quarter-end?
Finance can pressure-test Employee Mobility Services commercials by building simple scenario models that stress the vendor’s assumptions on demand, routing, and utilization, then pushing those models to a “worst month” envelope before signing. Scenario models should explicitly vary seat-fill, dead mileage, cancellation rates, and reroute frequency to see how Cost per Employee Trip and Cost per Kilometer behave when OTP and SLA adherence are under strain.
A robust model starts from the vendor’s base case. Finance should capture assumed Trip Fill Ratio, vehicle utilization, dead-mile caps, cancellation norms, and the split between peak and non-peak hours. Finance then builds 2–3 stress scenarios that increase no-show and cancellation rates, add unplanned trips and reroutes, and reduce seat-fill on critical shift windows. The objective is to quantify how quickly commercials drift once routing is no longer perfectly optimized.
A common failure mode is accepting per-km or per-seat commercials that look attractive at ideal utilization but break down when hybrid attendance patterns, weather disruptions, or vendor-side driver shortages hit. A well-constructed scenario model forces the vendor to disclose thresholds where extra charges, minimum guarantees, or surge fleets kick in. Finance can then negotiate outcome-linked clauses, dead-mileage controls, and clear caps on special charges. This reduces quarter-end surprises and aligns payouts with OTP, safety, and utilization KPIs rather than optimistic base assumptions.
Operational resilience playbooks
Turn scenario outputs into concrete NOC playbooks, escalation paths, buffer rules, and recovery procedures. Ensure you can execute within 5 minutes during a disruption.
For airport and intercity bookings, what what-if models help us anticipate flight delays, surges, and driver shortages so exec trips don’t get messed up?
B0567 CRD airport/intercity failure modeling — For India corporate CRD (corporate car rental) airport and intercity operations, what scenario models help a travel desk predict failure modes like flight delays, surge demand, and driver availability so executives don’t experience repeated service misses?
For Indian corporate car rental (CRD) airport and intercity operations, travel desks get the most control by running a small set of repeatable “scenario models” around flight behavior, demand spikes, and fleet/driver risk, and wiring those into SLAs, routing rules, and dispatch SOPs. These models do not need to be complex, but they must be explicit, data-backed, and tied to clear decision actions so executives stop seeing repeated misses.
The first scenario model most organizations need is a flight‑linked risk model for airport trips. Travel desks should maintain airline and route-level patterns for early/late arrivals, average turnaround at the airport, and immigration/baggage delay windows, then translate these into buffer rules for vehicle reporting time and free‑waiting time. When live flight status crosses certain thresholds, the model should drive automatic actions like reassigning the car, switching to a standby vehicle, or extending the waiting window within pre‑defined cost caps. This converts random flight delays into predictable triggers for dispatch and escalation instead of one‑off judgments by agents.
The second critical scenario model focuses on surge demand and overlapping trip windows. Travel desks should forecast demand bands by day of week, time‑of‑day, city pair, and event calendar, and then simulate fleet coverage against these peaks. In practice this means modeling how many airport arrivals or intercity departures can overlap within a 60–90‑minute window before SLA risk rises, and pre‑allocating standby vehicles or multi‑vendor capacity for those bands. This approach reduces denial of service, last‑minute outsourcing at high cost, and cascading delays when one overrun trip blocks the next.
The third model should address driver and vehicle availability and fatigue risk. A basic duty‑cycle and rest‑window model tied to intercity trip lengths, night driving, and expected return times can predict when a driver will be legally or operationally unavailable for the next assignment. If the platform tracks actual duty hours, no‑show patterns, and breakdown history at vehicle level, it can flag high‑risk combinations in advance and push the travel desk to reshuffle drivers, split long intercity legs, or move a trip to a backup vendor. This directly reduces last‑minute cancellations and unsafe over‑utilization that often spill over into VIP service misses.
To make these scenario models operational rather than theoretical, travel desks need simple, codified rules tied to their CRD platform or dispatch process. Typical actions include automatic rerouting of the nearest available car for high‑priority executives when a flight ETA changes, dynamic allocation of a buffer pool of vehicles for known surge bands, and pre‑defined escalation matrices when service level risks exceed agreed thresholds. Over time, historical trip, delay, and incident data can refine thresholds and improve predictions, but even basic models, if consistently applied, materially cut recurring airport and intercity failures.
What should we ask to make sure the what-if model includes real downtime coverage—spares, substitutions, and maintenance—instead of assuming perfect uptime?
B0570 Modeling downtime and continuity — In India corporate ground transportation (EMS/LTR), what should a buyer ask to ensure scenario models include realistic downtime coverage—spare vehicle rules, substitution playbooks, and preventive maintenance windows—rather than assuming perfect uptime?
Buyers of employee mobility services and long-term rentals in India should ask explicit, operational questions about downtime scenarios, replacement rules, and maintenance windows, because most failures occur when vendors implicitly assume 100% uptime and do not codify substitution logic in the operating model or contract.
They should probe how the vendor’s target operating model handles cab shortages, natural disruptions, and technology failures. They should also verify that the business continuity plan, fleet governance, and command-center monitoring are tied to concrete uptime and substitution KPIs, not just high-level assurances.
Key questions to ask in RFPs, reviews, and QBRs include:
- Spare vehicles and buffer logic
“What minimum buffer fleet do you commit per site or per X active vehicles for EMS and LTR?”
“Is the buffer defined by shift window, route type, or volume bands, and how is it recalibrated when demand changes?”
“What is your SLA for replacing a down vehicle mid-shift, and how is this measured in your command center?”
- Substitution playbooks and vendor aggregation
“Show the written substitution playbook you use when there is a cab shortage, driver no‑show, or sudden volume spike.”
“How many secondary or tertiary vendors are tagged per location, and what are the rules for activating them?”
“What is the escalation matrix when the primary fleet cannot meet committed OTP or seat-fill during peaks?”
- Preventive maintenance windows and scheduling
“How do you schedule preventive maintenance for LTR and EMS vehicles so that it does not undermine shift adherence?”
“What percentage of fleet can be simultaneously in maintenance, and how is this capped in the planning model?”
“Show an example month where maintenance, fitness, and compliance renewals are visible in your dashboards and roster plans.”
- Business continuity and disruption scenarios
“Walk through your business continuity playbooks for strikes, natural disasters, and fuel or EV charging disruptions.”
“How do you alter shift times, reroute, or re-cluster employees during city-wide disruptions while protecting safety and OTP?”
“Which specific contingency measures from your BCP have you actually executed for existing clients in the last 12–24 months?”
- Technology and command-center handling of downtime
“What alerts does your NOC or command center raise for vehicle breakdowns, GPS loss, or app downtime, and what are the SLA timers for closure?”
“If the routing or mobility app fails during a shift, what is the manual SOP for continuing operations and reconciling trips later?”
“Can we see your alert supervision system screens that track over-speeding, geofence violations, and breakdowns, and how those link to replacement dispatch?”
- Contractualization of uptime and downtime
“Which KPIs in the contract explicitly measure fleet uptime, vehicle utilization, dead mileage, and exception closure times?”
“How are penalties or earn-backs tied to missed OTP due to preventable downtime versus force-majeure events?”
“Do you provide a performance or bank guarantee that covers chronic under-availability or repeated fleet shortfalls?”
- EV-specific downtime and charging
“How is EV charging scheduled relative to shift windows, and what backup vehicles are committed when chargers or EVs are unavailable?”
“What interim power or on-the-go charging solutions are in place while waiting for DISCOM or during grid outages?”
“Show examples from existing EV operations where uptime was maintained despite charging infrastructure issues.”
- Driver availability and fatigue management
“How do you manage driver duty cycles, rest periods, and training so that driver shortages do not cause hidden downtime?”
“What is your driver pool to active-vehicle ratio for EMS and LTR, and how is fatigue tracked in your command center?”
- Data, reporting, and proof
“Which monthly reports give us visibility into breakdowns, substitutions, and maintenance-related cancellations at route and site level?”
“Can you share anonymized data from another client showing fleet uptime%, incident rate, and replacement times for the last six months?”
These questions force vendors to expose their real buffer design, multi-vendor strategy, maintenance planning, and business continuity plans. They also anchor scenario modeling in measurable uptime, OTP, incident closure, and EV utilization ratios instead of assuming perfect availability in daily EMS and LTR operations.
How can we use what-if models to plan NOC staffing and escalations for peaks and night shifts so the team doesn’t get overwhelmed?
B0574 Sizing NOC for volatility — In India corporate EMS rollout planning, how can an operations manager use scenario models to size NOC staffing and escalation capacity for peak periods and night shifts so the team isn’t overwhelmed during demand swings?
In Indian corporate EMS operations, an effective way to size NOC staffing and escalation capacity is to build simple, data-backed demand scenarios around shift windows, OTP targets, and incident loads, then map each scenario to clear headcount, skill mix, and escalation rules. Scenario models protect NOC teams from being overwhelmed because they convert unpredictable demand swings into pre-defined staffing plans and SOP-driven responses.
A practical starting point is to segment demand by shift bands and days. Operations managers can model separate profiles for early-morning, evening, and night shifts, and for high-variance days like Mondays or month-ends. Each profile should quantify expected bookings, active trips, and critical routes that need closer monitoring, using historical ETS Operation Cycle data, route optimization logs, and on-time performance reports. A second layer adds incident expectations using Alert Supervision System categories such as geofence violations, device tampering, over-speeding alerts, and SOS triggers.
Once baseline volumes are known, operations managers can define three to four discrete scenarios such as normal day, high-load day, disruption day, and severe disruption. Each scenario should have pre-agreed NOC staffing norms, including minimum console operators, a duty manager, and on-call roles from transport desk, vendor partners, and security or EHS. Escalation matrices from the existing governance framework can then be linked to each scenario so incident closure SLAs and night-shift women-safety rules remain intact even under stress.
For night shifts and weather-sensitive cities, transport heads can overlay event-based scenarios such as political strikes, monsoon flooding, or tech downtime, drawing on Business Continuity Plan playbooks and Mumbai monsoon case-study outcomes. These special scenarios define temporary requirements for buffer vehicles, additional NOC staff, and faster decision loops with local command centers. The result is a structured, predictable operating rhythm where staffing and escalation are driven by measurable demand bands and risk exposure instead of ad-hoc judgment.
- Define demand bands by shift and weekday using trip, OTP, and alert data.
- Create 3–4 clearly labeled demand scenarios with volume and risk thresholds.
- Attach staffing norms and escalation matrices to each scenario in advance.
- Drill BCP scenarios for disruptions so the NOC can switch “modes” quickly.
After an incident, how can we use what-if models to show which assumptions were wrong—buffers, escorts, charging uptime—without it becoming a blame game?
B0578 Using models in incident RCA — In India corporate EMS post-incident reviews, how can scenario models be used to show whether the organization’s assumptions about shift buffers, escort availability, or charging uptime were unrealistic, without turning the RCA into a political blame exercise?
In post-incident reviews for employee mobility in India, scenario models work best when they are framed as stress-tests of the operating design, not judgments on people. The core principle is to use data-driven “what-if” runs on the same routing, fleet mix, escort rules, and EV charging topology to show which assumptions were mathematically fragile, while keeping individuals and specific vendors out of the first-line discussion.
A practical pattern is to treat the EMS configuration as a model with explicit parameters such as shift windowing, seat-fill targets, dead-mile caps, escort coverage rules, and EV charging availability. Operations teams can then replay the incident day with alternative parameter sets. For example, they can compare actual OTP and Trip Adherence Rate against scenarios with reduced shift buffers, fewer standby escorts, or lower charger uptime. This reveals whether the original expectations on buffer time, escort density, or charging resilience violated what the model shows as a safe operating envelope.
Scenario models avoid political blame when organizations keep them anchored to measurable constraints and KPIs. Transport and HR teams can present outputs in terms of on-time performance, Vehicle Utilization Index, incident probability bands, and SLA breach risk rather than naming specific actors. A common approach is to frame outputs as “design gaps” in routing rules, fleet electrification roadmap, or command center escalation thresholds that need re-tuning. This links findings to the Target Operating Model, business continuity playbooks, and vendor governance frameworks instead of personal decisions, which keeps the RCA focused on improving the mobility system rather than assigning fault.
For LTR, how should Finance check the downtime and replacement assumptions so availability doesn’t end up needing costly last-minute backup cars?
B0589 LTR downtime and replacement scenarios — In India long-term rental (LTR) fleets for corporate mobility, how should Finance evaluate scenario models for preventive maintenance downtime and replacement planning so ‘assured availability’ doesn’t turn into expensive ad-hoc substitutions?
Finance should evaluate preventive maintenance and replacement scenarios by linking downtime assumptions, uptime SLAs, and replacement triggers directly to cost-per-trip and ad-hoc substitution exposure for the long-term rental fleet.
Finance teams gain control when “assured availability” is quantified as fleet uptime targets, replacement planning rules, and clear Vehicle Utilization Index baselines across the full LTR contract tenure. Scenario models are stronger when they treat preventive maintenance as an input that preserves uptime, rather than as a pure cost line item that can be squeezed without impact. A common failure mode is to under-budget maintenance and buffers, which improves short-term spend but increases dead mileage, SLA breaches, and last-minute spot rentals.
Scenario comparisons should explicitly test how different maintenance cadences and replacement ages affect three outputs. These outputs are LTR uptime percentage versus SLA, CET/CPK including any ECS/CRD backfill, and SLA breach penalties or reputational risk with EMS and project stakeholders. Finance should also require audit-ready evidence from operators on preventive maintenance schedules, uptime history, and replacement playbooks over 6–36 month horizons.
More robust models usually include a defined buffer capacity for LTR, clear downtime and replacement playbooks, and outcome-linked commercial clauses. These clauses tie payouts to uptime, Trip Adherence Rate, and exception-closure SLAs. This approach reduces reliance on reactive ad-hoc substitutions and aligns preventive maintenance, cost predictability, and reliability with the integrated mobility command and governance model.
As NOC ops, how do we use scenarios to set the right contingency buffer—spare cars and on-call drivers—so we avoid night escalations but don’t kill utilization?
B0596 Sizing contingency buffers with scenarios — For India corporate mobility NOC operations, how should an operations manager use scenario models to decide the minimum contingency buffer (spare vehicles, on-call drivers) that avoids 2 a.m. escalations without destroying utilization targets?
For India corporate mobility NOC operations, operations managers should set contingency buffers using quantified “what‑if” scenarios based on historical demand peaks, failure patterns, and SLA targets, not gut feel. Scenario models work when they translate traffic, weather, and roster volatility into guaranteed on-time performance with explicit caps on dead mileage and idle fleet.
The starting point is a clean baseline. Operations managers should segment at least 4–8 weeks of trip data by site, time band, and day of week, then compute on-time performance, dead mileage, and Vehicle Utilization Index for normal days versus stress days. A common failure mode is sizing buffers on average load instead of worst recurring patterns like monsoon days or festival peaks, which pushes problems into the 2 a.m. window.
Scenario models should then test 2–3 discrete operating modes. One scenario can assume a lean buffer to maximize utilization. Another can assume a high buffer to absorb failures such as vehicle breakdowns, driver no‑shows, and route overruns. A third “target” scenario can constrain both OTP (for example, ≥98% as seen in monsoon routing case studies) and utilization, then iteratively adjust spare vehicles and on‑call drivers until both constraints hold in simulation.
For each scenario, the NOC should explicitly model edge conditions that drive escalations. These conditions include partial charger outages in EV-heavy fleets, political or weather disruptions covered under business continuity plans, and night-shift women-safety routing that lengthens actual duty cycles. A common error is to ignore these rare but predictable events in capacity planning, which forces ad‑hoc fixes and burns out both drivers and command-center staff.
In practice, operations managers can encode simple decision rules from these models to keep SOPs clear. Examples include minimum standby ratios by time band, pre-defined “monsoon plan” or “strike plan” buffers drawn from business continuity collateral, and explicit caps on maximum trips per driver per shift to avoid fatigue. These rules convert complex modeling into control-room checklists that can be followed at night without senior supervision.
The trade-off is straightforward. Higher contingency buffers reduce incident risk, late pickups, and women-safety exceptions. However, they also reduce Vehicle Utilization Index and may raise cost per employee trip. The goal of the scenario exercise is not to eliminate risk but to find the smallest buffer that keeps night-shift OTP and safety incidents within acceptable limits while preserving utilization targets and driver retention.
images:
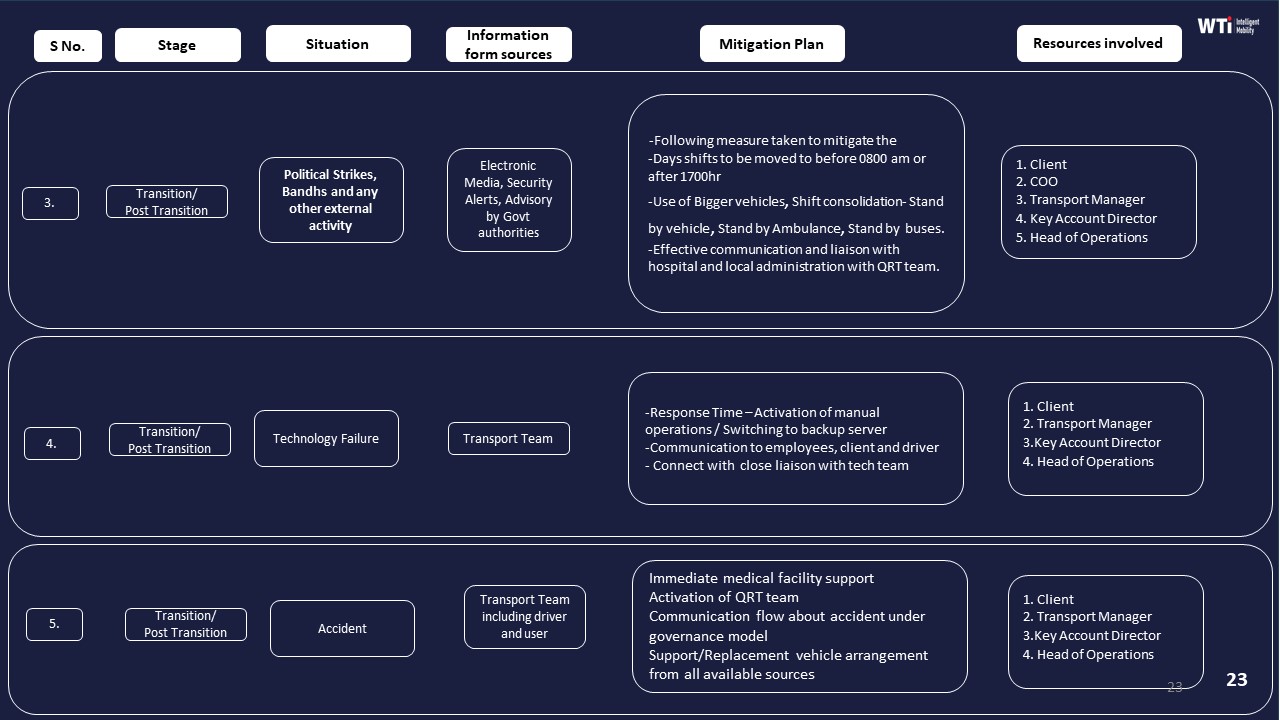
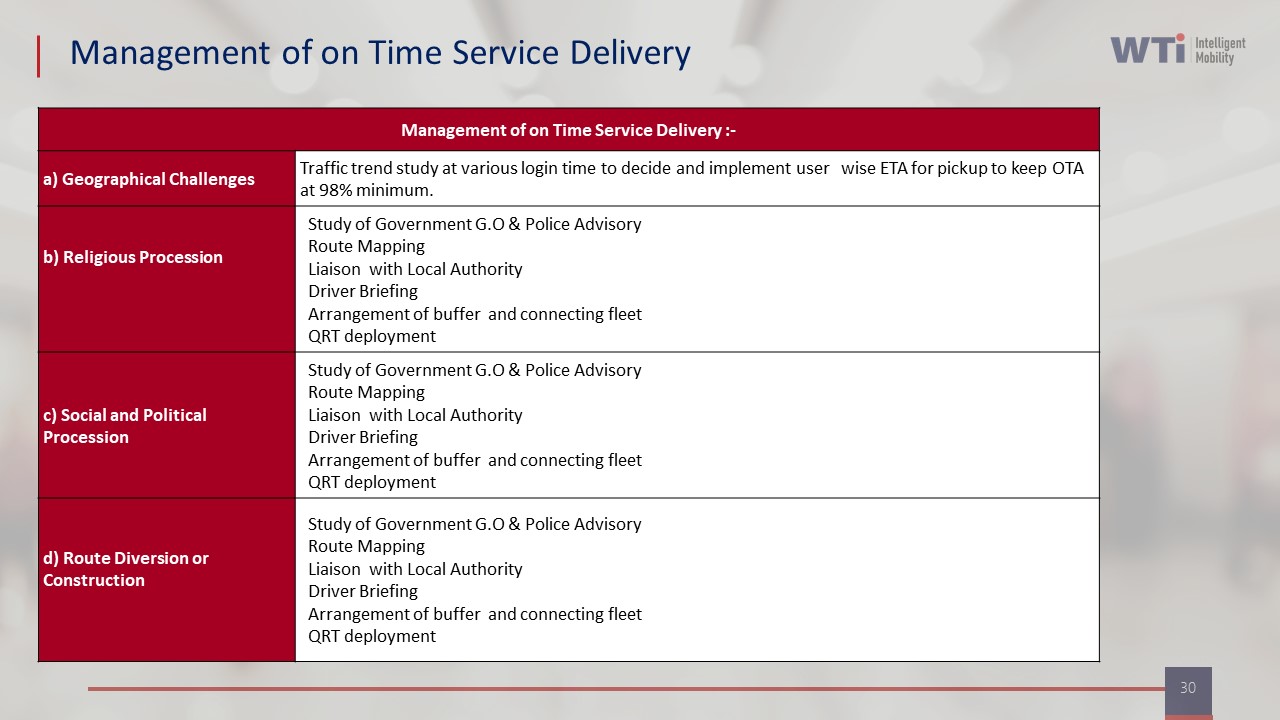
For an event commute rollout, what peak-load scenarios should the project team insist on so day-one crowding and delays don’t become a reputational issue?
B0599 ECS peak-load stress scenarios — In India project/event commute services (ECS), what scenario models should a project director demand for peak-load handling (arrival waves, security checks, parking constraints) to avoid reputational damage from day-one crowding and delays?
In Indian project and event commute services, a project director should demand pre-built, data-backed scenario models for each critical crowd and vehicle pressure point rather than generic “we’ll manage” assurances. These models must explicitly stress‑test arrival waves, security choke points, and parking or holding capacity against time-bound SLAs for zero‑tolerance delays.
A first scenario model should simulate staggered arrival waves. This model should quantify how many employees or delegates reach each gate per 5–15 minute window, how many buses or cabs arrive in each wave, and what happens if one or two waves are delayed by traffic or weather. It should also show contingency routing options and buffers for re-sequencing trips while still meeting shift or event start times.
A second scenario model should focus on security and access control throughput. This model should map the combined impact of badge checks, bag screening, and escort requirements on queue lengths and wait times. It should test best, average, and worst-case processing rates and demonstrate how many entry lanes, security staff, and marshals are needed to keep queue times within acceptable limits.
A third scenario model should stress‑test parking, bus bay, and vehicle holding constraints. This model should define maximum simultaneous vehicle counts at each holding point, boarding bay turn‑around times, and dead‑mileage implications. It should also cover overflow strategies such as off-site holding, looped shuttle movements, and rapid reallocation of vehicles between gates when one zone is under pressure.
A fourth scenario model should cover disruption cases for day one. This model should explicitly test political strikes, technology failures, or sudden no-shows of vehicles and drivers against rapid fleet mobilization plans and temporary route redesign. It should show how fast the operator can activate backup capacity, reroute vehicles, and communicate alternatives to employees while maintaining time-bound delivery.
A fifth scenario model should link operational choices to reputational risk. This model should highlight what happens to on-time performance, crowding, and perceived safety when arrival density, security throughput, or parking capacity go beyond threshold values. It should be explicit about which triggers require early escalation to leadership, security, and facility teams to prevent visible day-one failures.
Before we switch vendors, what scenario tests should we run to make sure the NOC can handle exception spikes—no-shows, breakdowns, SOS—without chaos?
B0608 Exception spike readiness tests — For India corporate mobility operations, what scenario tests should be run before a vendor transition to prove the NOC can handle exception spikes (no-shows, vehicle breakdowns, SOS events) without escalation chaos?
For India corporate mobility operations, scenario tests before a vendor transition should stress‑test the command center’s ability to absorb exception spikes in OTP‑critical shifts without losing control, breaking SLAs, or flooding HR and leadership with escalations. These tests should simulate clustered no‑shows, multi‑vehicle breakdowns, and concurrent SOS events under real shift windows while measuring detection speed, reroute quality, communication discipline, and documentation for audits.
Scenario planning works best when it mirrors live ETS / EMS operation cycles, uses real rosters, and runs through the actual Transport Command Centre dashboards, alert supervision systems, and escalation matrices. A common failure mode is running “happy path” UATs that ignore monsoon traffic, political strikes, or app downtime, which means the NOC only discovers gaps during live night shifts.
Before switching vendors, operations teams should run short, contained drills in low‑risk windows, then graduate to full‑load simulations across multiple locations, with Procurement, HR, Security/EHS, and IT observing how the NOC coordinates buffers, standby vehicles, and driver fatigue management while maintaining compliance and women‑safety protocols.
Key scenario tests to run:
- Clustered no‑shows on critical shifts. Simulate 10–20% driver no‑shows in a single timeband, including female‑heavy and night shifts. Measure how quickly the NOC detects missing check‑ins via the driver app, reassigns vehicles, and updates employee apps and HRMS‑linked rosters without breaching escort or women‑first policies.
- Multi‑vehicle breakdowns during peak. Create concurrent “vehicle breakdown” events on live routes, forcing use of buffer fleet and associated vendors, as described in business continuity plans and fleet compliance frameworks. Track whether replacement ETAs, driver and vehicle credentials, and route adherence remain auditable.
- Simultaneous SOS and safety alerts. Use the SOS control panel and employee app to trigger multiple panic events, including a women‑only cab at night. Validate that the command center follows defined safety and security SOPs, engages Security/EHS and local authorities where required, and maintains chain‑of‑custody on GPS and trip logs.
- Technology outage with manual fallback. Induce partial app/GPS downtime and force a switch to manual dispatch and telephonic control room operations, as anticipated in contingency and business continuity plans. Measure whether OTP and safety monitoring remain acceptable during degraded tech performance.
- Adverse weather or civic disruption. Replay the kind of monsoon or strike conditions shown in existing case studies by compressing travel speeds and closing key routes. Validate that dynamic route optimization, early alerts, and coordination with local authorities keep on‑time performance near the targeted 98% threshold.
For each scenario, the NOC should produce time‑stamped incident logs, escalation trails, and closure reports that can be reviewed by HR, CFO/Procurement, Security, and ESG leads. A scenario passes only if the NOC preserves operational calm at the floor level, keeps exceptions from reaching senior leadership as “surprises,” and generates evidence suitable for audits, carbon reporting, and safety investigations.
How can we use scenario models to plan for disruptions like monsoons or road closures so our control room isn’t improvising every time?
B0623 Disruption planning via scenarios — In India corporate Employee Mobility Services, how should Operations use scenario models to plan ‘bad days’ (monsoon flooding, road closures, city curfews, major events) so the NOC has a defensible playbook instead of improvising during every disruption?
In corporate Employee Mobility Services in India, operations teams should pre-build a small set of disruption “scenario models” with clear triggers, routing rules, capacity buffers, and escalation steps, so the NOC executes a tested playbook instead of improvising during monsoon floods, road closures, city curfews, or major events. Each scenario should define the expected impact on on-time performance, fleet availability, and safety, with pre-agreed SOPs for HR, Security, vendors, and drivers.
Operations leaders gain control when scenario models are designed from real patterns rather than imagination. WTi’s Mumbai monsoon case shows that monsoon-specific route optimization, real-time driver–command center communication, and traffic trend analysis supported a 98% on-time arrival rate and a 10% increase in customer satisfaction. Bad days become manageable when the NOC can switch to such a predefined “monsoon mode” instead of negotiating every route from scratch.
A common failure mode is treating each disruption as unique. Most “bad days” fall into a few repeatable categories. Scenario models for monsoon flooding, political strikes, technology failures, cab shortages, and natural disasters already exist in WTi’s Business Continuity Plans. These documents define mitigation such as altering shift times, buffer vehicles, backup systems, emergency communication channels, and coordination with local authorities. The NOC should map these BCP items into operational checklists and routing templates that can be activated with a single decision.
For the Facility / Transport Head and NOC, the practical structure is:
Define scenarios and triggers. Classify 5–7 high-impact scenarios such as “Level 1–3 monsoon disruption,” “city-wide bandh/curfew,” “major event congestion,” “tech platform outage,” and “sudden cab shortage.” Attach objective triggers like IMD alerts, police notifications, or platform uptime thresholds.
Pre-bake routing and capacity rules. For each scenario, specify routing priorities, blacklisted roads/areas, detour corridors, and seat-fill targets. Use historic data and case studies to set realistic expectations for ETA and OTP. WTi’s dynamic route optimization under monsoon conditions is an example of how to design monsoon-specific routing rules while preserving safety.
Plan buffers and vendor roles. Translate BCP guidance on buffer vehicles and associated business support into concrete numbers per shift and per corridor. Decide which vendors or fleet types (ICE vs EV) are preferred for specific disruptions, using existing fleet compliance and induction frameworks and the hierarchical team structure to assign responsibility.
Lock communication and escalation SOPs. For each scenario, pre-draft notification templates to HR, Security/EHS, and employees. Link them to escalation matrices and the Transport Command Centre role definitions so everyone knows who approves shift time changes, temporary pick-up points, or temporary relaxations of normal routing rules.
Integrate with tech and dashboards. Tie scenario activation to the command center and dashboards such as the single-window system and data-driven insights platform. When a scenario is active, the NOC should see tailored KPIs like OTP, Trip Adherence Rate, and exception closure times, plus safety alerts from the Alert Supervision System and SOS panel.
Rehearse and refine. Use the “Micro functioning of command centre” and HSSE reinforcement tools to run periodic drills. After each real incident, capture learnings into the Business Continuity Plan and update the scenario model, so the next occurrence is handled with less firefighting.
When scenario models are implemented this way, bad days become a switch from “normal” to “scenario mode” in the NOC. Operations still reacts to live data, but within a pre-agreed envelope for routing choices, capacity decisions, and communication. This reduces 2 a.m. decision fatigue, makes outcomes auditable for HR, Security, and ESG stakeholders, and gives the Facility / Transport Head a defensible story for every disruption.
How can our team check that scenario outputs match what the control room sees in reality, so the model is trusted and not seen as ‘Excel theatre’?
B0635 Reconcile model to NOC reality — In India corporate Employee Mobility Services, how should a transport analyst validate that scenario model outputs (fleet count, route count, km, seat-fill) reconcile with what the NOC actually observes in real time, so the model earns trust instead of becoming ‘Excel theatre’?
In India corporate employee mobility, scenario models earn trust only when every fleet and routing output can be reconciled against NOC trip logs, GPS traces, and roster data using a repeatable, auditable checklist. A transport analyst should treat the model like another “virtual vendor route plan” that must pass the same SLA, utilization, and compliance tests that the command center already lives by every shift.
The analyst should first lock a clear baseline by extracting one or two “steady” weeks of NOC data. Each route, vehicle, and shift window should be summarized into canonical KPIs such as fleet count by timeband, route count by shift, total live km, dead mileage, and Trip Fill Ratio. These baseline metrics must come from the same telemetry and trip ledger that operations, HR, and Finance trust for OTP and billing, not from any parallel spreadsheet.
The scenario engine should then be run on the exact same bookings, rosters, and shift windows that the NOC handled in that baseline period. This avoids hypothetical demand and forces a like-for-like comparison. The analyst can then compare model vs actual at three granularities. First, at aggregate level for fleet count, total km, and route count per shift. Second, at pattern level, checking whether peak-hour vehicle curves and route-length distributions resemble what the NOC sees. Third, at exception level, where obviously infeasible suggestions such as unachievable ETAs or back-to-back duties that violate driver rest norms should be surfaced and marked as invalid.
Any claimed gains in fleet reduction, km reduction, or improved seat-fill should be reconciled through a simple “bridging table” that explains every delta in operational language. For example, reductions should be explicitly linked to higher pooling, better shift windowing, or elimination of specific dead-mile patterns that are visible in NOC telemetry. A common failure mode is to show large savings that depend on relaxing real-world constraints such as escort rules, buffer times, or vehicle-type allocation, which the analyst must clearly flag as assumptions that operations and Security can accept or reject.
To embed trust, the analyst should co-create a validation SOP with the NOC and Transport Head. This SOP should define input data sources, constraint sets, validation thresholds for OTP and duty cycles, and a standard report that overlays model routes on actual GPS paths for a small sample of representative days. Discrepancies beyond agreed thresholds should trigger model tuning or constraint tightening rather than manual overrides. Over time, the same reconciliation method can be tied into vendor governance, cost-per-trip tracking, and hybrid-work demand patterns so that scenario planning becomes an extension of daily command-center decision-making instead of a disconnected “Excel theatre” exercise.
images:
Data integrity, transparency, and auditability
Ensure data lineage, exportable inputs, auditable calculations, and detection of false confidence. Prevent black-box modeling from eroding trust.
From an IT view, what data/integration issues usually make what-if models unreliable, and how can we spot them early during diligence?
B0561 Detecting model trust blockers — For a CIO in India corporate mobility (EMS/CRD), what are the common data and integration blockers that make scenario models untrustworthy—HRMS roster mismatches, inconsistent trip logs, or closed vendor APIs—and how do buyers detect these early in diligence?
Most CIOs find mobility scenario models untrustworthy when upstream data is inconsistent, schemas are opaque, or vendors prevent direct access to raw trip and telematics data. Scenario quality collapses when HRMS rosters, trip logs, and billing feeds cannot be reconciled into one coherent trip lifecycle, or when vendor APIs are closed, unstable, or undocumented.
The most common blockers start with HRMS and roster integration. HR systems, attendance logs, and transport rosters often diverge, so employee master data, shift timings, and eligibility rules are not aligned with what the routing engine uses. This misalignment corrupts demand baselines and invalidates any “what-if” fleet or EV mix simulations. CIOs also encounter inconsistent trip logs where GPS traces, duty slips, and invoices do not match, which breaks trust in KPIs like On-Time Performance, Trip Adherence Rate, or Cost per Employee Trip.
A further blocker is closed or immature vendor APIs. CIOs frequently see mobility platforms that do not expose stable, well-documented APIs or raw exports, making it impossible to feed a mobility data lake, apply anomaly detection, or build digital twins. Without reliable integration to HRMS, ERP and telematics, scenario outputs become vendor narratives instead of enterprise-governed models.
CIOs detect these risks early by insisting on technical diligence before commercial closure. They request sample data dumps for a few weeks of trips, cross-check them against HRMS rosters and billing, and look for reconciliation gaps. They review API documentation, rate limits, and event schemas rather than accepting slideware descriptions of “open integration.” Many also ask vendors to walk through an end-to-end ETS or CRD operation cycle using real data, checking whether every booking, routing change, and exception leaves an auditable, machine-consumable trail.
Signals that a scenario model will not be trustworthy include frequent manual overrides in routing and billing, fragmented dashboards that cannot drill down to raw events, and inability to compute core KPIs like Vehicle Utilization Index or Trip Fill Ratio from exported data alone. CIOs who prioritize HRMS integration, data provenance, and audit-ready trip ledgers during diligence are better able to reject platforms whose optimization claims cannot be independently verified.
How should we stress-test EV vs ICE economics so the model includes charging downtime and replacement vehicles, not just per-km cost?
B0562 Stress-testing EV/ICE economics — In India corporate ground transportation (EMS/LTR), how should Finance stress-test EV/ICE mix economics in a scenario model so it includes charging downtime assumptions, vehicle replacement needs, and service continuity risk—not just headline per-km cost?
Finance teams should stress-test EV/ICE mix economics in India EMS/LTR by building a scenario model that treats per-km cost as an output of reliability, uptime, and continuity assumptions, not as the starting point. The model should explicitly layer charging downtime, replacement vehicles, and service-continuity buffers into fleet-uptime, cost-per-trip, and penalty-risk calculations for each mix.
The scenario model works best when it starts from shift design and service obligations in employee mobility services and long-term rental contracts. Finance can map typical duty cycles, night-shift windows, and OTP or service-level requirements, then test how different EV penetration levels impact fleet uptime, dead mileage, and buffer fleet requirements. Charging downtime must be modeled as a structured loss of productive hours per EV duty cycle and then translated into extra vehicles, charging points, or revised rosters needed to maintain on-time performance and SLA compliance.
Service continuity risk should be priced directly into the economics using buffers and business continuity planning. Finance can assign cost to standby vehicles, multi-vendor capacity, and emergency playbooks, and link these to the likelihood of disruptions such as charging failures, infrastructure gaps, or monsoon-related routing disruption. Replacement needs over the contract tenure can be modeled using uptime targets, preventive maintenance assumptions, and a planned schedule for swapping out vehicles that fall below performance thresholds.
To make scenario outputs useful for decision-making, Finance can run side-by-side EV-heavy, ICE-heavy, and hybrid-mix cases. Each case can be evaluated on cost per employee trip, cost per reliable shift (including buffers and penalties), and risk-adjusted fleet utilization indexes rather than a single fuel cost metric. The most resilient mix is usually the one that keeps OTP and safety compliance stable under stress scenarios while keeping total cost of ownership defensible to auditors, procurement, and ESG stakeholders.
How can we use scenario models for emissions reporting without greenwashing—especially when charging downtime, routes, and seat-fill keep changing?
B0563 Audit-ready ESG scenario credibility — For an ESG lead in India corporate employee mobility (EMS/LTR), how do scenario models avoid greenwashing by showing auditable baselines and sensitivity to EV charging downtime, route changes, and occupancy (seat-fill) shifts?
Scenario models avoid greenwashing when they start from auditable baselines and then explicitly stress‑test EV outcomes against charging downtime, route changes, and occupancy shifts rather than assuming ideal conditions.
For an ESG lead in Indian employee mobility programs, credible baselines come from existing EMS and LTR data such as trip logs, fuel consumption, and route patterns reconciled to finance and procurement records. Scenario models are more defensible when the same data pipeline that feeds billing and OTP reporting also feeds emission intensity per trip and gCO₂/pax‑km, creating a single source of truth for Scope 3 commute emissions. Auditability improves when trip-level logs, GPS traces, and roster data form a traceable chain-of-custody for every calculated ton of CO₂.
To avoid greenwashing, EV transition scenarios need sensitivity analysis around charging downtime, route deviations, and seat-fill. Models that show EV uptime parity with diesel only under perfect charger availability are fragile. Robust scenarios use EV telematics, charging topology assumptions, and shift windowing to show what happens when chargers are congested or unavailable, when traffic forces dynamic route recalibration, or when hybrid work reduces occupancy and undermines per-seat abatement. A common failure mode is quoting headline CO₂ reductions without disclosing these assumptions.
Scenario models are stronger when they present ranges, not single numbers, and clearly tag which levers drive variance. Explicit sensitivities to EV utilization ratio, fleet mix policies, Trip Fill Ratio, and dead mileage let ESG leads explain to investors how CO₂ abatement depends on operational reliability, not just OEM specs or citywide EV narratives.
How should Internal Audit check that our what-if assumptions—traffic, no-shows, charging downtime—are documented and traceable enough to defend later?
B0568 Auditability of modeling assumptions — In India corporate Employee Mobility Services (EMS), how should Internal Audit evaluate whether scenario-model assumptions (traffic variance, no-show rates, charging downtime) are documented and traceable enough to defend decisions after an incident or cost overrun?
Internal Audit should test whether every key scenario-model assumption in Employee Mobility Services is explicitly documented, tied to real source data, and version-controlled so it can be re‑created and defended after an incident or cost overrun. Internal Audit also needs to verify that these assumptions are embedded in EMS governance artefacts such as SOPs, vendor SLAs, and command-center playbooks, not just in isolated spreadsheets or routing tools.
Internal Audit can start by identifying the high-impact assumption categories in EMS modeling. Typical examples include traffic variance across shift windows, employee no‑show rates, EV charger availability and downtime, fleet uptime buffers, and seat-fill targets for pooled routes. For each category, Internal Audit should check that there is a written definition, a stated data source, a calculation or estimation method, and a documented review cadence that links back to the operations command center or NOC.
Traceability depends on the ability to walk from a current route or capacity decision back to the specific version of assumptions used at that time. Internal Audit should therefore look for dated assumption registers, change logs for routing or capacity models, and mobility data stores where trip logs, telematics, and attendance data are retained in an audit-ready format. If EMS vendors provide optimization engines, Internal Audit should still insist on human-readable summaries of parameters such as peak-traffic multipliers, no‑show baselines, and EV charging buffers.
A common failure mode is when assumptions are treated as static or “expert judgement” and are not recalibrated after observable changes in patterns such as hybrid work attendance or EV charger reliability. Internal Audit should test whether post-incident reviews and cost-variance analyses trigger updates to these assumptions and whether those updates are recorded along with rationale and approvals by transport and risk owners.
To make conclusions defensible after an incident, Internal Audit should verify three specific signals. First, each critical assumption should be linked to KPIs such as On-Time Performance, Trip Fill Ratio, EV utilization ratio, or fleet uptime, with thresholds that are monitored via dashboards or command-center tooling. Second, exceptions such as repeated charger downtime or abnormal no‑show spikes should generate tickets or deviation reports that are stored alongside the underlying trip data. Third, procurement and contract documents for Employee Mobility Services should refer to the same assumption framework, so that commercial choices on buffers, penalties, and incentives can be reconciled to the scenario models that informed them.
On exit strategy: can we export the scenario assumptions and results in usable formats, or are we locked into the vendor’s modeling?
B0573 Exportability of scenario models — For a CIO in India corporate mobility (EMS/CRD), what data sovereignty and exit-strategy questions should be asked specifically about scenario models—can the buyer export assumptions, scenarios, and results in usable formats to avoid lock-in?
For CIOs evaluating corporate mobility platforms in India, a key safeguard against lock-in is explicit control over scenario models and their data. A robust due diligence approach should require clear rights to export all model inputs, assumptions, scenarios, and results in open, machine-readable formats.
CIOs should first ask what exact scenario artefacts are created and stored by the platform. Each category should be confirmed as exportable. Typical items include routing assumptions, fleet-mix and EV transition scenarios, demand forecasts, cost and TCO projections, and ESG metrics such as emission intensity per trip and carbon abatement indices. The format of export is critical. CIOs should insist on structured formats like CSV, JSON, or open database dumps, rather than vendor-specific binaries or PDFs that are not re-usable.
Governance of intellectual property and data ownership needs explicit clarification. CIOs should ask who owns the configuration logic for routing engine parameters, EV telematics assumptions, and cost baselines. They should also define whether those parameters can be exported if the contract ends. Scenario export should be tested in pilot. The vendor should demonstrate that a complex what-if analysis for hybrid demand or fleet electrification can be reconstructed offline from exported data.
Contract language should link exit rights to data sovereignty. CIOs should define minimum export guarantees for scenario data, telemetry, and KPI layers that feed scenario models. They should also require timelines and support obligations during transition to another provider or internal system. Without these controls, AI routing and analytics features can become a form of lock-in that is hard to unwind later.
What are the warning signs we’re trusting what-if outputs too much, especially if our trip data is messy or inconsistent across vendors?
B0580 Detecting false confidence in models — In India corporate mobility (EMS/CRD), what are the telltale signs that scenario-model outputs are being over-trusted—creating false confidence for executives—especially when underlying trip data has gaps or is inconsistent across vendors?
Scenario-model outputs in Indian corporate mobility are over‑trusted when executives are acting on clean-looking dashboards while the underlying trip data is incomplete, inconsistent across vendors, or not audit‑ready. The clearest signs are when forecasts and “what‑if” views are treated as facts, even though GPS logs, billing records, and HRMS rosters do not line up or cannot be reconciled without manual patchwork.
A common pattern is that route-optimization or cost-projection models assume perfect data from employee apps, driver apps, and vendor systems, but Transport and Finance teams still struggle with basic questions such as “How many valid trips ran yesterday by site and vendor?” or “Which trips have provable GPS and OTP evidence?”. When EMS or CRD providers aggregate data from multiple vendors without standardization, models can mask dead mileage, mis-tagged trips, or missing safety events, while still producing precise-looking utilization, cost-per-km, and OTP projections.
False confidence tends to grow when command-center or dashboard views show strong EV uptime, ESG improvements, or projected cost savings, while on-ground escalations, manual roster corrections, and invoice disputes are rising. A red flag is when scenario analyses around fleet mix, EV penetration, or seat-fill optimization are driving decisions, but transport operations cannot easily produce a consistent trip ledger that matches HRMS rosters, vendor invoices, and NOC logs.
In practice, organizations should treat any sophisticated routing or “digital twin” scenario as provisional until three conditions are visibly in place:
- Trip data is normalized across all EMS and CRD vendors, with a single canonical definition for trip start/end, OTP, and no-show.
- HRMS, GPS/telematics, and billing records can be reconciled for a sample period without heavy manual adjustment.
- Safety and compliance events, such as SOS triggers or women-safety escorts, appear consistently in both operational logs and management reports.
Without those data preconditions, scenario-model outputs can underplay risk, overstate savings, and delay recognition of real-world failure modes like driver fatigue, vendor underperformance, or EV charging constraints.
From an IT standpoint, what do we need so the scenario models are auditable—like version history, data lineage, and exportable assumptions—if audit or DPDP questions come up?
B0587 Audit-ready scenario model governance — For India corporate mobility platforms supporting EMS and Corporate Car Rental (CRD), what should a CIO insist on to make scenario models auditable—versioning, data lineage, and exportable assumptions—so IT can defend decisions under DPDP and internal audit scrutiny?
For CIOs overseeing Indian corporate mobility platforms in EMS and CRD, auditable scenario models require three non‑negotiables. Platforms must provide explicit model versioning, full data lineage from source to KPI, and exportable assumptions in human‑readable form. These capabilities allow IT to defend routing, cost, and EV adoption decisions under DPDP and internal audit scrutiny.
CIOs should insist that every optimization or “what‑if” scenario be tagged with a unique model version ID. The platform should store scenario definitions, algorithm parameters, and code baselines so that past decisions can be replayed. This supports internal reviews on routing decisions, EV fleet mix, and SLA configurations over time.
Data lineage needs to connect raw trip, GPS, and HRMS data through each transformation step to final EMS or CRD KPIs. Platforms should show which tables, fields, and filters fed a scenario, along with timestamps and data sources. This reduces disputes about cost per kilometer, trip fill ratios, or emission metrics by making each number traceable.
Exportable assumptions are essential so Finance, HR, and ESG teams can examine the logic behind scenarios. CIOs should require machine‑readable and human‑readable exports of input distributions, constraints, and business rules used in optimization runs. This supports DPDP compliance by clarifying what personal data was used and allows internal audit to compare actual outcomes against modeled expectations.
CIOs can use three practical checks with vendors:
- Ask for a full replay of a past scenario using stored model version, inputs, and outputs.
- Request a lineage view from raw telematics and HRMS data to a specific EMS or CRD KPI.
- Export all assumptions behind an EV or cost‑reduction scenario and share them with Finance and ESG for validation.
If we’re planning EV adoption, what must be in the EV vs ICE scenario model—charging downtime, range, utilization—so our ESG and cost claims stay defensible?
B0590 Defensible EV/ICE scenario inputs — For EV adoption in India corporate ground transportation, what should an ESG lead require in an EV/ICE mix economics scenario model (charging downtime, range loss, grid variability, utilization) to avoid publishing carbon and cost claims that can’t be defended later?
For an ESG lead, an EV/ICE mix economics model is only defensible if it explicitly encodes operational constraints, exposes underlying assumptions, and links carbon and cost outputs to auditable trip- and kWh-level data. The model must treat charging downtime, range loss, grid variability, and utilization as first-class inputs, not hidden modifiers.
The model should start from operational reality in India corporate transport. It should use shift windows, typical route lengths, and duty cycles from Employee Mobility Services and Corporate Car Rental Services, not generic OEM range brochures. It should differentiate city clusters and timebands where charging gaps, night-shift feasibility, and high-mileage routes create real constraints for EV deployment, and reflect these in the achievable EV share of trips.
Charging downtime must be parameterized by charger type, charger density by site, and realistic queueing and turnaround time. The model should show how downtime affects fleet uptime, vehicle utilization index, and required EV fleet size to maintain the same on-time performance. Range loss must be modeled through explicit derating factors for heat, AC load, traffic, and battery aging, and these factors should be documented so they can be stress-tested by auditors.
Grid variability should be handled via scenario ranges for charging emission factors and tariff structures, with a clear separation between tailpipe CO₂, grid CO₂, and lifecycle blind spots the organization is not yet claiming. Utilization and dead mileage should be modeled separately for EV and ICE segments, with explicit trip fill ratio and idle emission loss parameters that drive both cost-per-km and emission intensity per trip.
To avoid greenwashing and cost overstatement, the ESG lead should require that every carbon and TCO number in the model be traceable back to underlying data points. Baseline and post-transition emissions should be derived from logged kilometers and vehicle type mixes similar to those shown in EV case studies and carbon reduction tables in the collateral, not from abstract “percentage reduction” targets. Assumptions about CO₂ savings per kilometer should be aligned with internally validated benchmarks such as the EV vs diesel comparison tables and the 23–30% reduction outcomes demonstrated in WTi’s EV collateral.
The model should expose at least three scenario bands—conservative, expected, and aspirational—so that leadership and auditors can see how results move when utilization, range, or charger uptime is worse than planned. It should clearly flag what is being assumed about future improvements, such as expansion of fast-charging infrastructure with zero capex to the client or AI route-optimization gains, and should not bake those gains into headline claims until there is live data similar to the six-month EV-transition result snapshots.
Finally, the ESG lead should insist that the EV/ICE mix model share a data schema with finance and operations. Trip-level and kWh-level data must be reconcilable with billing, fleet uptime dashboards, and real-time CO₂ reduction dashboards, so the same evidence can support ESG reports, internal audits, and investor questions without rework.
From an audit perspective, what should we check so the savings scenario models are reproducible and backed by traceable trip data?
B0593 Audit checks for scenario models — For India corporate Employee Mobility Services (EMS), what should an internal audit team look for to verify that scenario models used to justify cost savings aren’t built on non-reproducible assumptions or untraceable trip data?
Internal audit teams should test EMS cost-saving scenario models by demanding reproducible input data, transparent modeling logic, and traceable links between trip logs, routing assumptions, and financial outcomes. Scenario claims that cannot be tied back to governed GPS/trip data, clear routing rules, and finance-reconcilable baselines should be treated as non‑reliable for decision-making or ESG disclosure.
Auditors should first verify data lineage. Trip counts, kilometers, and seat-fill used in models should reconcile to the enterprise mobility data lake or equivalent governed store, not to ad-hoc spreadsheets. GPS logs, telematics feeds, and employee roster data should retain audit trails, with clear retention rules and protection against tampering. Any cost-per-kilometer or cost-per-trip baselines should tie back to Finance-approved billing and invoice data, not vendor-estimated averages.
Internal audit should then examine modeling assumptions. Routing and optimization benefits should be specified as concrete rules such as seat-fill targets, dead mileage caps, and shift windowing logic. EV transition scenarios should be grounded in evidenced fleet uptime, charger availability, and telematics-based utilization, rather than generic promises. If scenario models assume changes in OTP%, Trip Fill Ratio, or Vehicle Utilization Index, auditors should check these against historical KPI trends and live dashboards instead of accepting forward-looking claims alone.
Finally, auditors should assess governance and reproducibility. There should be a documented scenario modeling SOP, including version-controlled models, parameter sets, and approval workflows. Outcome-linked commercial projections, such as CET or CPK reductions, should be re-runnable with the same inputs to produce identical outputs. A common failure mode is when vendors present one-off “AI optimization” numbers that cannot be regenerated from raw data, which breaks auditability and weakens both financial and ESG narratives.
If we push EVs, how do we model charging downtime and queuing so we don’t commit to targets that hurt night-shift reliability?
B0597 EV charging downtime realism — In India corporate EV employee transport programs, how can scenario models incorporate charging downtime and charger queuing so Operations can avoid committing to EV penetration targets that look good on paper but break night-shift reliability?
In India corporate EV employee transport programs, scenario models prevent over-optimistic EV penetration targets only when they treat charging downtime and charger queuing as hard operational constraints rather than afterthought assumptions. Operations teams need route, fleet, and charger simulations that are explicitly built around shift windows, charger density, and real telematics data, so EV share is capped at the point where night-shift OTP and uptime remain within agreed SLAs.
A robust scenario model starts from shift patterns and duty cycles instead of from a target EV percentage. The model should map each route’s distance, dwell times at campuses, and traffic bands against real-world EV range, battery degradation, and charging curve behavior. Charging windows must be assigned per vehicle across the 24-hour cycle, with minimum buffer times and realistic charger turnaround to avoid back-to-back slot assumptions.
Charging infrastructure needs to be modeled as a shared, finite resource. The model should treat each fast charger as a “server” with a maximum number of sessions per night, including connector switching time and occasional faults. Queuing theory can be applied to simulate wait times at different utilization levels for office chargers and on-the-go networks. The scenario must fail any EV mix that pushes average or 95th percentile waits beyond defined OTP and fleet uptime thresholds.
EV penetration scenarios should be evaluated against a small, non-negotiable set of reliability and safety KPIs. These typically include OTP% on night shifts, fleet uptime, incident or cancellation rates, and escort or women-safety compliance adherence under EV-only routing. If an EV-heavy scenario forces tighter turnarounds that increase driver fatigue or erode buffers for monsoon or political disruptions, the model should signal that as an unacceptable configuration.
To keep Operations out of “looks green, fails at 2 a.m.” commitments, scenario outputs must be presented as clear guardrails rather than marketing targets. Useful guardrails include the maximum safe EV share per site given current chargers, the additional chargers required to raise EV share without increasing exception rates, and the specific high-mileage night corridors where ICE backup remains mandatory. These guardrails can then be locked into EV transition roadmaps and business continuity plans, so ESG goals advance only as fast as infrastructure and uptime math allow.
From Legal and IT, how do we check that the scenario models don’t use more personal/location data than needed, and what’s the practical middle ground so ops can still use them?
B0603 DPDP limits on model data — In India corporate employee transport under DPDP expectations, how should Legal and IT evaluate whether scenario models for routing and demand use personal data beyond what’s necessary (location granularity, retention), and what compromises are acceptable without breaking operational usefulness?
Legal and IT teams should treat routing and demand scenario models as high-risk processing that must be justified against a clear, narrow purpose statement for employee transport, and then constrain identity, location granularity, and retention to what that purpose truly requires. Any data element, precision level, or retention period that cannot be traced back to a specific operational or safety need should be removed, downsampled, or anonymized before use in models.
Legal should first lock the lawful basis and purpose limitation. The purpose should be defined explicitly as planning and operating shift-based employee transport, meeting safety obligations, and optimizing fleet and route efficiency. Legal should check that model inputs align with this purpose and do not drift into unrelated profiling such as performance evaluation or off-duty movement tracking. Legal should also confirm that notices to employees describe scenario modelling in plain language, including what is used (e.g., trip logs), why it is used (better routing, safety, cost control), and for how long it is retained.
IT should break down model inputs into categories and assess identifiability. Named identifiers like employee IDs, phone numbers, and exact GPS traces should be removed or tokenized before they reach the modelling environment. IT can require that historical data for scenario planning be aggregated to time buckets and route segments, such as demand per site per 15–30 minute window, instead of continuous, per-person traces. IT should ensure that only the minimal geo-granularity needed for routing is used in models, such as stop-level or neighborhood-level coordinates, not home-door trails that persist beyond the shift window.
A practical compromise is to distinguish three layers of mobility data. The live operations layer can use identifiable, precise location and contact data during the active trip window, because real-time safety control, SOS handling, and OTP-based boarding depend on it. The short-term audit and dispute layer can retain pseudonymized trip event records with timestamps, route IDs, and masked identifiers long enough to support incident investigation and statutory record-keeping. The planning and simulation layer should work only with aggregated and de-identified data such as stop clusters, demand curves by shift band, OTP statistics, no-show rates, and route performance KPIs.
Legal and IT should jointly define retention bands tied to these layers. Live identifiers can be purged or strongly pseudonymized soon after trip closure and operational reconciliation. Aggregated and de-identified data can be retained longer for planning and trend analysis, because reversibility to specific individuals has been removed. Any extension beyond these bands should require a documented risk assessment and business justification.
To keep operational usefulness intact, routing models can be trained on cluster-level origin–destination matrices rather than raw employee paths. Demand models can use attendance patterns by site, shift, and zone instead of individual attendance histories. Scenario tests for EV adoption, fleet mix, or peak-load buffers can run on synthetic or anonymized trip datasets that maintain statistical properties but drop unique path signatures. Where fine-grained history is truly needed for safety or compliance analytics, IT can enforce strict role-based access, logging, and encryption, and Legal can confine use to defined safety and compliance functions, not general HR or performance review.
Acceptable compromises typically include reducing coordinate precision outside a fixed radius of office and official pick-up points, aggregating timestamps into slots, and separating identity keys from route data via tokenization. These changes preserve core routing and capacity decisions such as fleet sizing, buffer planning, and seat-fill optimization. They also reduce privacy risk and make it easier to demonstrate DPDP-aligned data minimization and purpose limitation if questioned by auditors or regulators.
As a transport analyst, how can I track if our scenarios are getting more accurate—forecast vs actual fleet and OTP—without creating a huge reporting load?
B0604 Measuring scenario model accuracy — For India corporate Employee Mobility Services (EMS), how can a junior transport analyst measure whether scenario models are actually improving planning accuracy over time (forecast vs actual fleet, OTP impact), without turning it into a heavy reporting burden?
A junior transport analyst can prove that scenario models are improving planning accuracy by tracking a very small set of stable, shift-level KPIs over time and comparing “plan vs actual” on a fixed template. The analyst should bake this into existing EMS rosters and command-center routines instead of creating a new, heavy reporting layer.
First, the analyst should define a minimal metric set that links planning to operational outcomes. Planning accuracy is best reflected by three lenses. The first lens is the “fleet planning gap” between planned vehicles per shift and actual vehicles used. The second lens is the “seat planning gap” between planned seats and actual manifested employees. The third lens is the “OTP impact” measured by on-time performance percentage and count of late pickups attributable to “capacity / routing” reasons rather than pure traffic incidents.
Next, the analyst should embed data capture into existing tools. The planned fleet and seat counts should be extracted from the scenario model output or routing engine and stored as a simple daily log at shift level. The actuals should be pulled from the EMS operation cycle data, trip manifests, or the command-center dashboard that already tracks routes, trips, and employees moved. The key is to use one simple, standardized table for each day that captures shift window, business unit or site, planned cabs, actual cabs, planned seats, actual boarded seats, OTP percentage, and count of capacity-related exceptions.
Over time, the analyst should review these gaps on a weekly or fortnightly cadence with the transport head and command center. Any consistent reduction in average fleet gap and seat gap that coincides with stable or improved OTP indicates that scenario models are becoming more accurate. Any drop in OTP or spike in exceptions after a model change is an early warning that the scenario logic needs recalibration. This approach keeps measurement light, turns “forecast vs actual” into one living control-room sheet, and allows the operations team to see if new routing assumptions, hybrid-work patterns, or EV mix changes are genuinely improving day-to-day reliability instead of just looking good in a simulation.
If we ever switch providers, what should we require so our scenario assumptions and outputs can be exported and reused, not locked into one platform?
B0606 Scenario portability after exit — For India corporate mobility vendor exits, what should Procurement and IT require so scenario models (assumptions, parameters, outputs) are portable and usable after switching providers, rather than being locked inside a vendor’s platform?
For Indian corporate mobility vendor exits, Procurement and IT should mandate that all routing, cost, and EV/ESG scenario models are documented, exported, and contractually treated as enterprise data, not vendor IP. Procurement and IT should also require API-level and file-based extract formats so assumptions, parameters, and outputs can be replayed or recalibrated on a new EMS/CRD platform without reverse-engineering the old system.
Procurement teams should define in the RFP and contract that every optimization and planning artefact is part of the deliverable. Scenario artefacts include demand baselines by shift window, fleet mix and capacity assumptions, seat-fill targets, dead-mileage caps, EV utilization ratios, charging topology assumptions, and commercial rules for cost per kilometer and cost per employee trip. Contracts should specify periodic exports of scenario inputs and results at agreed cadences, and at exit, a complete “scenario pack” with version history, not just a final static report.
IT should require technical portability by design. This includes documented schema for all model inputs and outputs, open or well-documented APIs for extracting historical simulations and live routing decisions, and export options in neutral formats suitable for a mobility data lake. IT should insist that routing engine decisions, telematics-derived constraints, and ESG calculations are logged with traceable parameters so a new routing engine or EV-planning tool can ingest and reinterpret them.
Procurement and IT should jointly ensure that vendor lock-in is limited by clear clauses on data ownership, data retention, and exit support. Those clauses should cover time-bound post-exit access to the platform for verification, reasonable professional services for migration assistance, and prohibitions on proprietary obfuscation of critical scenario logic that would prevent reconstruction of baselines, sensitivity analyses, or EV transition roadmaps.
After go-live, what governance keeps the scenarios updated when policies or sites change, so the models don’t turn into shelfware?
B0611 Keeping scenarios current post-go-live — In India corporate ground transportation, what post-purchase governance should be in place so scenario models are updated after policy changes (new eligibility rules, new sites) rather than slowly becoming shelfware that nobody trusts?
In corporate ground transportation, scenario models stay trusted when post-purchase governance treats them as a live operational tool owned by a cross‑functional group, not a one‑time consulting artifact. The transport program needs a defined change pathway where every policy change or new site automatically triggers a structured review, data refresh, and revalidation of the model before it feeds routing, capacity, or commercial decisions.
A practical pattern is to anchor model governance inside the existing mobility Target Operating Model. The central 24x7 command center or NOC should maintain the routing and capacity logic as part of Command Center Operations, with clear ownership for data inputs such as HRMS rosters, site codes, and shift windows. HR and Facilities should log new eligibility rules, hybrid‑work changes, or site additions into a structured change register, rather than handling them ad hoc over email or calls.
Most organizations benefit from a simple but strict cadence. Monthly or quarterly governance forums can review key KPIs like On‑Time Performance, Trip Fill Ratio, Cost per Employee Trip, and exception closure latency. Any deviation from baseline should trigger scenario tweaks, A/B tests on routing or fleet mix, and updates to the Mobility Data Lake and semantic KPI layer. Procurement and Finance should insist that outcome‑linked contracts reference the same KPI definitions as the scenario models so commercial decisions remain aligned.
To keep the model from becoming shelfware, three controls are critical. There must be API‑level integration with HRMS and ERP so rosters, entitlements, and financials stay synchronized. There must be continuous assurance through SLA trackers, audit trails, and Random Route Audits that compare planned vs actual trips. There must be an explicit exit and portability clause so data, schemas, and logic can move to a new vendor or platform without losing historical baselines, which preserves trust across policy cycles.
From an IT view, what data export and documentation do we need so our scenario models are portable and auditable if we change vendors later?
B0621 Scenario model portability requirements — In India corporate Employee Mobility Services IT evaluation, what data architecture and export requirements should a CIO insist on so scenario models (assumptions, parameters, outputs) remain portable and auditable if the enterprise exits the vendor later?
A CIO evaluating Employee Mobility Services in India should insist on an open, well-documented data architecture where all routing logic, demand signals, and scenario outputs are stored in enterprise-owned structures and are exportable through stable APIs or bulk dumps in standard formats. The CIO should require that every scenario model’s assumptions, parameters, raw inputs, and outputs are logged with timestamps and identifiers so that they remain auditable and reconstructable even after the enterprise exits the vendor.
The core data model should separate operational trip data, telematics streams, HRMS-linked roster data, and scenario-planning artifacts into a governed mobility data lake or warehouse. The EMS platform should expose this through an API-first integration layer that includes HRMS integration, a geo-analytics layer, and a mobility data lake connector. The scenario engine should read from these governed tables instead of proprietary black-box stores inside the vendor’s stack.
For portability, the contract should mandate documented schemas for trip ledgers, routing decisions, cost metrics, safety events, and ESG indicators like EV utilization ratio or emission intensity per trip. The CIO should insist that all scenario inputs such as fleet mix, shift windowing, seat-fill targets, and dead-mile caps are stored as versioned parameter sets. The system should log each scenario run with a unique ID that links back to the exact data snapshot and parameter set used.
For auditability, every scenario should generate a traceable output set, including route plans, capacity allocations, projected KPIs like OTP%, Trip Fill Ratio, and cost per employee trip. These outputs should be written into tables that preserve audit trail integrity with tamper-evident timestamps and user or system identifiers. The CIO should require that these tables are available for periodic export as CSV or Parquet files along with API-based retrieval.
Key requirements to encode in RFPs and contracts include:
- Clear data ownership in favor of the enterprise and explicit rights to full historical exports at any time.
- Open, documented Trip Ledger APIs to pull trip, routing, and incident data into the enterprise mobility data lake.
- Schema documentation for all core entities used in scenario modeling, including parameters and outputs.
- Immutable or append-only logs for scenario runs, with sufficient metadata to support independent re-computation by another vendor or internal team.
What should we put in the contract so the vendor can’t keep the scenario model as a black box and refuse to share assumptions or logic?
B0622 Anti black-box model clauses — In India corporate Employee Mobility Services procurement negotiations, what contract clauses and acceptance criteria can Procurement use to prevent ‘black-box’ scenario models where vendors refuse to share assumptions, raw inputs, or calculation logic?
In India corporate employee mobility contracts, Procurement can prevent “black-box” scenario models by hard-coding data-transparency, methodology-disclosure, and exit rights into the MSA and SOW. The contract must make access to raw trip and cost data, routing assumptions, and calculation logic a non-negotiable service requirement and a precondition for any optimization- or AI-linked commercials.
Procurement teams typically need three guardrails. The first guardrail is data ownership and access. Contracts should specify that all trip, fleet, routing, safety, and billing data generated under Employee Mobility Services is owned by the enterprise. The MSA should grant the buyer the right to export trip-level datasets, audit logs, and KPI calculations in a standard, machine-readable format on a defined frequency, and on demand for audits and RFP re-bids. This data-access clause reduces the risk of vendor lock-in and helps Finance and Audit reconcile cost per kilometer and cost per employee trip.
The second guardrail is method and KPI transparency. Outcome-linked clauses around on-time performance, trip adherence, dead mileage, or route optimization should define each metric, its formula, and the underlying data fields explicitly in the SOW. The vendor should be obligated to document routing rules, seat-fill logic, and EV-versus-ICE dispatch policies where used. Acceptance criteria can require that scenario models and savings baselines be reproducible from shared data, rather than accepted as proprietary outputs.
The third guardrail is audit and interoperability. Contracts can mandate periodic third-party or internal audits of routing outputs, billing logic, SLA calculations, and EV-usage metrics using the shared raw data. Procurement can require open-API or export capabilities as part of technical acceptance, so that HRMS, ERP, and ESG reporting tools can consume mobility data without relying on screenshots or summary PDFs. These clauses reduce the chance that MaaS convergence, EV optimization, or AI routing claims become unverifiable and keep the enterprise in control of its own reliability, safety, cost, and ESG narratives.
How can our ESG lead and CFO review EV vs ICE scenario models together so charging downtime and uptime assumptions are explicit and agreed?
B0625 Align ESG and CFO on EV — In India corporate Employee Mobility Services EV adoption planning, how should an ESG lead and CFO jointly evaluate what-if models for EV/ICE mix economics so neither side can later claim the assumptions about charging downtime and uptime were ‘hidden’?
In India corporate employee mobility, an ESG lead and CFO should co-own a transparent, data-backed “EV/ICE mix” playbook where charging downtime, uptime, and range assumptions are explicitly documented, stress-tested, and signed off before rollout. The EV transition should be framed as a governed, auditable model with shared baselines, not a one-sided sustainability or cost bet.
Both leaders should start by agreeing what “uptime” means in EMS terms. They should define measurable metrics such as fleet uptime percentage, EV utilization ratio, cost per employee trip, and emission intensity per trip. They should insist that every EV scenario shows its impact on fleet uptime and on-time performance, not just CO₂ and fuel savings. They should treat idle-emission loss and dead mileage as explicit line items in the economics.
The what-if models should use real operational data from current ICE fleets and, where possible, pilot EV deployments. They should vary assumptions across timebands such as night-shift clusters, peak-hour congestion, and high-mileage routes because charging gaps are most visible there. They should model different charging topologies such as workplace fast charging, on-the-go charging, and interim power solutions, with explicit charger density and queue-time assumptions.
A common failure mode is treating EV charging downtime as a generic percentage. The evaluation should instead include route-level and shift-level views that combine battery range, daily kilometers, layover windows, and charger availability, tied to routing engine outputs and command-center operations. The CFO should require side-by-side TCO views for each EV/ICE mix, while the ESG lead validates carbon abatement and Scope 3 reporting logic.
To avoid “hidden” assumptions, the ESG lead and CFO should:
- Document all EV range, charger uptime, and charging time assumptions as explicit parameters.
- Run best/likely/worst-case scenarios for uptime and cost, and log who approved each scenario.
- Link payout or penalty bands in contracts to agreed KPIs such as OTP%, fleet uptime, and CO₂ reduction.
- Use auditable dashboards that track actual uptime, charging events, and CO₂ reductions against the agreed baselines.
images: 
images: 
How should we model EV charging downtime across different shifts so Ops doesn’t get caught in a service failure later?
B0626 Model EV charging downtime — In India corporate Employee Mobility Services, what is the right way to model charging downtime assumptions for EV fleets across shift windows (including night shifts) so Operations can avoid a service failure that becomes a leadership ‘why did we approve this’ moment?
In India corporate employee mobility, EV charging downtime assumptions work best when they are modeled per shift window, per route archetype, and per charger topology rather than as a single “average” number. Operations teams avoid service failures when they translate OEM range claims and charger ratings into conservative, auditable planning rules tied to fleet uptime, EV utilization ratio, and shift-wise OTP targets.
EV case studies in this context show that uptime parity is achievable when EV fleets are paired with adequate fast charging capacity and a clear scheduling strategy. Real-world implementations with 20–50 EVs and 30kW dual-gun chargers have delivered 86–93% uptime and rising, along with 10–15% idle-time reduction, once charging is treated as a scheduled operational activity rather than an ad-hoc task. Operations managers should therefore model downtime as a predictable “charging shift” in the cab duty cycle and not as miscellaneous loss.
The modeling needs to differentiate day, swing, and night shifts for employee mobility services, because range risk and charging access differ sharply by timeband. High-mileage or night-shift routes require tighter buffers and planned mid-cycle top-ups, supported by reliable on-premise or on-the-go charging partners who can guarantee zero infrastructure cost to the client but firm uptime SLAs. Where infrastructure is dense and supported by partners, EVs can be allocated more aggressively; where chargers are sparse, planners should cap EV duty cycles and keep a higher ICE standby ratio.
To keep leadership out of “why did we approve this?” mode, operations teams need explicit SOPs that connect charging downtime assumptions to business metrics and evidence. These SOPs should show how charger count, charger rating, and route length translate into maximum EV trips per shift, required standby vehicles, and committed fleet uptime. They should also demonstrate that EV routing is integrated with rostering and HRMS, so that exceptions like monsoon congestion or late-running shifts trigger early alerts from the command center rather than last-minute failures.
images: 
images: .jpg)
images: 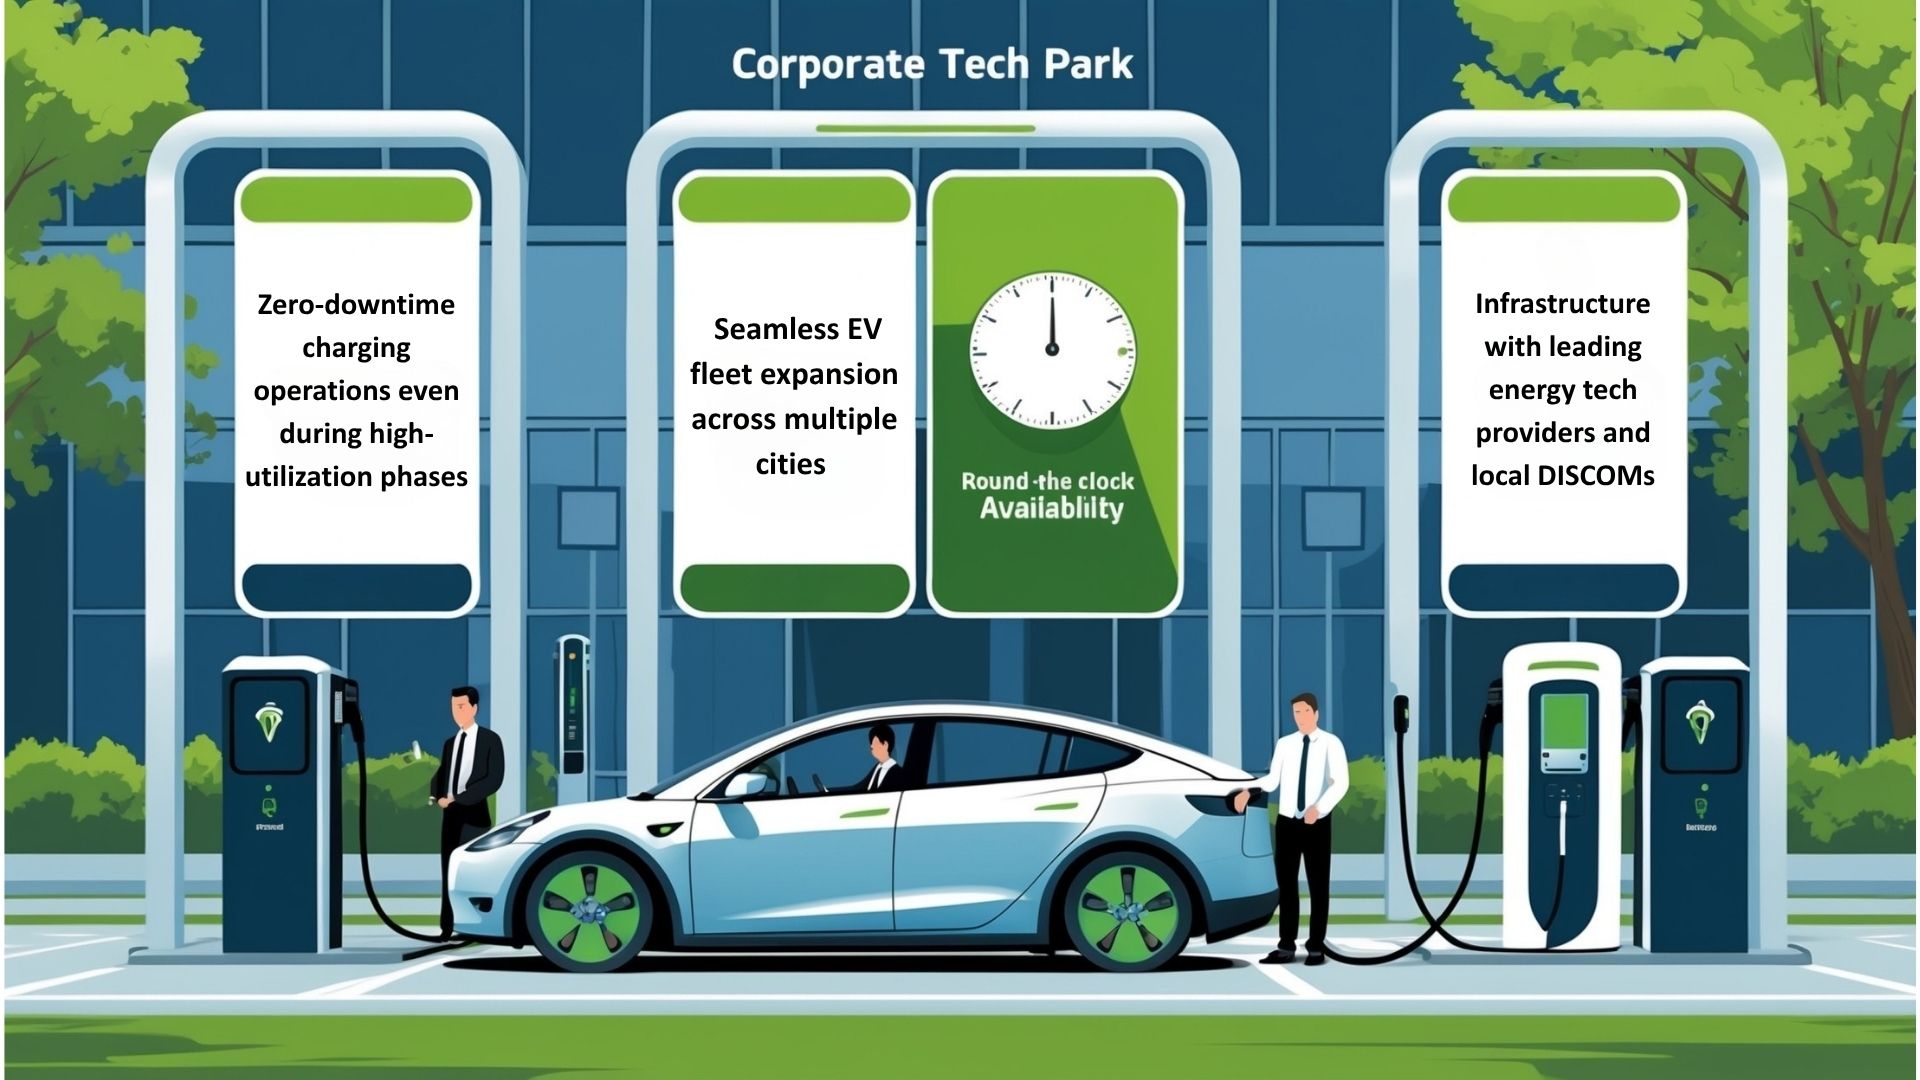
After go-live, what cadence should we follow to keep scenario models updated as policies and attendance change?
B0629 Keep scenarios from going stale — In India corporate Employee Mobility Services post-purchase governance, what operating cadence (weekly scenario refresh, monthly assumptions review, quarterly policy-change simulations) prevents scenario models from going stale as shift policies and attendance behavior evolve?
In India corporate Employee Mobility Services, scenario models stay reliable when operations teams run a weekly route-and-capacity refresh, conduct a monthly assumption and KPI review, and perform a quarterly policy-change simulation with cross-functional stakeholders. This cadence aligns model updates with real shift-windowing, hybrid attendance patterns, and vendor performance, so routing and fleet-planning decisions reflect current behavior rather than last quarter’s reality.
Weekly refresh cycles work best when owned by the transport / facility head with vendor and command-center support. These cycles typically use latest rosters, HRMS attendance, and on-ground exceptions to recalibrate routing, seat-fill targets, dead-mile caps, and buffers for night shifts or peak windows. Weekly governance helps catch demand drift, emerging bottlenecks, and driver-fatigue risks before they show up as chronic OTP failures.
Monthly assumption reviews are most effective when they tie scenario parameters to EMS KPIs and economics. Teams review cost per employee trip, Trip Fill Ratio, OTP%, exception-closure times, EV utilization ratios, and no-show rates, and then adjust model assumptions about average occupancy, route density, and fleet mix. This monthly loop anchors scenario models to real VUI, utilization, and safety/compliance indicators rather than static planning baselines.
Quarterly policy-change simulations are most useful when they are run as cross-functional exercises involving HR, Finance, Security/EHS, ESG, and IT. These simulations test new shift policies, hybrid-work patterns, EV/ICE mix strategies, and women-safety routing rules against the canonical EMS and EV scenario models. A quarterly cadence lets organizations explore contract changes, outcome-based commercial levers, and EV transition steps without destabilizing daily operations, while keeping models synchronized with evolving labor, safety, and ESG expectations.
How can IT help standardize scenario parameters so Ops teams aren’t debating definitions like shift windows and attendance bands every month?
B0630 Standardize scenario parameter definitions — In India corporate Employee Mobility Services IT and Operations alignment, how can a CIO reduce the cognitive load on transport teams by standardizing scenario model parameters (shift windows, attendance bands, charging downtime) so planners aren’t arguing about definitions every month?
A CIO reduces cognitive load on transport teams by standardizing the core planning parameters in the mobility stack, encoding them once in systems and governance so planners operate within shared, pre-approved bands instead of debating definitions every month. Standardizing shift windows, attendance bands, and charging downtime as system-level constants turns recurring arguments into configuration, and configuration into governed master data.
First, the CIO aligns with HR, Transport, and Security to define canonical parameter sets. One set covers shift windows, including start and end buffers, escort rules for women’s night shifts, and maximum duty cycles as per labour and Motor Vehicles norms. A second set defines attendance bands for hybrid work, for example low, medium, and peak, mapped to specific seat-fill targets and fleet-mix rules in the routing engine. A third set covers EV charging downtime, including minimum state-of-charge thresholds, typical dwell times by site, and reserved fast-charging slots during off-peak hours.
The CIO then embeds these definitions in the routing and dispatch engine, NOC tools, and HRMS integration rather than in spreadsheets. Shift windowing, seat-fill thresholds, and EV downtime assumptions are stored as versioned master data objects. Transport planners choose from pre-defined scenarios, such as “Weekday Peak–Medium Attendance–Mixed Fleet,” instead of rebuilding logic. This reduces decision fatigue during roster finalization and ETS operation cycle reviews.
Finally, the CIO establishes change-control and observability around these parameters. Any adjustment to shift buffers, attendance bands, or charging assumptions passes through a lightweight approval workflow with timestamps and owners. Scenario outcomes, such as OTP%, Trip Fill Ratio, and EV Utilization Ratio, are reported against the active parameter set in a single-window dashboard. This allows IT and Operations to discuss outcomes and trade-offs using a common language, instead of re-litigating definitions at every SLA or QBR review.
People, rostering, safety, and OTP reliability
Model shift elasticity realistically, address driver shortages and fatigue, and minimize the OTP vs seat-fill trade-off with concrete on-ground steps for substitutions and roster adjustments.
At a high level, how do scenario models factor in shift changes and WFO/WFH swings to estimate fleet needs and SLA risk?
B0554 Modeling shift window elasticity — In India corporate Employee Mobility Services (EMS), at a high level how do scenario models incorporate shift window elasticity (late logins, staggered shifts, WFO/WFH swings) to predict fleet needs and SLA risk?
In India EMS, robust scenario models treat shift window elasticity as a forecastable input and then stress-test fleet, routing, and SLAs against that variability. The models convert WFO/WFH swings, late logins, and staggered shifts into distributions of demand by timeband, location, and policy, and then simulate how different fleet mixes and routing logics impact on-time performance and SLA breach risk.
Most mature EMS operators start by building a baseline demand surface from historical rosters, attendance, and trip logs. They stratify by shift window, site, day-of-week, and persona, and then overlay hybrid-work patterns such as WFO peaks, WFH dips, and known seasonality. Scenario models then perturb this baseline with defined stressors like late roster cut-offs, higher no-show rates, or additional staggered start times, and estimate the resulting changes in required fleet count, dead mileage, and buffer capacity.
A common pattern is to run multiple “what-if” simulations that vary seat-fill targets, duty cycles, and EV versus ICE mix, and then measure outcomes such as OTP%, Trip Adherence Rate, and Vehicle Utilization Index. The same scenarios also estimate financial exposure through cost per employee trip, idle capacity, and overtime or standby costs. Command-center teams use these outputs to set practical operating guardrails such as minimum buffer fleets per timeband, cut-off times for roster freezing, and escalation thresholds when real-time attendance diverges from forecast.
In practice, effective models are tightly integrated with HRMS data, telematics, and centralized NOC dashboards, so that predicted versus actual demand is continuously compared. This allows dynamic route recalibration and capacity reallocation when hybrid-work patterns deviate from plan, reducing SLA breach risk even when late logins or last-minute shift changes occur.
What inputs do we actually need to model shift flexibility—like no-shows and roster cut-off times—and which inputs are usually unreliable in real life?
B0560 Inputs for shift elasticity modeling — In India corporate employee transport (EMS), what specific inputs do scenario models typically require to estimate shift window elasticity—roster change cut-off times, no-show rates, traffic variance, or guard/escort availability—and which of these tend to be unreliable in real operations?
Scenario models for employee mobility in India typically need all four inputs—roster change cut‑off times, no‑show rates, traffic variance, and guard/escort availability—but traffic variance and escort availability are usually the least reliable in real operations. Roster cut‑offs and historic no‑show patterns are easier to codify and forecast, while traffic and escort constraints behave more like live risks that keep the control room in firefighting mode.
Roster change cut‑off times are usually defined in SOPs and EMS platforms. These inputs remain relatively stable. Scenario engines use them to simulate how late change requests or cancellations will impact routing, seat-fill, and fleet buffers.
No‑show rates are noisy but still modelable. Historical trip data from EMS or ETS operation cycles allows estimation by site, timeband, and day of week. Models can apply conservative buffers, but sudden policy changes or attendance drives can still cause deviation.
Traffic variance is structurally unreliable. Monsoon events, political strikes, or ad‑hoc roadblocks often override historical patterns. Even with dynamic route optimization and real-time trend analysis, on-ground variance forces last-minute recalibration and can break model assumptions around on-time performance.
Guard/escort availability for women’s night shifts is also unreliable in practice. Escort pools are thin, fatigue and duty‑cycle rules reduce flexibility, and any absence or late reporting can invalidate a planned route. Scenario models that assume fixed escort supply often fail during peak or disruption windows, which is why transport heads rely on manual overrides and escalation matrices to stay compliant.
When HR wants better experience and Ops wants better seat-fill, how can a scenario model make the trade-offs clear so it doesn’t turn into blame later?
B0566 Making seat-fill vs OTP tradeoffs — In India corporate Employee Mobility Services (EMS), when HR and Operations disagree on whether to prioritize seat-fill optimization or on-time performance, how can scenario models make the trade-off explicit so the decision doesn’t become a blame game after escalations?
In Indian corporate Employee Mobility Services, scenario models reduce blame by turning the “seat-fill vs on-time performance” argument into explicit, quantified choices before operations go live. Scenario models show HR and Operations what happens to OTP, cost per trip, and employee experience when seat-fill targets, buffer times, and fleet mix are changed, so trade-offs are agreed upfront and documented as policy rather than debated after escalations.
A practical scenario model uses actual roster, route and traffic data over representative weeks. It then simulates multiple configurations such as high seat-fill with tight buffers, moderate seat-fill with some dead mileage, and low seat-fill with strong OTP buffers. For each configuration, the model outputs expected OTP%, Trip Fill Ratio, dead mileage, Cost per Employee Trip, and No-Show Rate, along with risk bands for night-shift safety and women-first routing constraints.
A common failure mode is optimizing for procurement targets like cost per km without modeling hybrid-work volatility, which drives under-capacity on peak days and OTP collapse. Another failure mode is HR insisting on near-100% OTP with aggressive buffers, without seeing the impact on extra vehicles, dead mileage and long-term CET. Scenario models make both failure modes visible by exposing sensitivity: for example, what 5 percentage points of additional OTP will cost in CET and how much carbon or dead mileage it adds.
To keep decisions from becoming personal, organizations can anchor on a small set of jointly owned KPIs. These typically include OTP% and incident rate for HR, CET and Trip Fill Ratio for Finance and Procurement, and Vehicle Utilization Index and dead mileage caps for Operations. The scenario model then becomes the shared “calculator” that shows how different policy levers, such as escort rules, shift windowing, or EV vs ICE mix, move those KPIs together.
Useful design elements for such models include clear assumptions about shift windows and routing constraints, explicit buffers for traffic and monsoon disruption, separate treatment of critical night-shift and women-only routes, and pre-agreed thresholds where escalation or contingency plays must trigger. When these elements are visible to HR, Transport, Finance and Security in one dashboard, governance shifts from “who is at fault” to “we chose Scenario B knowing the risks, and we now need to move to Scenario C based on new data”.
How can HR tell if scenario modeling will actually reduce safety and reputation risk—especially for women’s night shifts—instead of just creating more reports?
B0575 Scenario modeling impact on safety risk — For India corporate EMS, how should HR evaluate whether scenario modeling will actually reduce incident-driven reputational risk (especially women’s night-shift safety) versus just producing more reports with no operational change?
Scenario modeling reduces incident-driven reputational risk only when it changes routing, escort rules, and command-center behavior in real time. It fails when it stays in PowerPoint and is disconnected from EMS routing engines, NOC workflows, women-safety SOPs, and audit trails.
HR should first check whether scenario modeling is wired into live EMS operations rather than existing as a separate analytics deck. Effective models feed the routing engine, influence shift windowing, and adjust escort compliance and geo-fencing rules for women’s night shifts. Weak models only generate “heatmaps” or risk scores with no binding impact on vendor SLAs, transport desk decisions, or driver app instructions.
HR can use four practical tests to separate impact from noise.
1) Control linkage: Do modeled scenarios automatically alter routes, pickup windows, vehicle/escort allocation, or approval flows for high-risk timebands and geographies.
2) Command-center actionability: Does the NOC get scenario-based alerts, playbooks, and escalation matrices that are actually used during night operations.
3) SOP & SLA integration: Are women-safety rules, DFI limits, and incident-response SOPs explicitly tied to scenario outputs in contracts, SLAs, and vendor governance.
4) Evidence & outcomes: Can the provider show a baseline and then reductions in incident rate, OTP variance on night shifts, and audit trail completeness after scenario modeling was introduced.
A common failure mode is “report inflation” where geo-AI and analytics are added on top of fragmented supply and manual routing. This increases dashboards but leaves driver fatigue, escort deployment, and business continuity playbooks unchanged. HR should insist that any scenario modeling proposal comes with concrete change items in routing policies, command-center micro-functioning, training for routers and supervisors, and BCP drills for political strikes, tech failures, and severe weather.
If scenario modeling cannot be traced to fewer night-shift escalations, faster incident closure SLAs, stronger chain‑of‑custody for trip data, and clearer HSSE accountability, it will not materially reduce reputational risk. It will simply produce more reports that HR still has to defend after the next incident.
What proof should our transport ops team ask for when a model says shift flexibility will cut fleet size but still keep pickups on time?
B0584 Proving shift window elasticity — For India shift-based employee transport operations, what inputs and evidence should an Operations/Transport Head require in a scenario model that claims “shift window elasticity” will reduce fleet count without increasing missed pickups during peak windows?
For Indian shift-based employee transport, an Operations/Transport Head should demand a scenario model that proves fleet reduction and “shift window elasticity” against real roster, traffic, and SLA evidence, not generic optimization claims. The model must show that reduced fleet still meets on-time performance, safety, and compliance thresholds in the worst peak windows, with clear buffers and contingency playbooks.
First, the scenario must run on actual demand patterns. It should ingest real HRMS-linked roster data by site, shift, and day-of-week. It must incorporate geo-clustered pickup locations, historical OTP and Trip Adherence Rates across different timebands, and known peak-traffic corridors and monsoon or event disruptions. The routing logic needs to reflect actual shift windowing rules, seat-fill targets, dead-mile caps, and escort or women-first routing constraints, not just distance minimization.
Second, the model needs explicit operational guardrails. It should define maximum route duration, hard cutoff times for last pickup per route, minimum buffer vehicles per timeband, and a Driver Fatigue Index threshold. It must encode compliance rules such as night-shift safety, duty hours, and escort policies, and show that every proposed route and re-sequencing remains within those constraints. EV-specific scenarios must include battery state-of-charge, charger locations, and turnaround times if EVs are part of the fleet.
Third, the Operations/Transport Head should require clear, auditable outputs. The model must provide route-level Gantt views, per-window fleet requirements, and projected OTP% with confidence bands under normal and stressed conditions. It should present exception and escalation flows for late logins, no-shows, GPS downtime, and vehicle breakdowns, including how the centralized command center will intervene. A side-by-side comparison of before/after fleet size, dead mileage, Trip Fill Ratio, and exception closure times is essential to judge whether the complexity added by shift elasticity actually reduces daily firefighting instead of increasing it.
To have operational credibility, the scenario should be validated via pilot runs in at least one high-stress corridor or worst-case shift window, with a pre-agreed success benchmark on OTP, missed pickups, and escalation volume. If the model cannot show stable operations in the toughest window, its claimed fleet reduction should be rejected or scaled back until it aligns with real-world reliability and safety expectations.
How can HR use simple what-if models to link OTP drops during spikes to attendance issues and escalations, without building a big analytics setup?
B0586 HR linking OTP to attendance — In India Employee Mobility Services (EMS) with hybrid work patterns, how can an HR head use scenario models to quantify how OTP deterioration under demand spikes translates into attendance volatility and manager escalations, without needing a full data science team?
In hybrid-work Employee Mobility Services, an HR head can quantify the impact of OTP deterioration by building a few simple, spreadsheet-based “what-if” models that link OTP% to late-login rates, attendance volatility, and manager escalations using operational data HR already controls. These models work best when they combine three inputs: basic historical OTP and no-show data from the transport command center, timesheet and attendance logs from HRMS, and a simple assumption set about how often late cabs convert into late logins and complaints.
A practical approach is to define a small baseline period where OTP, late-logins, and escalation counts are relatively stable, then compare it to stress periods such as monsoon weeks, roster changes, or known demand spikes. HR can approximate elasticities such as “every 5 percentage point drop in OTP increases late logins by X% and manager complaints by Y%” by plotting these two periods side by side. This mirrors how WTicabs evidences monsoon routing resilience and 98% on‑time arrival in its case studies, or uses a unified dashboard to correlate OTP, incident alerts, and customer satisfaction.
Trade-offs arise between model simplicity and precision. A simple scenario grid that defines three OTP bands (for example, ≥97%, 93–96%, <93%) and estimates corresponding ranges for late logins, unplanned WFH switches, and escalations will be less exact than a full analytics stack but much faster to socialize with leadership. HR can then extend the model to hybrid-specific patterns by segmenting by shift window, team, or day-of-week, using the same logic command centers apply for traffic trend analysis, business continuity playbooks, and on-time service delivery targets. This keeps HR in control of the narrative with quantifiable, scenario-based forecasts even without a dedicated data science team.
How do we build demand volatility scenarios that reflect late roster changes and policy bypasses, not just the ideal process?
B0595 Modeling real-world roster behavior — In India shift-based employee transport, what are practical ways to calibrate demand volatility scenarios when HR rosters change late and managers bypass policy—so the model reflects real behavior rather than ideal workflow?
In India shift-based employee transport, demand volatility is best calibrated by basing the model on how rosters and managers actually behave, not how policies say they should behave. Operations teams need to mine historical trip and roster data for patterns of late changes and policy bypass, then encode those patterns as explicit buffers, rules, and scenarios in the routing and capacity plan.
A common pattern is repeated last‑minute roster edits by HR and team managers. Transport and command center teams can quantify this by shift, day-of-week, and business unit using ETS trip logs, no‑show reports, and HRMS–transport integration data. Demand planning then uses a “locked” baseline roster plus a variable layer for expected late additions and cancellations instead of assuming the published roster is final.
Another pattern is informal manager behavior that overrides seat‑fill and pooling rules. Most organizations see this in higher solo rides, adhoc CRD use, or route deviations. Teams can tag and review these exceptions through trip adherence audits, ticketing logs, and finance data, and then treat them as a forecastable “manager‑driven variance” rather than noise.
Practical levers that make the model reflect real behavior include:
- Defining shift‑wise reserve capacity and standby vehicles based on observed late‑change rates.
- Running “what‑if” scenarios for peak days, monsoon, political events, and exam or launch cycles using historical ETS Operation Cycle and Command Center data.
- Building outcome‑linked commercials where some capacity is fixed and some is variable, indexed to OTP%, no‑show rate, and seat‑fill, so Finance and Procurement see controlled volatility rather than unexplained cost spikes.
- Using centralized command center observability to continually compare planned vs actual and updating buffers and routing rules every month, so the plan reflects living behavior, not a one‑time policy.
When HR wants bigger buffers for safety and Finance pushes utilization, how can we use scenarios to show the cost vs risk trade-off in simple terms and align?
B0607 HR–Finance buffer trade-offs — In India corporate employee transport, how can HR and Finance resolve conflict when HR wants aggressive service buffers for safety and Finance wants high utilization—using scenario models to show the cost and risk trade-off in plain terms?
In India corporate employee transport, HR and Finance resolve this conflict fastest when they jointly model a few concrete “service level vs cost” scenarios and then lock a policy that caps risk and cost together. Scenario models help because they translate abstract arguments about safety buffers and utilization into visible trade-offs on OTP, incident exposure, and cost per trip that both sides can defend in audits and to leadership.
A practical starting point is to define 2–3 explicit operating scenarios on one route set. One scenario can assume lean buffers with high Trip Fill Ratio and minimal standby vehicles. Another can assume HR’s preferred buffers with extra cabs, lower dead mileage caps, and stricter Female-First routing for night shifts. A middle “steady state” scenario can sit between them. For each scenario, transport and the command center can estimate On-Time Performance, driver duty hours, standby fleet size, Cost per Employee Trip, and potential breach of women-safety or HSSE norms.
These scenarios become decision tools when they are quantified in a simple table and linked to real failure modes. HR can show how very high utilization and low buffer shrink OTP%, increase fatigue risk, and weaken audit readiness on night-shift routes. Finance can show how very loose buffers drive avoidable fleet cost, idle time, and CET inflation. A scenario that ties payouts to OTP, safety incidents, and seat-fill, and that uses agreed caps on dead mileage and buffer fleet, usually emerges as the compromise.
Most organizations find it effective to pilot the chosen scenario on a few major shifts for 4–6 weeks. They can then review real KPIs such as OTP%, incident rate, CET, and complaints with HR, Finance, Transport, and Security in one room. If the pilot shows that small increases in standby or seat-fill thresholds materially change costs with little safety benefit, the buffers can be tightened. If safety escalations appear as buffers are cut, the added cost can be presented as a clearly priced risk-mitigation measure instead of an argument.
Over time, these scenario models can be folded into procurement and contracts. Outcome-linked commercials can align both sides by indexing vendor payouts to a band of acceptable OTP%, safety performance, and utilization. This reduces recurring conflict because HR’s safety floor and Finance’s utilization ceiling are encoded in the same, auditable SLA bands rather than argued case by case.
Using scenarios, how do we decide which EMS routes should avoid EVs—like long night-shift routes or low-charger areas—so OTP stays stable?
B0610 Where EVs should not run — For India corporate EV/ICE fleet mix planning in Employee Mobility Services (EMS), how can an operations planner use scenario models to decide where EVs should not be deployed (night-shift long routes, low charger density) to protect OTP and reduce firefighting?
For Employee Mobility Services in India, operations planners should use scenario models to actively mark specific shifts, routes, and depots as “EV‑restricted” whenever range risk, charging gaps, or turnaround times threaten on‑time performance. Scenario modelling works best when it compares EV vs ICE performance at the level of route archetypes, not at the level of individual vehicles.
Scenario models are most useful when they start from actual shift windows, dead mileage, and charger locations. Planners can cluster routes into patterns such as short urban loops near chargers, long night‑shift corridors with sparse infrastructure, and high‑mileage airport or plant connectors. For each pattern, the model should estimate required range including buffer, charging opportunities within the duty cycle, and likely congestion or weather delays. Routes that repeatedly breach buffer thresholds or cannot accommodate a predictable charging slot should be tagged as “ICE‑mandatory” to prevent silent range anxiety from turning into last‑minute vehicle swaps.
A common failure mode is treating EV allocation as a generic percentage target instead of a shift‑wise, route‑wise decision. This usually pushes EVs onto long night routes or low‑charger zones and creates 2 a.m. firefighting when vehicles need unplanned top‑ups or are held up at limited chargers. Scenario models reduce this by encoding explicit guardrails such as minimum EV state‑of‑charge at shift start, maximum distance from reliable charging, and mandatory ICE coverage for critical night corridors.
In practice, operations planners should maintain a simple playbook that links each route category to an allowed fleet mix and to the command center’s escalation rules. This keeps OTP protection, charger density, EV uptime, and driver duty cycles visible in one governed model instead of relying on ad‑hoc dispatch decisions during peak shifts.
Before we rely on a what-if model for shift changes and fleet sizing, what data do we need to collect first—rosters, no-shows, seat-fill, dead miles, etc.?
B0613 Inputs needed for elasticity modeling — In India corporate Employee Mobility Services, what practical inputs (attendance forecast, seat-fill targets, dead-mile caps, no-show rates, shift rosters) must a transport operations head gather before trusting a what-if model for shift window elasticity and fleet sizing?
In India corporate employee mobility, a transport operations head should only trust a what‑if model for shift-window elasticity and fleet sizing after feeding it granular, operations-grade inputs on demand patterns, fill efficiency, and operational constraints. The model becomes reliable when its inputs mirror how attendance, routing, and vendor performance behave on real shifts, not in averages.
Key practical inputs that operations leaders usually need to assemble and validate are:
-
Attendance forecasts linked to shift windows
Operations teams need forecasted headcount per location, per shift window, and per day of week.
They also need separate patterns for peak days, seasonal spikes, and special events.
Forecasts should distinguish WFO, hybrid, and WFH so that only eligible commuters are counted.
Historical variance between planned and actual attendance is essential to set realistic confidence bands. -
Shift rosters and policy rules
The what-if model needs exact shift timings, sign-in SLAs, and buffer times for pickups and drops.
Roster data must include gender mix, night-shift eligibility and escort rules for women.
Operations must map site-wise reporting patterns, such as staggered start times within the same band.
Any contractual routing rules, such as maximum ride duration, must be encoded as hard constraints. -
Seat-fill targets and routing assumptions
The operations head must define target Trip Fill Ratios for different vehicle types and timebands.
Historical seat-fill data by route, shift, and day informs realistic targets for pooling.
Constraints like maximum allowed detours or maximum stops per trip must be specified for the model.
The model also needs site-level caps on pooled routing for high-sensitivity functions or VIP roles. -
Dead-mile caps and geography constraints
The model must ingest current average dead mileage by depot, cluster, and vendor.
Operations leaders should define acceptable dead-mile caps per vehicle type and shift band.
Geo-clusters, blacklisted areas, and one-way traffic constraints must be explicitly mapped.
Any rules for garage locations, parking availability, and inter-site rebalancing windows need to be specified. -
No-show and cancellation behaviour
No-show rates should be captured at a granular level by shift, day of week, and route or cluster.
The model should differentiate between early cancellations, last-minute cancellations, and hard no-shows.
Operations must provide historical rebooking patterns to estimate realistic standby and buffer needs.
The what-if engine should be calibrated with actual exception closure times for no-show handling. -
Fleet mix, vendor capacity, and uptime reality
Available fleet by type, fuel (ICE or EV), and vendor must be listed with site-wise tagging.
Historical fleet uptime, by vendor and vehicle category, is required to avoid overestimating real capacity.
Duty cycles, maximum shifts per vehicle per day, and mandatory maintenance windows must be encoded.
For EVs, practical range under city conditions and charging slot availability per location must be provided. -
Service-level and safety constraints
The operations head must input required OTP thresholds per shift window and location.
Women-safety requirements, including escort rules and routing restrictions after certain hours, must be modeled.
Maximum allowed trip duration, plus incident response SLAs, should appear as non-negotiable guardrails.
Any client-specific compliance constraints, such as maximum occupancy per category, must also be included.
Once these inputs are assembled, the transport operations head can test the what-if model by comparing its outputs against actual historical days with known constraints. The model earns trust when it reproduces past behaviour within acceptable error margins and surfaces trade-offs clearly between OTP, seat-fill, dead mileage, and standby buffers.
How do we model the impact of late pickups on attendance and attrition in a way Finance will accept, not dismiss as ‘soft’?
B0614 Model HR impact Finance accepts — In India corporate Employee Mobility Services, how can HR and facilities use scenario models to quantify the human impact of late pickups (late logins, manager escalations, attrition risk) without getting into an argument with Finance about ‘soft’ metrics?
In India corporate employee mobility, HR and Facilities can quantify the human impact of late pickups by building very simple, incident-linked scenario models that convert “soft” effects into operational numbers that Finance already tracks, such as late logins, exception handling workload, and attrition-linked replacement cost. The critical move is to tie every commute failure to an observable, auditable outcome in attendance, productivity, and complaints, and then express those outcomes as ranges, not precise forecasts.
HR and Facilities can start by defining a few hard, observable variables. These variables include number of late pickups per 1,000 trips, average delay in minutes, count of manager escalations per week, number of missed or late logins, and complaint tickets raised from transport issues. HR can link trip-level logs from the transport platform with attendance and HRMS data. This link allows a clear mapping from “late cab” to “late login” and “manager complaint”.
A scenario model works best when it uses current baselines and only changes one driver, such as on-time performance (OTP%). HR and Facilities can build two or three OTP scenarios, such as 92%, 96%, and 98%. For each scenario, they can estimate how many late logins and escalations occur and how much supervisor time is consumed in handling those escalations. They can express this in hours of manager time per month and relate it to productivity loss or overtime.
Attrition risk can be treated as a risk band rather than a single estimate. HR can use survey data or complaint frequency to show that sustained poor commute reliability correlates with higher resignation intent scores. They can then present a conservative and an aggressive attrition impact band over 12 months. This approach avoids over-claiming and keeps the conversation framed as “risk to be managed.”
To avoid arguments about “soft” metrics, HR and Facilities should anchor all assumptions in auditable logs and transparent formulas. They can show Finance the linkage logic, such as which fields are pulled from HRMS and which from the transport command center. They can also keep the model deliberately simple enough that Finance can change input values. This shifts the discussion from “Do you believe these soft numbers?” to “Which assumption range do we agree is reasonable?”
A practical operating pattern is to use these models as a before/after comparison for any change in EMS design. HR and Facilities can propose that OTP improvement targets be part of outcome-linked procurement. They can track late logins and complaint volume for a fixed period and compare them with the scenario bands. This provides evidence that commute reliability is a controllable lever on operational noise and perceived attrition risk, not an abstract well-being topic.
images:
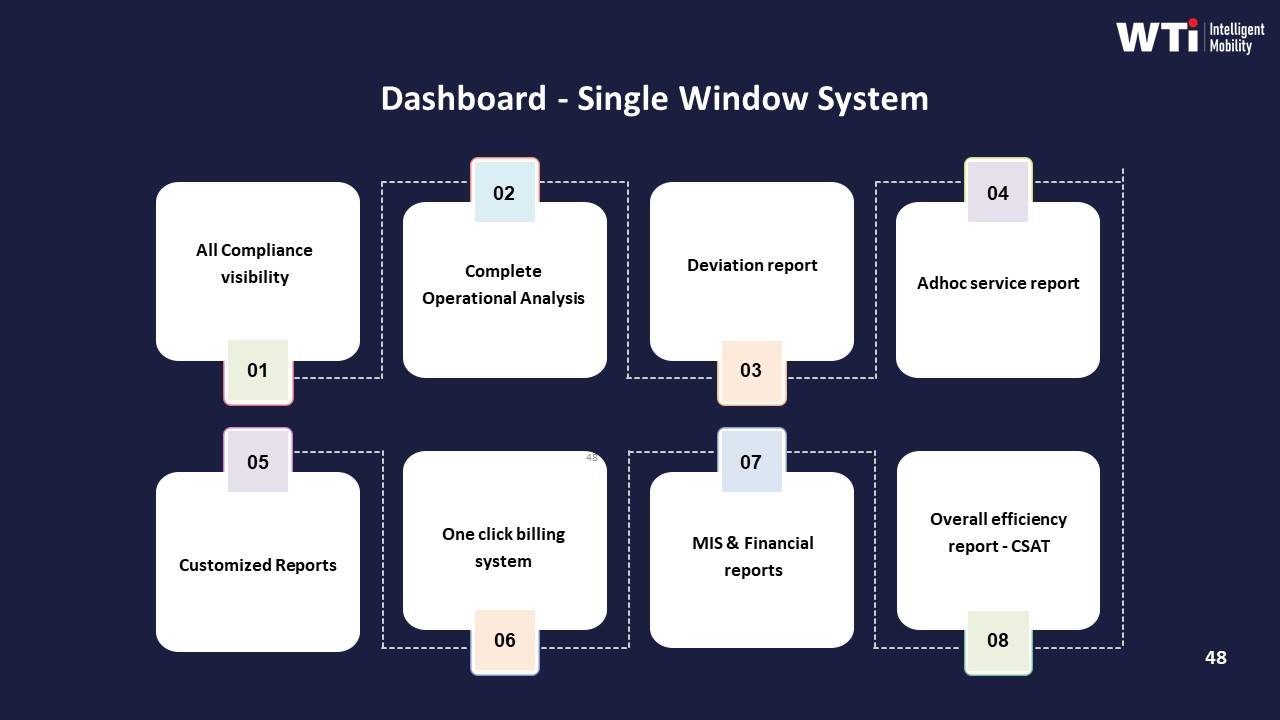
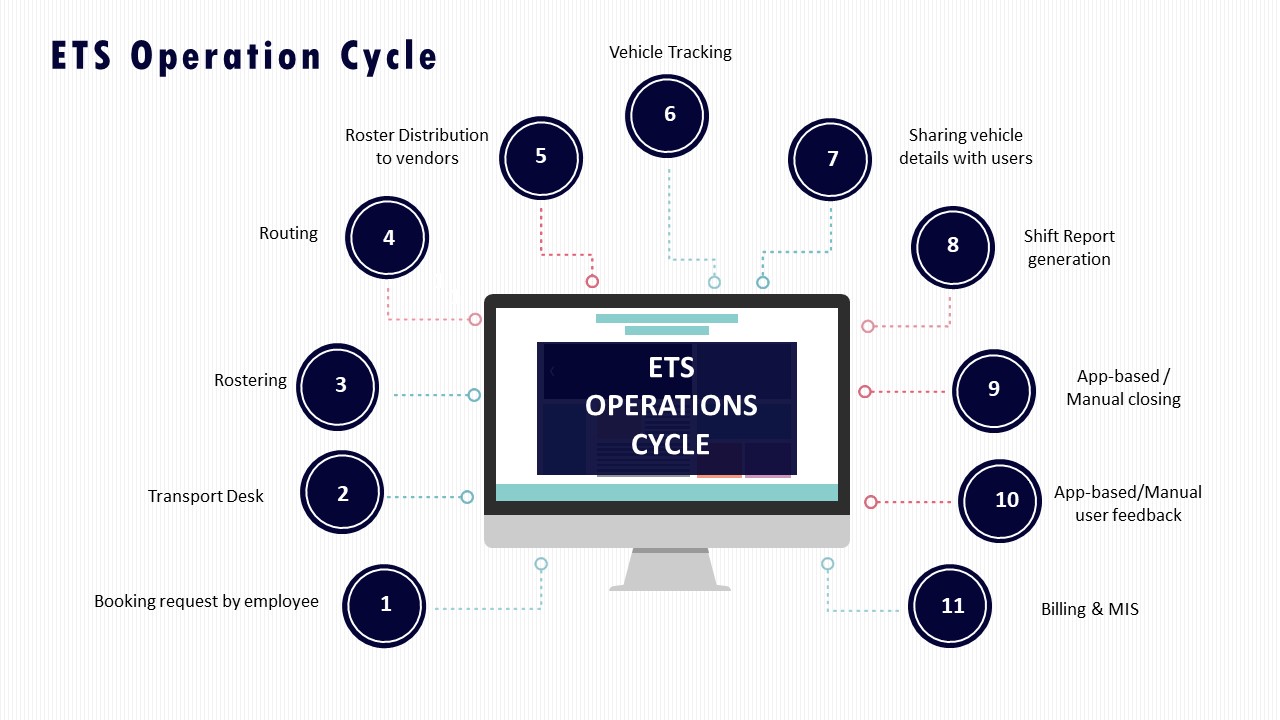
In a hybrid setup, how do we figure out if shift window flexibility is what’s driving our cost overruns, or if it’s actually dead miles, vendor gaps, or bad rostering?
B0620 Diagnose elasticity vs other causes — In India corporate Employee Mobility Services with hybrid-work volatility, what is a practical ‘how-to’ method to measure whether shift window elasticity is the real driver of cost overruns versus dead mileage, vendor non-compliance, or poor rostering discipline?
A practical way to see if shift-window elasticity is the real cost driver is to rebuild costs at trip level and then re-aggregate by cause using a simple, stable attribution model. Organizations should segment a 4–8 week sample of EMS operations into four tagged buckets per trip or route: “elasticity-driven,” “dead mileage,” “vendor non-compliance,” and “rostering/discipline,” and then compare cost per employee trip and unit economics across these buckets.
The starting point is clean trip and roster data. Transport teams should export HRMS-based shift windows, final rosters, planned vs actual routes, vehicle logs, and vendor invoices for the same period. Command-center or dashboard tools described in the context, such as centralized transport command centres and data-driven insights platforms, are useful because they already consolidate GPS, routing, and billing data under one view.
Elasticity impact is isolated by tagging trips where start/end times deviated from policy shift windows or where ad‑hoc bookings outside standard bands forced low seat-fill or extra cabs. Dead mileage is quantified from GPS and duty-sheets as non-revenue kilometers between garage, first pickup, last drop, and garage, then expressed as a share of total kilometers and cost. Vendor non-compliance is captured where SLA breaches, no-shows, or last-minute vehicle substitutions forced extra trips or premium charges. Poor rostering discipline is identified where headcount volatility within the same shift window produced underfilled cabs or excessive route fragments despite stable policy.
Once each trip or route carries one primary cause tag, finance and transport teams can compute cost per kilometer, cost per employee trip, trip fill ratio, and on-time performance per bucket. If elasticity-tagged trips show normal seat-fill, normal dead mileage, and no unusual SLA penalties, while overruns concentrate in dead-mileage or non-compliance buckets, then shift-window volatility is not the dominant driver. If, instead, elasticity-tagged trips consistently show low trip fill ratios and higher cost per employee trip, with normal vendor compliance and dead mileage, then hybrid shift elasticity is the real source of overruns, and policy or windowing needs redesign rather than vendor change.
images:
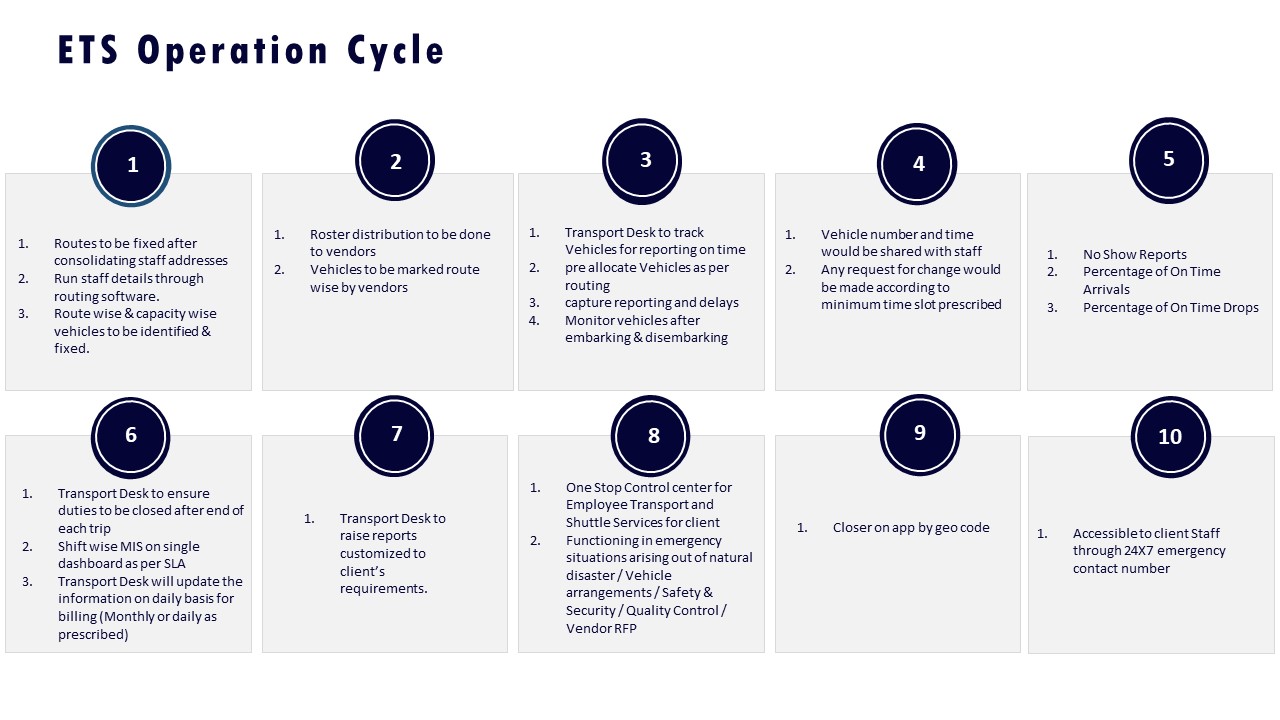
What do we ask to make sure the model accounts for driver shortages and absenteeism, especially on night shifts and peak hours?
B0624 Model realism on driver supply — In India corporate Employee Mobility Services, what should a facilities head ask to verify that a scenario model handles driver shortages and absenteeism realistically, rather than assuming perfect supply during night shifts and peak windows?
A facilities head should directly test whether the scenario model builds in real-world supply risk by asking for explicit driver-availability assumptions, fatigue rules, and contingency buffers for night shifts and peaks. A realistic model treats driver shortages, absenteeism, and fatigue as input constraints with SLAs and buffers, not as rare exceptions or “infinite supply.”
They should start by asking how the model represents driver capacity across timebands. The question should demand separate driver-availability curves for day, evening, and night shifts, and for weekdays vs weekends or festival days. The facilities head should ask what absenteeism rate, no-show rate, and attrition rate the model assumes, and how those assumptions change during peak windows or adverse weather. Any model that cannot show these parameters is probably assuming perfect supply.
They should then probe how fatigue and rest rules are enforced. A realistic Employee Mobility Services model encodes duty cycles, rest periods, and shift-windowing as hard constraints in the routing and dispatch logic. The facilities head should ask how many back-to-back night shifts or duty hours a driver can perform before the model blocks additional allocation. They should also ask what happens in the model when a driver hits those limits during a busy night.
The facilities head should validate that contingency and Business Continuity Planning are built into the scenario logic. They should ask what explicit buffer capacity is assumed per shift, what standby fleet or standby drivers are modeled for night shifts, and how many rides can still be served if a fixed percentage of drivers drop out at short notice. They should also ask for scenario runs that simulate strikes, tech failures, or severe weather, and then check how OTP and Trip Adherence Rate behave under those shocks.
Finally, they should insist on operational evidence instead of just projections. They should ask for historical OTP%, Vehicle Utilization Index, and driver shortage incidents during past peaks, and then compare those numbers to the model outputs. Any gap between real data and scenario results is a sign that the model is smoothing over driver shortages instead of handling them realistically.
HR wants buffer capacity for safety, Finance says it’s waste—how do we set scenario assumptions that both sides will accept?
B0628 Resolve buffer capacity conflict — In India corporate Employee Mobility Services, how should Procurement handle the politics when HR wants more capacity buffer for safety and experience, but Finance’s scenario model penalizes buffers as ‘waste’—what’s a fair way to set assumptions both sides can live with?
In Indian corporate employee mobility, Procurement can de‑politicize the “capacity buffer vs waste” debate by turning it into an explicit, data-backed trade‑off between reliability risk and unit cost, with shared assumptions that are signed off by HR and Finance together. Procurement’s role is to frame buffers as an insurance cost against OTP and safety failures, then bound that insurance with clear limits, KPIs, and review cadences.
Procurement should first separate what is non‑negotiable from what is variable. Night‑shift safety rules, escort policies, and minimum coverage for women employees should be defined with HR, Security/EHS, and Transport as mandatory baselines. Only the excess standby capacity above these baselines should be treated as “buffer” for commercial discussion with Finance.
A fair assumption set usually anchors on operational KPIs rather than abstract vehicle counts. Buffers should be tied to target OTP%, no‑show rates, and peak‑hour variability in specific cities and shift windows. Historical trip data from the command center, routing engine outputs, and vendor SLAs can quantify how OTP and incident risk change when standby drops below a certain percentage.
To keep Finance comfortable, Procurement can cap buffer exposure through outcome‑linked commercials. Examples include paying a premium only for activated standby during disruptions, setting different buffer norms for stable vs volatile sites, and reviewing buffer levels quarterly based on actual exception rates. This converts “fixed waste” into “conditional insurance,” with CFO‑visible logic on when extra capacity pays for itself through avoided productivity loss and safety escalations.
To avoid recurring politics, Procurement should document these rules in the RFP and contract: define city/shift‑specific buffer bands, attach them to OTP and safety SLAs, and agree a joint HR–Finance sign‑off for any mid‑term change. That turns one‑off arguments into a governed playbook both sides can live with.
Site launches, policy changes, and vendor transitions
Plan ramp-ups, policy changes, and vendor cutovers with scenario modeling, including fallback routes, temporary routing, and clear handover playbooks to avoid chaotic transitions.
When we launch a new site, how do we build a what-if model that reflects ramp-up chaos and supervision needs instead of assuming day-one steady state?
B0557 Site launch ramp-up modeling — In India corporate ground transportation (EMS/ECS), how should an operations lead structure a what-if model for a new site launch so it realistically captures ramp-up uncertainty, temporary routing, and on-ground supervision needs rather than assuming steady-state operations from day one?
An operations lead should build a what‑if model for a new EMS/ECS site launch that explicitly separates the volatile ramp‑up phase from the later steady state and treats routing, fleet, and supervision as scenario variables, not fixed inputs from day one. The model should quantify buffers, learning curves, and temporary controls for the first 8–12 weeks and only converge to “business‑as‑usual” assumptions after defined stability signals are met.
In practice, the model works best as a time‑phased structure. The first phase covers discovery, pre‑transition, and pilot weeks that mirror an indicative transition or project planner. This phase should assume incomplete rosters, shifting shift‑window patterns, and conservative seat‑fill, with higher dead mileage and lower Vehicle Utilization Index built into the baseline. A second phase models controlled scale‑up, where dynamic route recalibration, temporary route design, and peak‑load handling for ECS become line items rather than noise.
A robust what‑if model for a new site launch must also price and quantify on‑ground supervision explicitly. Dedicated project or event control desks, temporary local command‑center presence, and daily shift‑wise briefings should be modeled as capacity and cost drivers that reduce SLA breach rate, incident risk, and exception closure time during ramp‑up. Central 24×7 command‑center operations, alert supervision systems, geo‑fencing, and SOS workflows can then be layered as levers that shift the model from reactive incident handling to predictive exception management.
To keep the model realistic, the operations lead should define scenario switches and guardrails rather than a single forecast. These switches include different attendance curves under hybrid work, alternative fleet mix policies (ICE/EV/shuttle), varying levels of charging infrastructure readiness for EVs, and different vendor aggregation patterns. Each scenario should produce distinct outputs on OTP%, Trip Adherence Rate, Trip Fill Ratio, dead mileage, and cost per employee trip so that ramp‑up uncertainty is visible in the economics instead of being averaged away.
On‑ground supervision needs should be connected in the model to safety and compliance assumptions. Early‑phase parameters must reflect higher risk of driver unfamiliarity, incomplete driver KYC/PSV cycles, and untested women‑safety routing and escort rules. The what‑if logic should therefore include higher inspection frequency, more frequent route adherence audits, and stricter escalation matrices in the initial weeks, with explicit assumptions about how quickly these controls can be relaxed as audit trail integrity and incident‑free days accumulate.
A practical way to keep this model operationally useful is to anchor it to the organization’s existing ETS/EMS operation cycles and macro/micro transition plans. Discovery, rostering, vendor distribution, vehicle tracking, and shift‑report closure steps can be mapped into time‑boxed milestones, with each milestone unlocking a change in assumptions on fleet uptime, exception latency, and need for local versus centralized control. This keeps the what‑if model aligned with real SOPs instead of becoming a theoretical spreadsheet.
Finally, the model should encode resilience rather than optimism. Political strikes, monsoon disruption, technology failures, and cab shortages are already covered in business continuity plans and mitigation playbooks. The what‑if design should parameterize these as stress tests on the new site, showing how much buffer capacity, multi‑vendor depth, and contingency routing are required in ramp‑up to maintain target OTP% and safety posture, rather than retrofitting them after the first major incident.
How can we model upcoming transport policy changes—like escort rules or geo-fencing—so we know the ops and budget impact before we roll them out?
B0558 Modeling transport policy changes — In India corporate Employee Mobility Services (EMS), what’s a practical way to model “policy changes” (e.g., women’s night-shift escort rules, pickup radius constraints, or mandatory geo-fencing) so HR and EHS can predict operational drag and budget impact before rollout?
A practical way to model EMS policy changes in India is to treat each policy as a set of explicit, machine-readable constraints in the routing and capacity engine and then run “before/after” simulations on historical trip data to estimate OTP, fleet, and cost impact. The same constraint set can also drive compliance audits and women-safety controls in live operations.
Most organizations get stuck when policies remain in narrative form. HR and EHS teams issue rules on women’s night-shift escorts, pickup radius, or geo-fencing, but transport and vendors manually “interpret” them shift by shift. A constraint-based model converts each rule into objects that the routing engine understands, such as minimum escort rules by time-band, maximum walking distance, and mandatory safe-route corridors with geo-fence boundaries.
Once constraints are encoded, operations teams can replay several weeks of historical rosters and GPS traces through the routing engine. They can then compare key EMS KPIs such as fleet size, dead mileage, seat-fill, OTP%, and cost per employee trip under multiple policy variants. This approach exposes where a stricter escort window, tighter pickup radius, or new geo-fence will increase vehicles, extend trip times, or stress driver duty cycles before HR formally rolls out the change.
For HR and EHS, the same model provides a way to attach audit-ready evidence to each policy decision. HR can show leadership a quantified trade-off between improved women-safety compliance and incremental budget, and EHS can verify that escort compliance, night routing, and geo-fences are enforced consistently instead of being dependent on individual drivers or dispatchers.
How do we model the real cutover pain in a vendor transition—driver onboarding, KYC, training, and NOC handover—so leadership doesn’t underestimate the risk?
B0564 Modeling vendor transition cutover risk — In India corporate EMS operations, how can a transport head use scenario models to quantify the operational drag of vendor transitions—driver onboarding time, KYC/PSV cadence, app retraining, and NOC handover—so leadership doesn’t underestimate the cutover risk?
In corporate EMS in India, a transport head can use simple, scenario-based “what-if” models that convert each transition activity into delay minutes, OTP impact, and temporary capacity loss so leadership sees vendor change as an operational risk with measurable drag, not just a commercial decision. The most effective models break the cutover into discrete phases such as driver onboarding, KYC/PSV renewal, app retraining, and NOC / command-center handover, then quantify each as a temporary hit on fleet uptime, OTP%, and escalation volume.
A practical approach is to start from the existing ETS Operation Cycle and Command Center Operations structure. Each handoff point in that cycle can be tagged with a transition risk factor. Driver onboarding delays can be modeled by combining average DASP throughput, background-check timelines from the Driver Compliance collateral, and historic driver attrition during changeovers. KYC/PSV cadence and fleet compliance can be modeled using the Centralized Compliance Management and Fleet Compliance frameworks, translating document latency into the percentage of vehicles temporarily unavailable for night shifts or women-first routes.
App retraining drag can be estimated using data from Employee App, Driver App, and Admin/Dispatcher tool usage. The model should separate early adoption curves for employees, drivers, and transport desk teams and convert “training lag” into missed check-ins, higher no-show rate, and manual overrides per shift. NOC and TCC handover can be modeled using Command Center and Transport Command Centre material, by simulating reduced alert coverage and slower response while SOPs, escalation matrices, and Alert Supervision System thresholds are recalibrated.
To make leadership pay attention, the transport head can present two or three concrete scenarios instead of a single estimate. For example:
- Best case: 5–10% temporary fleet unavailability, minimal OTP impact because driver and fleet compliance pipelines are pre-filled before cutover.
- Realistic case: 10–15% capacity drag, 2–4 weeks of elevated incidents and routing exceptions while NOC tooling and apps stabilize.
- Risk case: 20%+ drag if KYC/PSV and onboarding bottlenecks collide with peak ramps or monsoon conditions, referencing case studies like the Mumbai monsoon routing example.
The same model should explicitly link these scenarios to on-time performance, escalation volume, and business continuity risk using the Business Continuity Plan and Management of On Time Service Delivery collaterals. Leadership typically underestimates cutover risk when they only see rate cards and SLAs. Scenario models grounded in existing compliance SOPs, DASP throughput, command-center micro functioning, and historical case studies convert that abstract risk into clear trade-offs between short-term disruption and long-term savings.
For long-term rentals, what what-if models help us compare fixed monthly rentals vs more flexible options when attendance keeps changing due to hybrid work?
B0576 LTR fixed vs flexible scenarios — In India corporate Long-Term Rental (LTR), what scenario models help Admin and Finance compare fixed rentals versus variable demand options when site attendance becomes more elastic due to hybrid work?
In India corporate Long-Term Rental, Admin and Finance teams get the clearest comparison between fixed rentals and variable-demand options when they model scenarios by seat-demand patterns, not just vehicle counts. The most useful models hold service levels constant and vary attendance elasticity, fleet mix, and commercial structure to see how Cost per Employee Trip and Cost per Kilometer behave under each option.
The first scenario model keeps a traditional LTR-only approach. Admin fixes a dedicated vehicle and chauffeur for 6–36 months and runs sensitivity on three attendance bands. The bands are high attendance with >80% seat-fill, medium with 50–80%, and low with <50%. Finance then calculates CET and dead mileage across these bands. The model exposes that fixed rentals are defensible when occupancy is stable. It also shows cost blowouts when hybrid work drops utilization but the rental and chauffeur costs stay locked.
The second scenario model introduces a hybrid fleet mix. A core LTR “base” is modeled against minimum guaranteed shift coverage. Variable demand above or below that base is simulated using per-trip, per-seat, or point-to-point models drawn from EMS or CRD playbooks. Finance then compares outcomes across monthly, quarterly, and annual horizons, focusing on CET, Vehicle Utilization Index, and SLA adherence. This model typically shows that combining a smaller LTR base with outcome-priced variable supply reduces total cost and preserves uptime when attendance is volatile.
The third scenario model focuses on outcome-linked commercials. Admin and Finance run side-by-side comparisons where payouts under variable models are indexed to OTP%, Trip Adherence Rate, and Trip Fill Ratio, while LTR remains fixed. This helps quantify the value of paying slightly more per trip in exchange for lower dead mileage and fewer underfilled runs, especially when hybrid attendance patterns are unpredictable by week or by shift.
How can scenario models help us plan vendor tiering and substitutions across sites so we’re not stuck if a region underperforms or a vendor suddenly exits?
B0577 Multi-site vendor substitution planning — For India corporate EMS multi-site governance, how can scenario models support vendor tiering and substitution playbooks so leadership has a defensible plan when a region underperforms or a vendor exits suddenly?
For India corporate Employee Mobility Services, scenario models support vendor tiering and substitution playbooks by pre‑computing “what if” capacity, cost, and SLA impacts under multiple failure conditions so leadership has a quantified, audit-ready plan before a region underperforms or a vendor exits. Scenario models make vendor change a governed, data-driven action rather than an ad‑hoc crisis response from the transport desk.
Scenario models work best when they use EMS operational data that the command center already observes. This includes OTP%, Trip Adherence Rate, Vehicle Utilization Index, Trip Fill Ratio, dead mileage, incident rate, and EV utilization ratio if green mobility is in scope. Most organizations define tier‑1, tier‑2, and backup vendors using these KPIs over a rolling period, not just commercial price. A common failure mode is to tier vendors only on commercials without modeling what happens to OTP, seat‑fill, and cost per employee trip when a vendor is removed from a specific shift band or region.
Scenario modeling allows transport heads and procurement to stress-test vendor exit and underperformance at city, cluster, and shift-window level. One scenario might simulate a tier‑1 vendor losing 30% fleet uptime in a night-shift band in one city. A second scenario might model a full exit, including how quickly tier‑2 vendors and spot CRD capacity can backfill while retaining guard/escort and women-safety compliance. A third scenario can simulate charging gaps for EV-heavy fleets in that region and quantify the shift back to ICE capacity.
A practical playbook usually encodes three linked elements in advance:
- Clear vendor tiers by city and shift window with minimum reserved capacity and compliance status.
- Pre-approved substitution rules that define which vendor, fleet type, and commercial model will be used when OTP% or incident thresholds are breached for a defined period.
- Command-center SOPs that describe how routing, rostering, and HRMS integration will be switched, and how employees, HR, and Security are informed during the transition.
Scenario outputs also give the CFO and procurement defensible numbers for outcome-based contracts. Leadership can see, for each scenario, the projected change in cost per kilometer, cost per employee trip, and CO₂ per passenger-kilometer when vendor mix changes. This supports pre-negotiated incentive and penalty ladders, and avoids disputes when substitutions are triggered.
For the Facility / Transport Head, scenario-backed playbooks reduce 2 a.m. firefighting. The command center can move from manual rostering to routing engine-based dynamic reallocation, with predefined buffers and dead-mile caps per region. Business continuity plans for strikes, monsoon disruptions, or technology failures become parameterized rather than purely narrative, which aligns with the wider mobility risk register and business continuity planning described in the industry brief.
images:
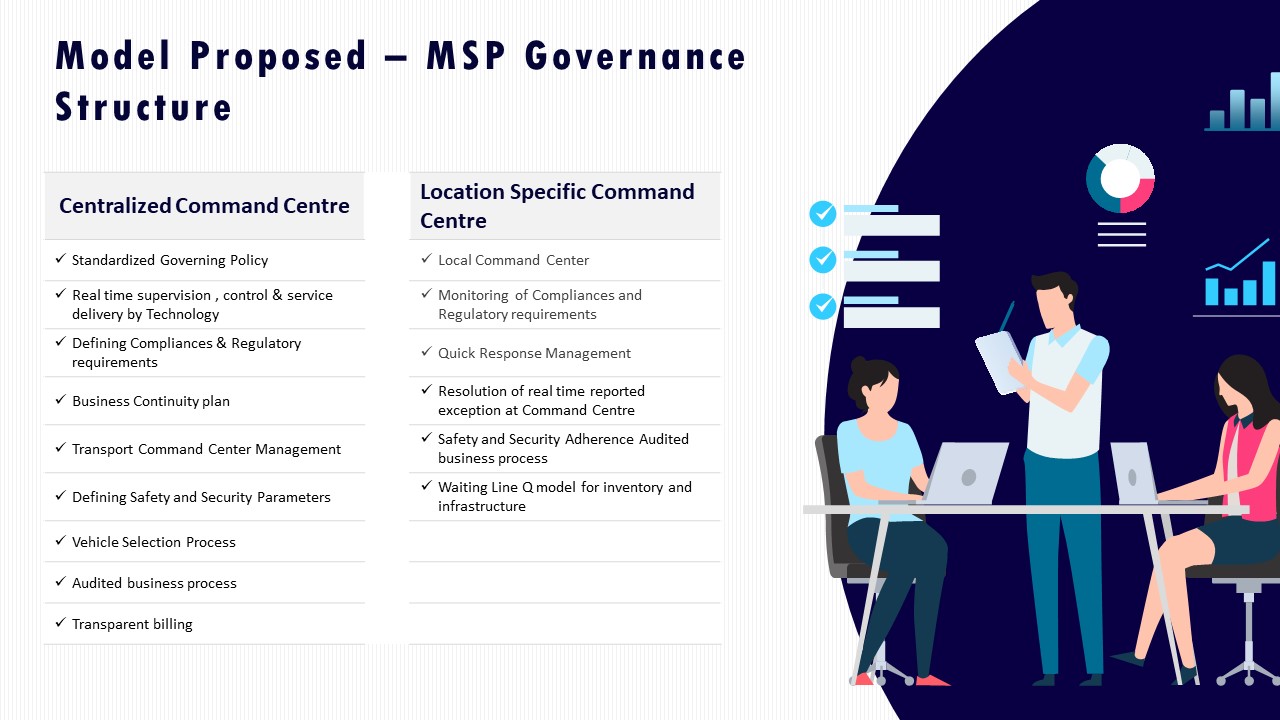
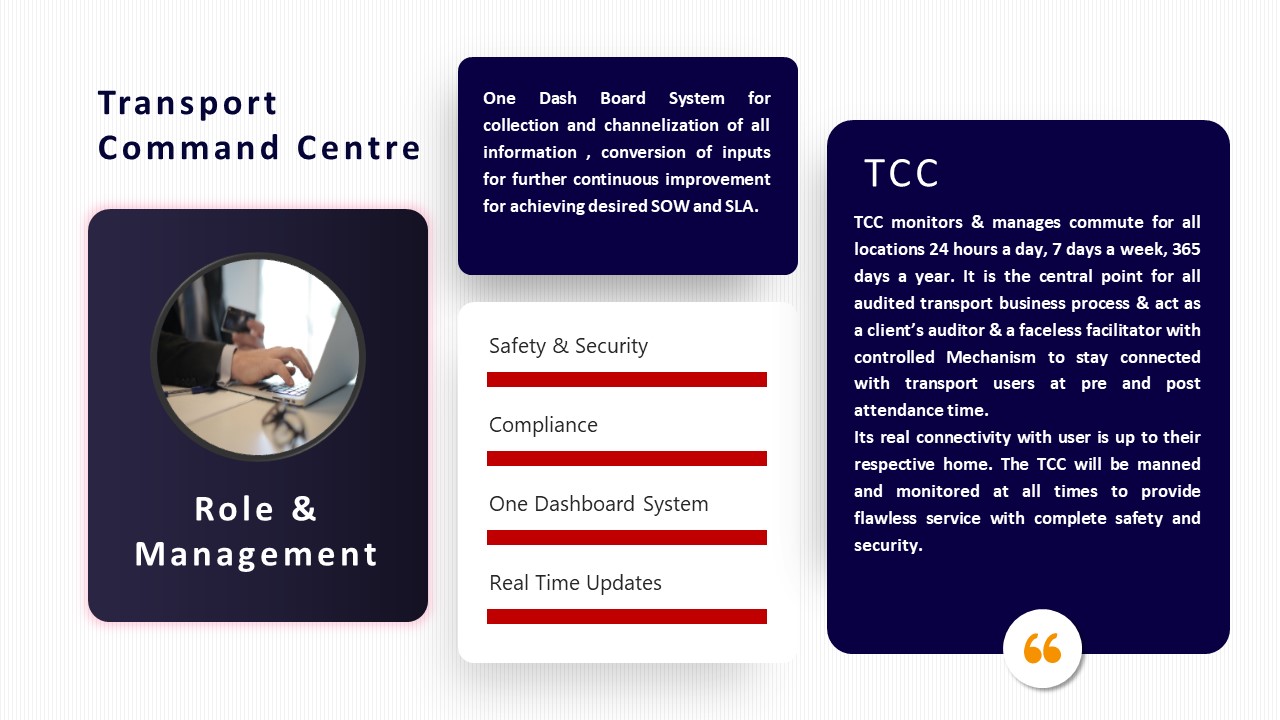
How can HR and Procurement use scenario models to negotiate exit terms—data access, shadow period, cutover SLAs—so we’re not trapped if service drops?
B0582 Scenario-informed exit and transition terms — In India corporate EMS, how should HR and Procurement use scenario models to negotiate exit and transition terms (data access, shadow operations period, and cutover SLAs) so the organization isn’t trapped if service quality declines?
In Indian corporate employee mobility, HR and Procurement should negotiate exit and transition terms as explicit, scenario-tested playbooks rather than generic clauses. Scenario models force both parties to agree how data access, shadow operations, and cutover SLAs will work under specific failure conditions, so the organization can switch vendors without losing control of safety, reliability, or audit trails.
Scenario modelling works best when HR defines operational risk scenarios and Procurement converts them into enforceable, measurable terms. Typical EMS scenarios include sustained OTP drops, repeated safety or compliance breaches, tech outages affecting rostering and tracking, and vendor capacity failures during scale-up or city expansion. Each scenario should have predefined triggers, e.g. OTP% below a threshold for a defined period, critical incident with non-closure within SLA, or repeated app downtime during peak shifts.
For exit protection, Procurement should link each trigger to a structured transition mechanism. That mechanism should define data access rights and formats for trip logs, GPS trails, employee manifests, driver compliance records, and billing history. It should also define a shadow operations period in which an incoming provider or internal team can run parallel rosters and routing against the same HRMS and command-center data, with clear responsibilities for who controls trips versus who observes.
Cutover SLAs should be framed like any other EMS SLA but scenario-specific. They should specify maximum downtime during switch, minimum OTP and safety guardrails during transition, and evidence requirements for compliance and incident logging. HR should insist that women-safety protocols, night-shift escort rules, and SOS coverage cannot degrade below existing standards at any point in the transition window.
Useful internal checks for HR and Procurement before signing include: - Whether exit triggers and timelines are clearly measurable from existing dashboards and reports. - Whether data formats and transfer frequency are defined so a new EMS provider can plug into HRMS and NOC tools without re-collecting baselines. - Whether the business continuity plan for EMS explicitly covers vendor failure scenarios, not just external disruptions.
When we launch a new site or change shift timings, where do these scenario models usually go wrong—and what early signals should we watch to spot drift quickly?
B0588 Site launch model failure signals — In India corporate employee transport, what are the most common ways scenario models fail during a site launch (new facility or new shift timings), and what leading indicators should a Facilities/Transport manager monitor to catch model-to-reality drift early?
Most scenario models for new sites or shift patterns fail in Indian corporate transport when they ignore real on-ground variability in demand, supply, and constraints. Transport managers reduce risk by treating launch-week operations as a controlled experiment and tracking early-warning indicators on attendance, routing, vendor readiness, and safety compliance rather than assuming the transition plan is correct.
Scenario models usually break first on the demand side. Predictions based only on HR-sanctioned headcount miss hybrid-work behavior, last‑minute roster changes, and no‑show patterns. This leads to under- or over-provisioned capacity, low Trip Fill Ratio, and rising dead mileage. A second failure mode is routing realism. Paper routes ignore local bottlenecks, seasonal disruption (e.g., monsoon), and gate and shift window constraints, which causes On-Time Performance slippage, bunching of pickups, and rising exception-handling.
Supply and vendor assumptions are another weak point. Models that assume full fleet uptime overlook driver fatigue, actual GPS/IVMS readiness, and tier‑2 or night-band coverage gaps. Safety and compliance models often fail when escort rules, women‑safety constraints, and documentation cadences are treated as static checklists instead of continuously audited obligations. Data assumptions break when HRMS, roster tools, and transport platforms are not fully synchronized, creating model-to-reality drift that only appears at billing or during incidents.
Facilities / Transport managers can monitor a small set of leading indicators during the first 2–6 weeks of a new launch to catch drift early:
- Demand & utilization: Daily variance between planned vs actual riders per trip, no‑show and adhoc‑request rates, and Trip Fill Ratio on each route and band.
- Reliability & routing: On-Time Performance by shift and corridor, average exception detection→closure time in the command center, and recurring route deviations flagged in GPS logs.
- Supply & workforce health: Fleet uptime by vendor and category, last‑minute vehicle/driver substitutions, and basic driver fatigue proxies such as duty-cycle length and repeat night shifts.
- Safety & compliance: Percentage of trips with current driver and vehicle credentials, women‑centric rules adherence on night bands, SOS / incident alerts per 1,000 trips, and escalation matrix response times.
- Experience & noise level: Commute-related tickets to helpdesk, repeated complaints by route or shift, and floor-level feedback from team leads on missed or bunched pickups.
Consistently reviewing these signals in a daily or weekly command-center huddle allows teams to recalibrate routes, fleet mix, and SOPs quickly, before small gaps harden into chronic failures that reach senior leadership.
How can EHS use what-if scenarios to see if new night-shift safety rules or geo-fencing will create bottlenecks that increase risk or noncompliance?
B0591 Safety policy change bottleneck tests — In India Employee Mobility Services (EMS), how can a Security/EHS lead use scenario models to test whether policy changes (women’s night shift escort rules, geo-fencing constraints) will create operational bottlenecks that quietly increase risk and noncompliance?
A Security or EHS lead should use scenario models that explicitly link safety policies to routing, capacity, and shift windows, then stress‑test those models against real EMS demand patterns before changing rules on women’s night-shift escorts or geo-fencing constraints. Scenario modelling works when safety constraints, fleet availability, and OTP/route metrics are simulated together and examined for side effects like missed shifts, dead mileage, or rule violations.
A practical starting point is to treat each safety rule as a parameter in the routing and capacity model. Escort requirements, hard geo-fence “no‑go” zones, and night‑shift timebands should be encoded as constraints in the routing engine, alongside existing rules such as shift windowing, maximum duty hours, and seat-fill limits. The Security/EHS lead can then collaborate with Transport Ops to run A/B scenarios on historical trip data and telematics logs for typical weeks, peak seasons, and incident-heavy periods.
The Security/EHS team should explicitly check for four signals of hidden risk in each scenario. First, a drop in On-Time Performance (OTP%) for women’s night-shift trips often indicates growing pressure to bypass escort or route-approval rules. Second, rising dead mileage and longer duty cycles per driver suggest fatigue risk and lower enforcement of rest-period norms. Third, an increase in exception volume in the command center, such as last-minute roster overrides or manual routing, usually predicts higher noncompliance with escort and geo-fencing rules. Fourth, a higher share of trips running close to shift-start cutoffs implies a shrinking buffer for safe detours or incident handling.
To keep the scenario exercise operationally grounded, the Security/EHS lead should include adjacent governance dimensions from the EMS environment. These dimensions include driver KYC/PSV status and fatigue indices from IVMS data, HRMS-linked roster volatility, and vendor SLA performance on night-band OTP and incident closure SLAs. Scenario outputs should be summarized as simple decision views: impact on OTP%, Trip Adherence Rate, escort-rule adherence, and incident-exposure windows, allowing the Safety function to recommend either revised policies, additional escort capacity, or adjusted geo-fence definitions before any field rollout.
When we switch vendors, what kind of scenario modeling helps Procurement and Ops align on timeline, coverage gaps, and contingency fleet without finger-pointing later?
B0592 Aligning procurement and ops transitions — In India corporate mobility multi-vendor environments, what scenario modeling approach helps Procurement and Operations agree on a realistic vendor transition plan (cutover timeline, coverage gaps, contingency fleet) without each side accusing the other of underestimating risk?
In Indian corporate mobility with multiple vendors, the most effective way for Procurement and Operations to agree on a realistic transition plan is to use a joint, parameterized scenario model built on the actual ETS/CRD operation cycle and command-center data, instead of on vendor promises or isolated spreadsheets. The scenario model needs to explicitly simulate cutover phases, coverage gaps by timeband and zone, and contingency fleet buffers, using shared assumptions that both sides sign off on in advance.
The model works best when it is anchored in the existing ETS Operation Cycle and Project Planner style timelines already familiar to operations teams. The scenario inputs should include shift windows, current OTP%, fleet uptime, dead mileage, and city-wise infrastructure constraints drawn from Indicative Transition Plans, Project Planner charts, and Infrastructural Requirement tables. Procurement and Operations can then vary parameters such as go-live week, vendor mix, and buffer fleet percentage, and see projected impacts on OTP, coverage, and CET/CPK.
A common failure mode is debating optimistic versus pessimistic assumptions verbally. A better approach is to define three explicit scenarios in the model. One scenario uses current best performance data from dashboards and Indicative Management Reports. One scenario adds stress from monsoon, strikes, or tech instability using Business Continuity Plans and Management of On-Time Service Delivery baselines. One scenario enforces worst‑case constraints like cab shortages or infrastructure delays from BCP documentation. Each scenario runs through the same ETS Operation Cycle or Process Flow so gaps are visible as missed routes, lower utilization, or increased exception volume.
Procurement gains defensibility because commercial terms, penalties, and transition milestones can be tied to specific modeled scenarios and BCP triggers. Operations gains protection because buffer fleet, standby vehicles, and contingency routing are sized based on stress-tested assumptions, not on flat percentage cuts. Both sides reduce blame because the agreed model, not an individual, becomes the reference when actual performance diverges from plan.
If we’re launching a new site, what should a believable what-if model include so Ops can commit to service levels without taking a risk on rosy assumptions?
B0615 Defensible site launch model — In India corporate ground transportation vendor evaluation for Employee Mobility Services, what does a ‘defensible’ what-if model look like for a new site launch (new office/plant) so Operations can commit to OTP without betting their credibility on optimistic assumptions?
A defensible what‑if model for a new EMS site launch in India is a scenario engine that starts from known constraints and audited baselines, then stress‑tests OTP under realistic worst‑case conditions instead of ideal averages. It combines routing and fleet math, driver and shift constraints, and EV/ICE feasibility into a few clearly documented scenarios that Operations can explain and defend later to HR, CFO, and auditors.
A robust model starts with demand realism. The model uses actual or HR‑validated roster patterns by shift window, geo‑clustered employee catchments, and expected hybrid attendance variability instead of a single “average load” number. It explicitly models peak entry/exit windows, no‑show rates, and female‑first night routing rules so that escort policies and detours are baked into OTP calculations from day one.
Route and fleet sizing are scenario‑driven rather than single‑point estimates. The model runs multiple variants of routing and cab pooling with seat‑fill targets, dead‑mileage caps, and realistic buffer times based on local traffic conditions. For each scenario it outputs required fleet mix (sedan/MUV/shuttle/EV), Vehicle Utilization Index, and OTP% expectations so Operations can show what happens if volume spikes, attendance drops, or one vendor underperforms.
Driver, safety, and compliance limits are treated as hard constraints, not afterthoughts. The model encodes duty cycles, rest‑hour rules, PSVs, escort requirements, and women‑safety routing and compares them against available driver pool and vendor bench strength. This protects the Facility / Transport Head from being forced into unsafe or non‑compliant practices just to hit an unrealistically high OTP target.
For EV or ESG‑linked programs, the model separates “green ambition” from operational reality. It uses vendor or OEM data on EV range, charging windows by shift pattern, and charger density to test EV/ICE hybrid mixes and identify routes or timebands where EVs can achieve uptime parity. It also links each scenario to emission intensity per trip, enabling later ESG reporting without inflating claims.
A defensible what‑if model always documents assumptions and failure modes in simple, control‑room language. Operations can show three or four labeled scenarios such as “Base load,” “+20% volume spike,” and “Single‑vendor failure,” with clear OTP impact and mitigation levers like standby fleet, alternate routing windows, or additional vendor tiers. This allows the Transport Head to commit to an OTP range tied to visible buffers and escalation SOPs, rather than a single optimistic promise that collapses when traffic, weather, or driver availability shifts.
When switching transport vendors, how do we compare their what-if transition plans so we don’t end up with a chaotic cutover and escalations?
B0616 Compare vendor transition scenarios — In India Employee Mobility Services procurement, how should a category manager compare vendors’ scenario models for vendor transitions (handover between fleet partners) to reduce the risk of a messy cutover that triggers incident spikes and leadership escalations?
In India Employee Mobility Services procurement, a category manager should compare vendors’ transition and handover models by how concretely they prevent disruption at shift level, how they use buffers and command-center governance during the cutover, and how auditable their controls are for safety, OTP, and escalation handling. The most reliable vendors treat transition as a phased, SLA-governed operation with defined playbooks, not as a date on a contract.
Vendors’ scenario models work best when they are anchored in a documented project/transition plan with week-by-week milestones for pre-transition, manpower deployment, technology adoption, and fleet deployment. Strong models use macro- and micro-level project planners to stage migrations by site, time-band, and route cluster, with explicit responsibilities split between client and operator. Scenario depth improves when vendors show how their centralized command centre and local control desks will run dual-operations, extra monitoring, and live coordination during handover.
A common failure mode is “big bang” vendor switches without buffers, where driver onboarding, fleet compliance, and app readiness lag behind contractual go-live. Category managers should therefore compare how each vendor handles business continuity planning, including buffer vehicles, backup vendors, and mitigation plans for strikes, technology failures, and weather. Scenario models are stronger when they include explicit BCP variants for cab shortages, natural disasters, political action, and monsoon traffic disruptions.
To reduce incident spikes, the category manager should stress-test how vendors manage driver and fleet induction under transition pressure. The most resilient models include structured onboarding for fleet, drivers, and supervisors, with documented assessment, training, safety induction, and compliance checks before any asset is tagged to live routes. Vendors who can demonstrate centralized compliance management, vehicle and driver compliance workflows, and safety inspection checklists are less likely to compromise standards under cutover pressure.
A robust transition scenario will also show how the transport command centre (or equivalent NOC) will oversee the cutover using real-time tracking, alerts, and SLA dashboards. Category managers should compare vendors on how they deploy a command centre to watch OTP, route adherence, and safety alerts, and how they will manage escalations via a clear escalation matrix. Models are safer when they define how on-time performance targets (for example, 98% OTP) will be protected with early-warning analytics and proactive rerouting during the transition window.
Vendors’ scenario models gain credibility when they incorporate contingency for fragmented tech and on-ground failures. Category managers should ask how the vendor will handle GPS or app downtime, including manual operation modes, fallback SOPs, and a single-window reporting and dashboard system. The presence of data-driven insights dashboards, management reports, and single-window KPI views improves control, because deviations and service issues can be detected and closed before they turn into leadership escalations.
Comparing models also requires looking at how vendors manage multi-vendor or multi-fleet transitions. Strong models articulate how they will coordinate between outgoing and incoming fleet partners using a command-centre-led MSP governance structure, buffer allocations, and shared compliance standards. Vendors that can explain their vendor and statutory compliance frameworks and how they will maintain consistent audit trails across partners during handover are better suited to complex transitions.
To operationalize comparison, a category manager can focus on a few transition-scenario signals:
- Presence of a detailed indicative transition plan or project planner with timelines, roles, and dependencies for fleet, technology, and manpower.
- Documented business continuity plans that cover cab shortages, strikes, natural disasters, and technology failures, with explicit mitigation actions and ownership.
- Evidence of centralized command-centre operations with defined micro-functioning steps, SLA monitoring, and escalation mechanisms during the cutover.
- Structured driver and fleet onboarding, compliance, and training programs that do not get compressed or bypassed during transition.
- Use of centralized dashboards and data-driven insights for real-time visibility of OTP, safety, compliance, and deviations throughout the handover window.
Scenario models that meet these criteria reduce the chance of messy cutovers, because they convert transition risks into governed, observable operations that can be defended to leadership and auditors even if incidents occur.
If we add a new shift at a site, how do we use scenario modeling to estimate extra vehicles and routes without overcommitting long-term?
B0631 Model new shift capacity needs — In India corporate Employee Mobility Services site expansion planning, what’s a realistic way to use scenario models to estimate how many additional vehicles and routes are needed when a new shift is added, without overcommitting to long-term capacity?
In India corporate employee mobility, the most realistic way to size vehicles and routes for a new shift is to run 2–3 demand and routing scenarios off HRMS roster data, then lock only a “base” capacity into contracts and keep the rest as buffer through flexible or project-style capacity. This approach gives enough cabs to protect on‑time performance while avoiding long-term overcommitment on vehicles that may sit idle as attendance fluctuates.
A practical planning pattern is to start from HRMS or shift rosters and build three simple scenarios. One scenario assumes low attendance with conservative pooling. One assumes “expected” attendance. One assumes a stress case with higher seat-fill and more no‑shows. Each scenario converts employees per timeband into approximate routes by applying simple pooling rules and dead‑mileage caps, which are standard EMS routing constraints in India.
Transport teams can then define a base fleet for the new shift that covers the expected scenario with some safety margin. The difference between the stress scenario and this base is treated as buffer. That buffer can be procured via short-term project/event commute contracts, on-demand CRD supply, or multi-vendor aggregation instead of long-term dedicated LTR-style commitments.
To keep daily operations stable, organizations typically layer this with command-center observability and routing tools that support dynamic route recalibration, seat-fill monitoring, and shift windowing. The command center monitors OTP, trip adherence, and no‑show patterns in the first 4–8 weeks of the new shift, then adjusts the base-versus-buffer split as real data replaces assumptions.
Key steps an on-ground transport head can use as an SOP for a new shift are:
- Pull 4–8 weeks of comparable shift and attendance data from HRMS to estimate realistic headcount by timeband.
- Define routing rules for the site, such as max seats per cab, women-first or escort rules, and acceptable trip duration windows.
- Run three roster-based allocation passes to approximate the number of routes and vehicles under low, expected, and high-load scenarios.
- Fix long-term capacity at the expected scenario level with a small safety margin, and secure the remaining capacity as flexible, short-tenure or on-demand supply.
- Use the first cycle of live operations to refine assumptions based on OTP%, Trip Fill Ratio, and dead mileage, then reset the base fleet and buffers accordingly.
For cutover week, what scenario questions should Ops ask about onboarding, driver readiness, route stabilization, and control room staffing to avoid escalations?
B0632 Cutover week scenario checklist — In India corporate Employee Mobility Services vendor transition planning, what scenario questions should an operations manager ask about cutover week realities (app onboarding, driver familiarization, route stabilization, NOC staffing) so the transition doesn’t trigger a spike in escalations?
Operations managers should frame cutover week as a stress test on reliability, not just a go-live date, and ask scenario questions that expose where OTP, safety, and communication can fail under real conditions.
Employee app onboarding & changeover
Operations managers should ask how many employees can realistically be onboarded per day and what happens to trips for users who are not onboarded when the legacy system is switched off. They should ask what the fallback SOP is if the employee app, OTP, or live tracking fails mid-shift and how ad-hoc bookings, late roster changes, and no-shows will be handled while two systems overlap.
They should also ask how HRMS integration, shift rosters, and manager approvals will be cut over so that bookings, seat bookings, and eligibility rules stay consistent during the first week.
Driver and escort familiarization
Operations managers should ask how many dry runs each new driver will complete on critical night and high-risk routes before carrying employees. They should ask how driver app training, SOS protocols, women-centric safety rules, and site-entry procedures will be validated and who signs off that a driver is “route ready” during cutover week.
Route and fleet stabilization
Operations managers should ask what buffer fleet and spare cabs exist for the first 7–10 days to absorb bad ETAs, routing errors, and monsoon or traffic disruptions. They should ask how dynamic routing, trip merging, and pooling will be throttled in the first week so experimentation does not break OTP and how dead mileage and handover between old and new vendors will be controlled each shift.
NOC / Command Center staffing and escalation
Operations managers should ask what NOC staffing model will run in cutover week across central and site command centers and which alerts (geofence violations, GPS loss, device tampering, over-speeding, missed check-ins) will be monitored manually versus automatically. They should ask what the escalation matrix is for the first 72 hours, including who answers calls at night, how quickly incidents must be acknowledged and closed, and how Business Continuity Plan playbooks will be invoked for technology failure, cab shortage, or political or weather disruption during transition.
How do we use scenario modeling to decide between vendor consolidation vs multi-vendor, without ignoring transition risk and regional differences?
B0633 Consolidation vs multi-vendor scenarios — In India corporate Employee Mobility Services finance and procurement evaluation, how can stakeholders use scenario models to decide whether to consolidate vendors or keep a multi-vendor setup, without underestimating transition risk and regional variance?
In Indian corporate employee mobility services, finance and procurement teams should use explicit scenario models that compare “single strategic partner” versus “tiered multi-vendor” setups across cost, reliability, and risk, while encoding transition effort and regional differences as quantified assumptions instead of afterthoughts. Scenario models are effective when they translate OTP, CET/CPK, vendor SLA performance, and regional supply depth into measurable trade-offs that can be stress-tested before contracts change.
A useful starting point is to define two or three clear operating scenarios such as “Consolidated Pan-India EMS with one primary operator,” “Regional Tiering with 1–2 preferred vendors per cluster,” and “Current fragmented model with guardrails.” Each scenario should be parameterized by unit economics like cost per employee trip, dead mileage, and vehicle utilization index, and by risk indicators like SLA breach rate, incident rate, and vendor dependency concentration. Transition risk needs its own line items, including ramp-up timelines from transition plans, buffer fleet requirements from business continuity plans, and change-management overhead in command center operations.
Regional variance should be modeled by creating city or cluster-level sub-scenarios that reflect local fleet density, EV readiness, and vendor capability tiers. Procurement can then evaluate whether a national consolidation increases exposure in Tier 2/3 locations where supply is thinner or where specialized escorts and women-safety protocols are harder to standardize. Finance teams can run sensitivity tests where key inputs like hybrid-work attendance, night-shift volume, or EV uptime change, to see where a single-vendor model breaks and where a multi-vendor ecosystem preserves resilience.
To keep decisions defensible, stakeholders can embed outcome-linked procurement metrics directly into the scenarios, tying payouts to OTP%, incident closure time, and seat-fill targets, while also specifying exit and substitution playbooks within a vendor governance framework. This approach helps avoid lock-in and ensures that even in a consolidated setup, there is a structured path to rebalance vendors if SLA performance or regional conditions deteriorate.
What should our CFO ask to ensure the scenario model covers downside cases like RTO changes, new shift timings, or stricter women-safety routing rules that change costs?
B0634 Downside policy change coverage — In India corporate Employee Mobility Services, what should a skeptical CFO ask to confirm that scenario models include downside cases for policy changes (RTO mandates, shift timing changes, women-safety routing constraints) that can materially alter route economics?
The skeptical CFO should ask explicitly whether every mobility scenario includes tested downside cases for policy and regulatory shifts that can change demand patterns, routing rules, and cost baselines. The CFO should also insist that each scenario links back to Cost per Employee Trip (CET), Cost per Kilometer (CPK), and vendor commercials so that downside outcomes are financially traceable and not just operational narratives.
The CFO should test the robustness of scenario modelling by pushing on three areas. The first area is demand and shift-policy shocks, such as Return-to-Office (RTO) mandates or new fixed shift windows. The second area is safety and compliance overlays, such as women-safety constraints and escort rules that reduce pooling and increase dead mileage. The third area is governance and contracts, verifying that outcome-based pricing and SLA frameworks respond predictably when routing and utilization degrade.
The following questions help a CFO confirm that downside cases are explicitly modelled rather than assumed away:
- Demand & RTO policy shocks
- “Show me your base-case versus downside-case CET and CPK when RTO goes from, for example, 2 days a week to 5 days a week.”
- “How do your route and fleet models change when attendance volatility drops and peak shift density increases?”
- “What assumptions do you use for Trip Fill Ratio (TFR) and Vehicle Utilization Index after a policy-driven attendance change?”
-
“Do your scenarios include partial-RTO patterns, such as different RTO rules by team or site, and how does that fragment routing and cost?”
-
Shift timing and windowing changes
- “If we compress or extend shift windows for business reasons, how do your models recalculate fleet size, dead mileage, and OTP%?”
- “Show me a scenario where a major business unit changes its shift start by 60–90 minutes. How much does that move CET, in percentage terms?”
-
“Do you simulate conflicting shift clusters across sites that break pooling efficiency, and can you quantify the loss in Trip Adherence Rate and cost?”
-
Women-safety and routing constraints
- “How do you model women-first routing rules, escort requirements, and night-shift restrictions in your optimization engine?”
- “Show me a scenario where all women employees must be dropped first and never last. What does that do to seat-fill, distance, and fleet requirement?”
- “Do you quantify the cost impact of women-safety routing as a separate component, so Finance can defend it as a deliberate duty-of-care expense?”
-
“Are your women-safety policies encoded as hard constraints in the routing engine, or applied manually by the operations team?”
-
Contract and commercial sensitivity
- “Which commercial levers are most sensitive to these downside cases: per-km, per-trip, per-seat, or fixed monthly models?”
- “Do you provide a sensitivity table showing how OTP penalties, minimum-guarantee clauses, or dead-mile caps behave under these stressed scenarios?”
-
“If RTO, shift windows, or safety rules change mid-contract, what is the pre-agreed mechanism to adjust commercials without disputes?”
-
Data, baselines, and validation
- “Which historical data sets did you use to calibrate these downside scenarios—by city, timeband, and service type (EMS vs CRD vs ECS)?”
- “Can we run a joint scenario on last quarter’s actual trip data and see the impact of new policies on CET, CPK, and fleet uptime?”
-
“How often do you refresh scenario assumptions for hybrid-work patterns, traffic behavior, and safety rules, and who signs off on them?”
-
Governance, monitoring, and early-warning
- “What early indicators on your dashboards signal that a downside policy scenario is materializing—for example, falling TFR or rising dead mileage?”
- “Do you provide a playbook for how Transport, HR, and Finance should respond when OTP, cost, or utilization drift beyond thresholds due to policy changes?”
- “Are these downside scenarios embedded into quarterly business reviews and Mobility Governance Board discussions, or only used at RFP time?”
These questions keep the conversation anchored in unit economics, on-time performance, and safety/compliance constraints rather than generic “AI routing” claims. They also force the provider to demonstrate that their routing engine, command center operations, and commercial models are built for policy volatility instead of assuming static shifts and unrestricted pooling.