How to bring calm to Tier-2 coverage: a practical control-room playbook for daily reliability
You live this problem every shift: driver no-shows, late pickups, and disruptions from weather or traffic. This guide reframes Tier-2 coverage as a control-room problem—build repeatable, on-ground routines that keep shifts moving rather than chasing promises. This lens set cuts through hype, requires ground-tested evidence, and translates vendor claims into actionable playbooks you can take to leadership. It shows what to verify, how to escalate, and what to do when the system or a vendor stalls.
Is your operation showing these patterns?
- 3 a.m. escalations spike from driver no-shows and lack of nearby spares
- night shifts rely on remote alerts that fail to trigger local action
- vendor escalation desks ping-pong between teams with no clear owner
- spares exist on paper but cannot meet the current shift window
- offline/low-connectivity days stall the control-room and drivers go dark
- festival season still yields late pickups despite promised surge capacity
Operational Framework & FAQ
tier-2 coverage reality and on-ground readiness
Diagnose true regional density, on-ground supervision, spares availability, and escalation reach—and translate claims into repeatable ground-tested procedures that keep shifts moving.
For our employee transport in India, how can we tell if poor tier-2 coverage (not enough partners, supervisors, or spare vehicles) is what’s really driving late pickups and night escalations?
B1371 Diagnosing tier-2 coverage gaps — In India corporate Employee Mobility Services (EMS), how should a Facilities/Transport Head diagnose whether current regional coverage and tier-2 support gaps (partner density, on-ground supervisors, spares availability) are the real root cause of repeated late pickups and night-shift escalations?
In Employee Mobility Services in India, a Facilities or Transport Head should separate perception from root cause by combining trip-level data, command-center style monitoring, and field validation across regions and vendors. The aim is to prove or disprove that weak regional coverage and tier‑2 support gaps are driving late pickups and night‑shift escalations, instead of blaming “traffic” or “drivers” generically.
First, the Transport Head should baseline reliability using structured KPIs. The team should measure on-time performance percentages by route, timeband, vendor, and city, and compare night-shift OTP against day-shift OTP for the same corridors. Consistently poor OTP in specific regions, compared to others using similar rosters and traffic conditions, is a strong signal that regional partner density and on-ground supervision are the constraint rather than planning quality.
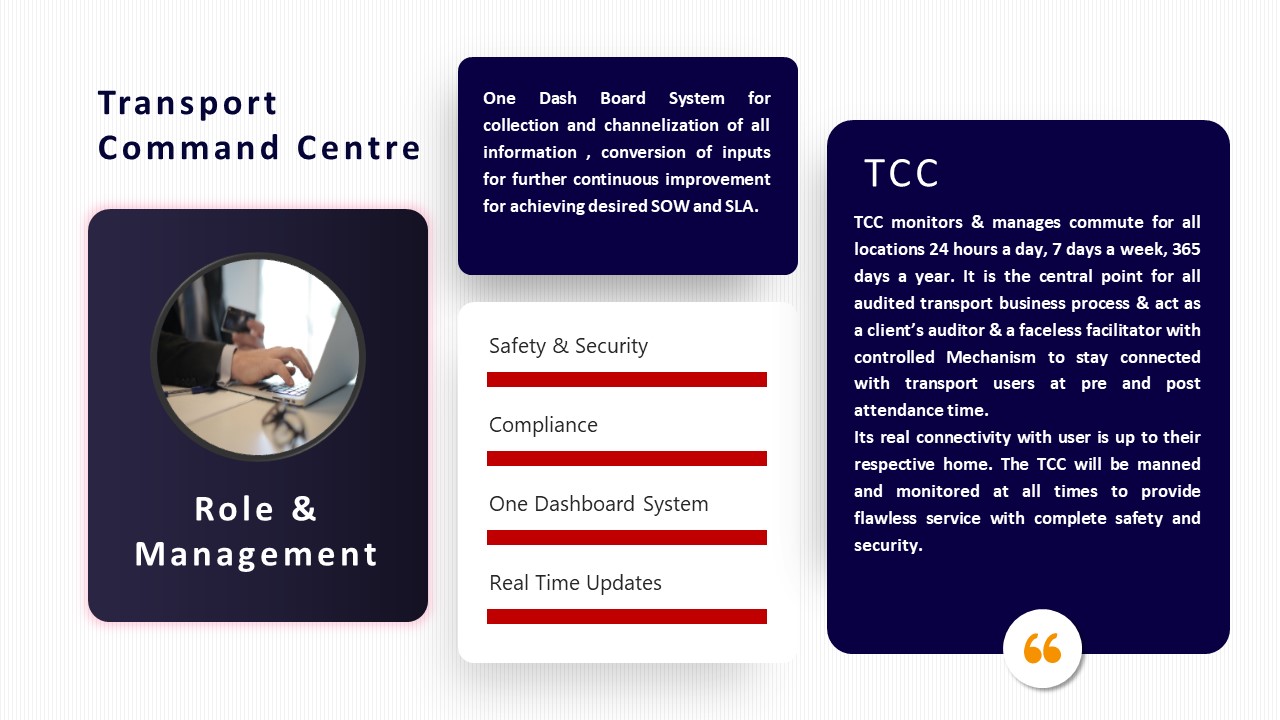
Second, control-room style observability should be used to trace each late pickup to an operational reason. The Transport Command Centre collateral shows how a centralized command center can correlate GPS traces, alert logs, vendor responses, and escalation workflows in real time. If repeated delays cluster around fleet shortages, non-availability of standby vehicles, or slow response to breakdowns in particular tier‑2 locations, then the density of partners, spares, and standby capacity is more likely the root cause than routing or app design.
Third, the Transport Head should contrast planned vs. actual resource availability by geography. They should compare contracted fleet, standby buffers, and supervisor presence in metro locations against smaller hubs and tier‑2 clusters, using vendor compliance reports and operational dashboards. If routes in thinly covered regions show higher dead mileage, more last-minute vehicle substitutions, and longer recovery times after incidents, then regional coverage gaps are directly contributing to late pickups and night-shift escalation frequency.
A practical diagnostic sequence can help structure this analysis.
- Slice OTP, trip adherence, and escalation counts by vendor, region, and timeband.
- For the worst-performing pockets, review trip logs and command-center notes to classify primary delay causes.
- Map these causes against local capacity: number of active vehicles, standby ratio, on-ground supervisors, and spares/backup availability.
- Field-validate in those regions by shadowing peak and night shifts to observe how breakdowns, no-shows, and deviations are handled in real time.
If the same vendor performs well where they have dense coverage but fails where they rely on stretched subcontractors and limited on-ground staff, then regional coverage and tier‑2 support gaps are the true root cause. If performance is uniformly poor regardless of geography, then routing logic, roster quality, or vendor governance and SLA enforcement are more likely the primary problems.
images:
When you say regional and tier-2 support for our commute operations, what all is included beyond just having a vendor listed—supervisors, spares, escalation, backup routes?
B1372 What tier-2 support actually includes — In India corporate Employee Mobility Services (EMS), what does “regional coverage and tier-2 support” practically include beyond just having vendors on paper—specifically around on-ground supervision, spares, escalation reach, and contingency routing?
In Indian Employee Mobility Services, “regional coverage and tier-2 support” only creates real value when it combines local physical capacity, live supervision, and clear escalation paths instead of just a vendor list. It must cover on-ground control, spare-capacity buffers, multi-level escalation that actually answers at night, and pre-planned reroute and BCP playbooks for weather, strikes, tech failures, and cab shortages.
Regional coverage starts with a multi-city operational footprint that is already running EMS, CRD, and project commute in those locations. It typically relies on a hub-and-spoke vendor model with vetted fleet partners, a mapped infrastructure requirement per city, and dedicated roles defined in a team structure so each branch knows who owns routing, pickup/drop coordination, and compliance. Effective coverage includes local vendor and statutory compliance processes, vehicle and driver induction, and a structured onboarding process for new fleets and supervisors.
Tier-2 support requires on-ground supervision, not just a remote helpdesk. Strong operators deploy daily shift-wise briefings, local project or event control desks, and a Transport Command Centre or Central Command Centre that monitors trips, alerts, and exceptions in real time. This is reinforced by micro-functioning SOPs for command centers, centralized compliance management, safety and security protocols for employees and women, and HSSE role clarity from leadership down to drivers.
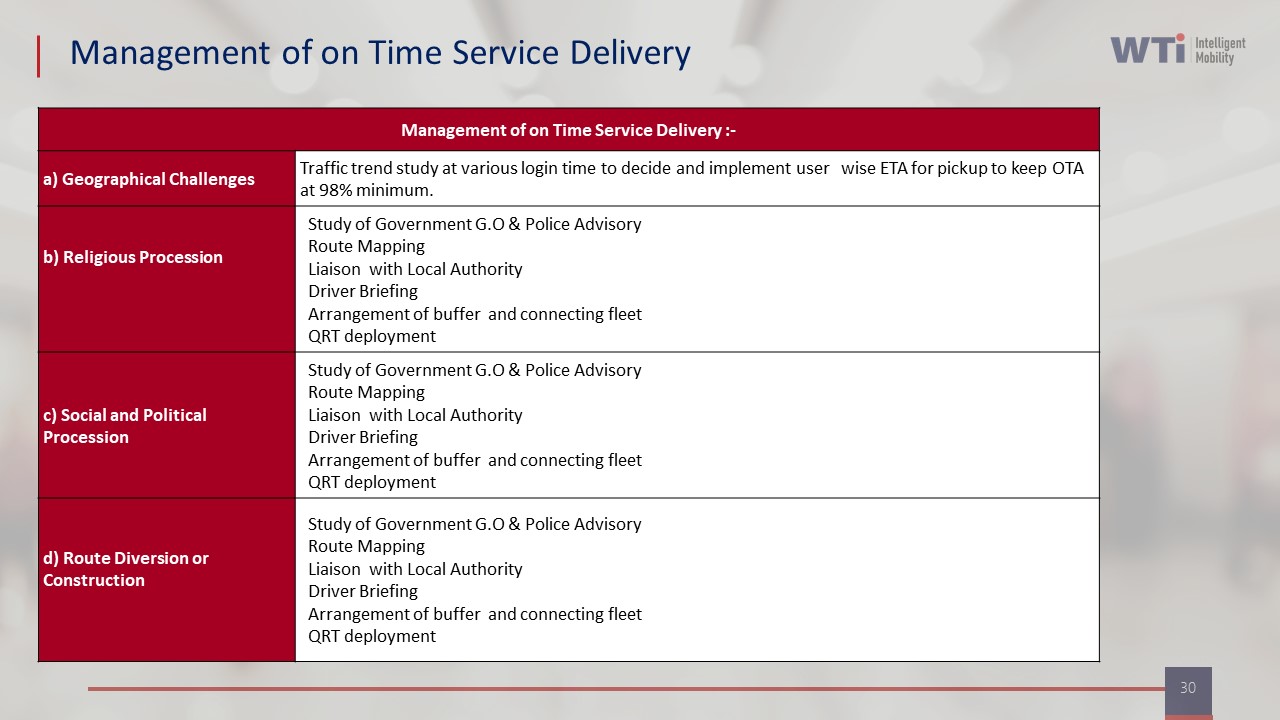
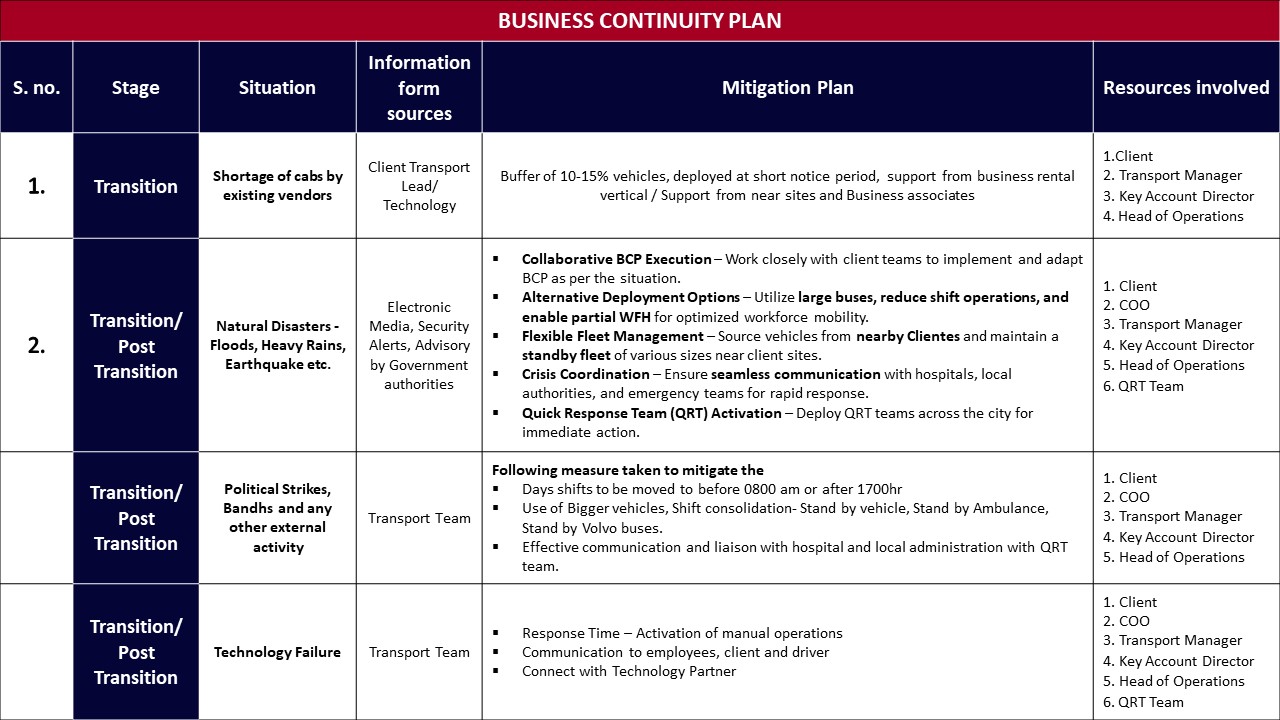
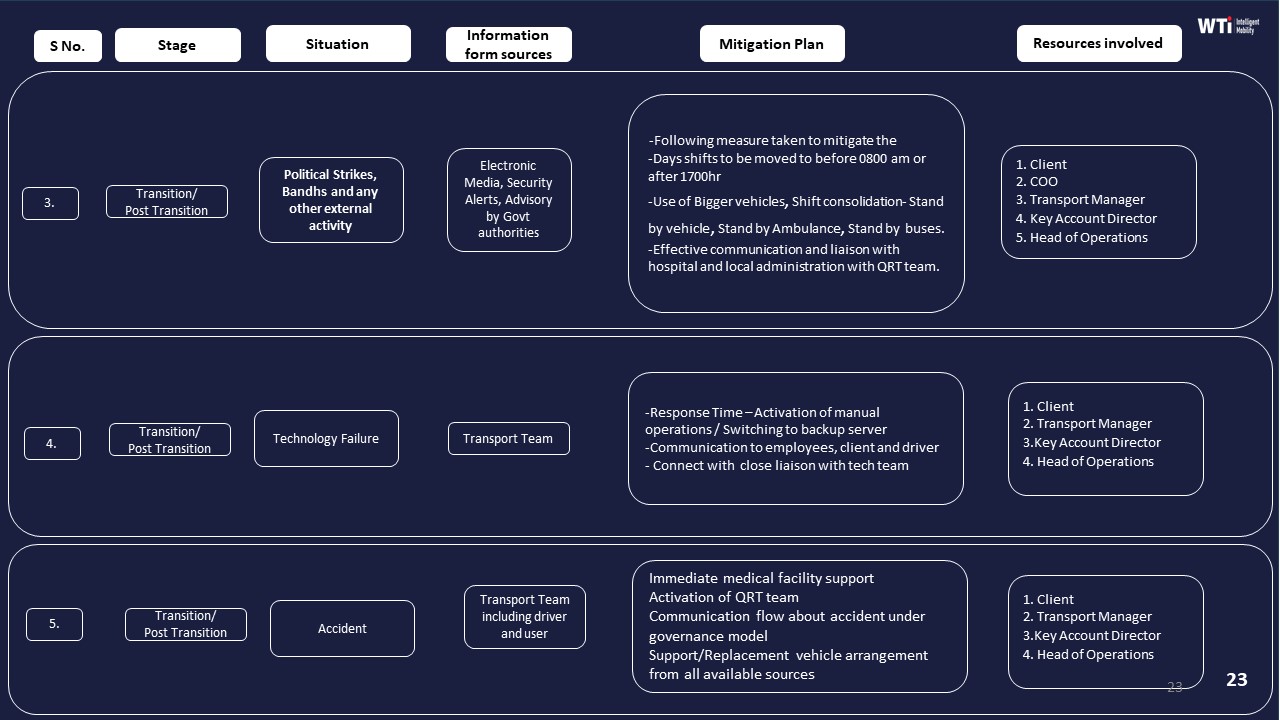
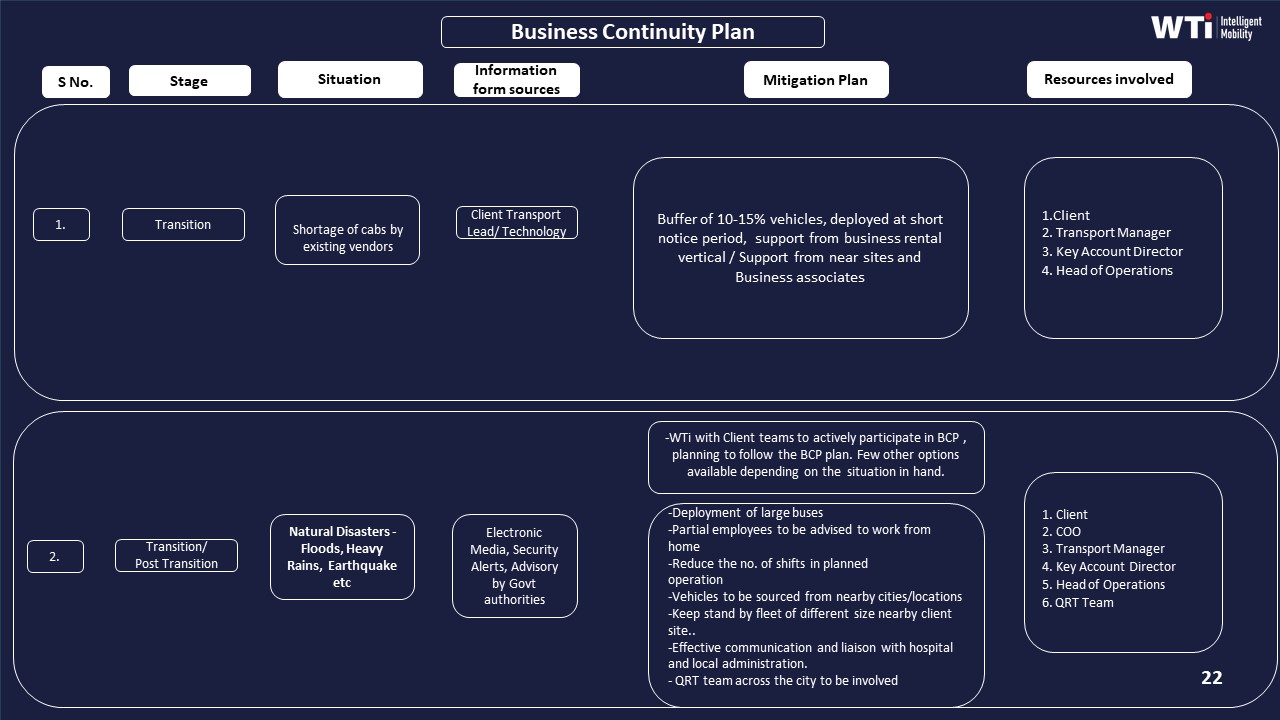
Contingency routing is anchored in formal Business Continuity Plans. These plans define buffers of standby vehicles, alternate vendors, and playbooks for monsoon disruption, political strikes, technology failures, cab shortages, and natural disasters. They rely on data-driven insights, dynamic route optimization, and management of on-time service delivery using traffic trend analysis and coordination with local authorities. Escalation matrices connect location-specific command centers to a centralized governance layer, ensuring issues move quickly from front-line supervisors to key account managers and risk owners, with audit-ready incident and billing trails.
Why does partner density in smaller cities matter so much for reliable commute ops, and what are the common failure patterns when tier-2 coverage is thin?
B1373 Why partner density affects reliability — In India corporate Employee Mobility Services (EMS), why does regional partner density matter for operational reliability, and what failure patterns typically show up when tier-2 coverage is weak (for example, driver no-shows, GPS black spots, or lack of spare vehicles)?
Regional partner density in Indian Employee Mobility Services directly improves operational reliability because denser local supply creates buffers for disruptions, faster response options, and better familiarity with local constraints. When coverage in tier‑2 and tier‑3 locations is thin, daily operations become brittle, escalation rates rise, and the Facility / Transport Head is forced into manual firefighting instead of running a predictable, SOP-driven command room.
Low partner density reduces available standby vehicles and replacement drivers, so even minor disruptions turn into missed pickups and cascading route delays. Weak local presence also limits on-ground supervision, which undermines compliance audits, women-safety protocols, and HSSE enforcement in night shifts. Sparse supply chains make it harder to sustain EV uptime, maintain charging infrastructure, and keep fleet fitness under Motor Vehicles rules in remote or industrial clusters.
Typical failure patterns when tier‑2 coverage is weak include recurring driver no‑shows and late reporting, poor adherence to shift windows, and frequent last-minute trip cancellations. Command centers see more GPS black spots and routing blind zones because vendors have inconsistent telematics and weaker integration in those regions. Lack of spare vehicles and escorts leads to broken escort policies, unsafe ad‑hoc routing, and inability to meet 98%+ OTP expectations during weather, political events, or local festivals. Billing and SLA governance also degrade because fragmented vendors cannot maintain consistent data, trip logs, and audit-ready evidence across all sites.
From an HR safety point of view, how do we check if the vendor can truly support women’s night shifts in tier-2 cities where on-ground supervision and escalation can be slower?
B1374 Tier-2 support for women’s safety — In India corporate Employee Mobility Services (EMS), how should a CHRO evaluate whether a vendor’s tier-2 support model can actually protect women’s night-shift safety requirements when the city has limited on-ground supervisors and slower escalation reach?
A CHRO should treat a vendor’s tier-2 support model as credible for women’s night-shift safety only if it converts distance and low supervisor density into fast, auditable control-room responses backed by clear SOPs, not field heroics. The vendor must prove that its centralized command center can detect risk automatically, escalate within strict time limits, and coordinate drivers, security, and local authorities even when no supervisor is physically nearby.
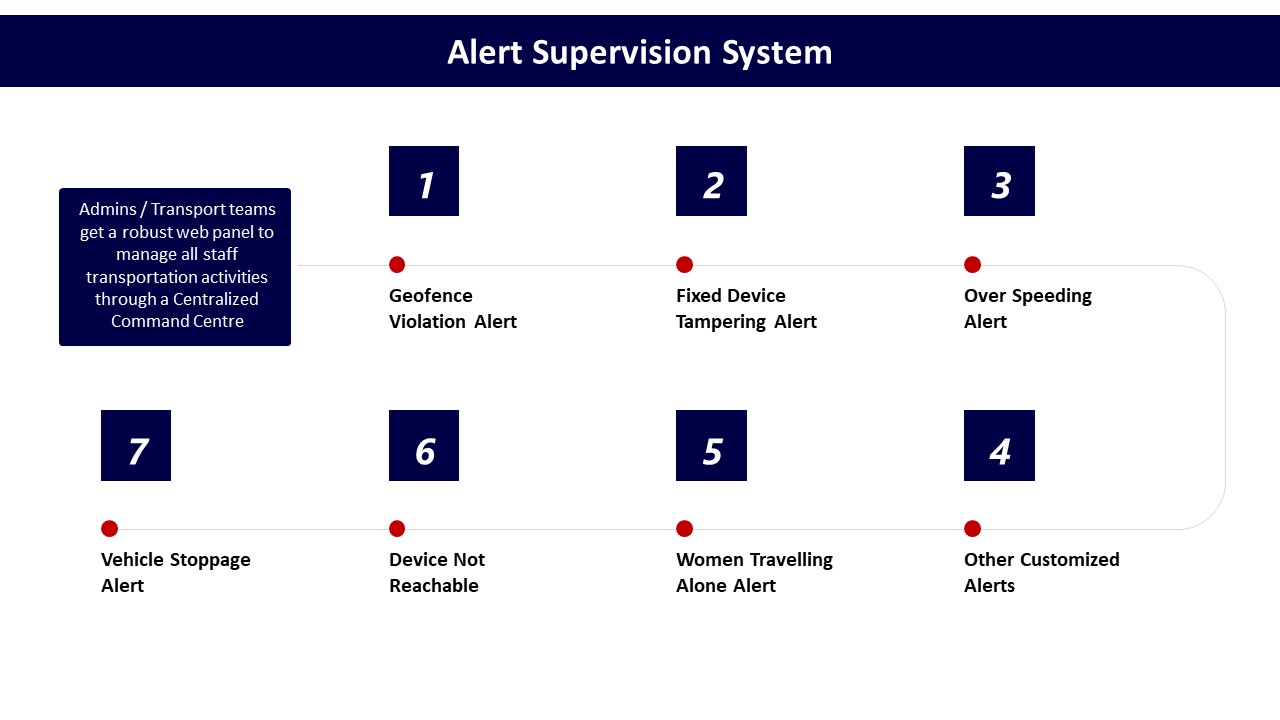
The critical test is whether women-safety controls are “by design” in the EMS stack. This includes geo-fencing of routes, real-time trip monitoring, panic/SOS flows linked to a 24/7 command center, and alert supervision systems for overspeeding, device tampering, or geofence violations. A weak model relies on individual supervisors picking up calls. A stronger model uses continuous telemetry and predefined escalation matrices that work the same way in metro and tier-2/3 locations.
A CHRO should ask for evidence that the vendor’s command center and safety stack already handle low-supervisor geographies. This includes women-centric safety protocols, SOS control panels integrated with employee apps, driver background screening depth, and centralized compliance dashboards for driver and fleet credentials. It also includes business continuity and contingency plans that specify what happens during political strikes, tech failures, or natural disruptions when escalation reach is slower.
Key evaluation checks for tier-2 support in women’s night-shift safety include:
• Escalation architecture. Is there a 24/7 central command center with defined first-response SLAs for SOS, geofence breaches, and route deviations in cities with limited on-ground staff?
• Women-centric design. Are there dedicated women’s safety cells, women-centric safety protocols, and home-safety features such as “safe reach home” confirmations and call-masked communication for solo women riders?
• Automation over manual supervision. Does the vendor rely on automatic alerts from an alert supervision system, panic/SOS APIs, and geofence violations rather than only phone calls to supervisors and drivers?
• Evidence and auditability. Can the vendor show actual incident logs, response-time metrics, and audit trails from comparable night-shift programs, not just policy slides?
• Driver and fleet quality. How deep are driver compliance checks, POSH and gender-sensitivity training, and recurring safety refreshers, given that in thinly supervised cities the driver is effectively the first line of safety?
• Business continuity in weak-coverage cities. Do their business continuity plans explicitly cover remote locations with buffer vehicles, backup tech, and alternate escalation channels when standard reach is delayed?
If a vendor cannot show codified SOPs, real-time monitoring, and auditable incident closure from its command center, then limited on-ground supervisors will translate into slow, inconsistent protection for women’s night shifts. A credible tier-2 support model replaces physical proximity with reliable, automated detection and tightly governed remote response.
What are the telltale signs a vendor is overstating tier-2 coverage (shared fleets, too few supervisors, ‘spares’ only on paper), and how can Procurement verify it before awarding?
B1375 Detecting inflated tier-2 coverage claims — In India corporate Employee Mobility Services (EMS), what are practical indicators that a regional coverage claim is inflated—like shared fleets, thin supervision ratios, or spares that exist only in contracts—and how can Procurement verify this during evaluation?
In Indian Employee Mobility Services, inflated regional coverage claims usually show up as weak on-ground capacity, shallow governance, and inconsistent evidence across technology, fleet, and people. Procurement can detect this by stress-testing vendor claims against verifiable artifacts such as command-center operations, business continuity plans, fleet compliance processes, and client references tied to specific locations.
Vendors often overstate coverage when they rely on loosely governed aggregators rather than a true fleet aggregator model. A common failure mode is “shared fleets” presented as dedicated EMS capacity without clear fleet tagging, uptime commitments, or dead mileage thresholds. Thin supervision ratios appear when a vendor claims to run multi-city EMS with no documented regional hubs, no escalation matrix, and only a skeletal transport command centre instead of a 24x7 integrated mobility command framework. Spares that exist only on paper are signalled by business continuity plans that mention buffers but lack supporting deployment playbooks, vendor partner SLAs, or route adherence audit mechanisms.
Procurement teams can verify coverage by demanding city-wise capacity maps, vehicle utilization index reports, and vendor governance frameworks that show how multi-region consistency is maintained. Proof of real operations usually includes a functioning command centre with defined exception-management SLAs, an escalation mechanism and matrix aligned to OTP and safety KPIs, and indicative transition plans that demonstrate how vendors mobilize fleets in new locations. Evaluation should also include location-specific client references, observable EV or ICE operations in comparable cities, and inspection of centralized compliance management records for vehicles and drivers in those regions.
Practical checks during evaluation can include:
• Matching claimed cities against current EV or EMS operation maps and client rosters.
• Asking for real sample dashboards from NOC/command centers with OTP%, TAR, and incident logs per region.
• Reviewing business continuity plans and project planners to see how spares, standby cars, and multi-hub command models are actually activated during strikes, monsoon disruptions, or technology failures.
In tier-2 cities, what minimum on-ground supervision and escalation staffing should we expect for night shifts and shift-change peaks so we stop the 3 a.m. breakdowns?
B1377 Minimum supervision for night shifts — In India corporate Employee Mobility Services (EMS), what minimum on-ground supervisor coverage and escalation staffing should be expected in tier-2 cities for night shifts and peak shift-change windows to avoid 3 a.m. breakdowns?
In Indian corporate Employee Mobility Services, most organizations should expect at least one dedicated on‑ground transport supervisor per tier‑2 city site during night shifts, plus a small, clearly staffed escalation layer that is actively reachable during peak shift‑change windows. Operations are more stable when this local layer is backed by a 24/7 centralized command center that monitors trips, safety alerts, and exceptions in real time and drives escalations through a defined matrix.
A common failure mode in tier‑2 cities is relying only on a vendor call center or drivers after 10 p.m., with no local decision‑maker who can reroute vehicles, replace a no‑show driver, or coordinate with security in minutes. Real control usually needs two layers. The first layer is the on‑ground supervisor or location‑specific command center, which handles roster execution, driver reporting, vehicle readiness, and immediate incident response at the site. The second layer is the central command center or transport command centre, which provides continuous monitoring, alert supervision, and enforcement of safety, compliance, and SLA governance across locations.
Staffing should reflect the risk window rather than just total volume. Peak shift‑change windows and women‑heavy night shifts require a supervisor who is not multitasking with other facility responsibilities and who has clear SOPs, escalation contacts, and authority to deploy standby cabs or alter routes. Escalation coverage should include named duty managers on a rotating roster, supported by a documented escalation mechanism and matrix that define who picks up which type of issue, within what response time, and with what decision rights.
images:
How do we check if ‘spare vehicles’ in tier-2 cities are real—right vehicle types, fast response, nearby depots—instead of a vague promise?
B1378 Verifying spare vehicle reality — In India corporate Employee Mobility Services (EMS), how can an operations leader evaluate spares availability in tier-2 locations in a way that reflects reality—vehicle type match, response time, and distance to depot—rather than a generic ‘backup vehicle’ promise?
An operations leader can evaluate spares availability realistically by converting “backup vehicle” claims into measurable, shift-wise coverage metrics for specific vehicle types, time-to-dispatch, and actual distance from parked spares to key sites. The evaluation must be based on verifiable data such as tagged spare vehicles, geo-located depots, and historical response times, rather than vendor declarations.
A practical approach is to insist that vendors disclose their spare fleet map for each tier-2 city. Each spare vehicle should be tagged in the fleet management or command-center system with its vehicle type, regular duty pattern, and whether it is a true standby or double-counted in regular routes. A common failure mode is when vendors mark peak-duty vehicles as “spares,” which collapses at first disruption.
Operations leaders should demand historic response-time data for breakdowns and no-shows by shift band, mapped against distance from depot to client gate. This reveals real coverage when weather, political events, or technology failures occur, which are typical risks captured in business continuity and contingency plans. Strong vendors in EMS contexts usually have defined buffers, multi-vendor aggregation, and a documented business continuity playbook that includes pre-positioned spares and escalation paths.
Key checks include:
• Vehicle-type match: Number of spare sedans/MUVs/EVs by location and shift band.
• Response time: Median and 95th percentile dispatch-to-arrival times for past incidents.
• Distance to depot: Maximum and average road distance from spare parking hubs to client sites.
• Conflict of use: Evidence that standby units are not routinely used to cover base demand.
This evaluation reduces night-shift firefighting and aligns EMS reliability with realistic, auditable spares capacity instead of generic backup assurances.
From an IT angle, how do we check if tier-2 operations will fail because of weak connectivity or unstable apps, and what offline/manual fallbacks must exist?
B1382 Tier-2 resilience under low connectivity — In India corporate Employee Mobility Services (EMS), how can a CIO evaluate whether tier-2 support will break down due to poor connectivity or app instability, and what operational fallbacks (offline processes, manual manifests, phone-based escalation) should be non-negotiable?
In India EMS environments, a CIO should treat tier‑2 support robustness as a connectivity‑stress problem and insist on clearly defined offline SOPs for booking, dispatch, tracking, and escalation. A CIO should only sign off when there is evidence that operations can run safely and auditable even when apps, GPS, or data links are degraded.
A CIO can evaluate breakdown risk by asking for live demonstrations and playbooks under failure scenarios. The CIO should examine how the vendor behaves when GPS drops, when the driver app cannot sync, or when the NOC loses connectivity. The CIO should also review the presence of a 24x7 command center, escalation matrices, and documented business continuity plans that cover political strikes, technology failures, and natural disruptions. Proof of alert supervision systems, centralized dashboards, and command center micro‑functioning indicates maturity in incident detection and handling.
Non‑negotiable fallbacks include manual rostering and routing procedures that can be executed from a control room using phone and SMS, paper or offline manifests for drivers with passenger details and contact numbers, and OTP or sign‑off mechanisms that can be reconciled later for audit and billing. Phone‑based escalation paths to a transport command centre and location‑specific command centres should be documented with clear roles and response SLAs. Business continuity plans must define buffers such as standby vehicles, alternate vendors, and manual reporting templates so OTP, women’s safety protocols, and compliance are maintained even when technology degrades.
When we add new tier-2 locations, what checklist should Procurement use to confirm readiness—local partners, supervision, spares, and backup routes—before we lock a pan-India rate card?
B1390 Tier-2 readiness checklist for expansion — In India corporate Employee Mobility Services (EMS), when expanding to new tier-2 sites, what due-diligence checklist should Procurement use to confirm local readiness—partner onboarding speed, supervisor coverage, spares, and contingency routing—before signing a pan-India rate card?
A procurement team expanding Employee Mobility Services into new tier‑2 sites should use a due‑diligence checklist that validates on‑ground execution capacity, not just pricing. The checklist should test local partner onboarding speed, supervisor and command‑center coverage, spare fleet buffers, and contingency routing playbooks before any pan‑India rate card is signed.
A strong checklist in India EMS typically probes how quickly vendors can induct compliant fleet and drivers in a new city, and whether they follow structured onboarding processes for fleet, drivers, and supervisors with documented checks and training. Procurement should verify the presence of local or regional command centers, clear escalation matrices, and daily shift‑wise briefings to ensure that night shifts and peak windows are actively supervised rather than monitored passively.
Readiness checks should include evidence of spare vehicles and standby buffers for cab shortages, along with documented Business Continuity Plans that cover political strikes, technology failures, natural disasters, and cab shortfalls. Contingency routing capability can be validated through case studies on adverse weather, traffic disruptions, or monsoon management that show maintained on‑time performance in difficult conditions.
Before locking a pan‑India rate card, procurement should insist on sample management dashboards, alert supervision systems, and data‑driven insights reports to confirm that local operations can be observed centrally through a 24x7 command‑center model. Procurement should also confirm vendor governance structures, including team structure in the new city, vendor and statutory compliance processes, and clear Business Continuity and HSSE roles and responsibilities, so that commercial rates are tied to a verifiable operating model, not assumptions about future scalability.
How do we separate basic day-shift coverage from true 24x7 tier-2 support, and what questions quickly expose night-shift gaps before go-live?
B1393 Day shift vs 24x7 tier-2 support — In India corporate Employee Mobility Services (EMS), how can a buyer distinguish between ‘coverage’ for day shifts versus true 24x7 tier-2 support for night shifts, and what questions expose gaps before go-live?
In Indian Employee Mobility Services, true 24x7 tier‑2 night‑shift support is defined by a staffed command center, documented BCP, and measurable on‑time performance for night operations. Day‑shift “coverage” usually means office‑hours coordination with limited escalation depth and no tested playbooks for 2 a.m. failures.
Most providers claim 24x7, but gaps appear around who actually monitors trips at night, what happens when apps or GPS fail, and whether there is surplus fleet and backup vendors during night bands. Buyers can use evidence from business continuity plans, alert supervision systems, and command‑center workflows to validate these claims before go‑live.
Key questions that expose gaps before contracting or pilot launch include:
- Command center and people
- “Show the night‑shift roster for your command center. How many staff are on duty between 9 p.m.–6 a.m., and what are their roles?”
- “Who is my single escalation contact at tier‑2 between midnight and 5 a.m., and what is their decision authority?”
-
“Share your escalation matrix and SLA for response and resolution of night‑shift incidents.”
-
Monitoring, alerts, and fallbacks
- “What real‑time alerts do you run at night (over‑speeding, geofence violation, device tamper, SOS), and who watches them?”
- “When GPS or the app fails mid‑trip at 2 a.m., what is the documented SOP and how is the trip tracked and closed?”
-
“Show sample reports from your alert supervision system: how many night‑band alerts last month, and closure times?”
-
Fleet, driver, and BCP readiness
- “What buffer fleet is reserved specifically for night shifts, and how is it dispatched during spikes or breakdowns?”
- “Share your business continuity plan for cab shortages, political strikes, heavy rain, or tech outages during night shifts.”
-
“How do you manage driver fatigue and rotations for night duty, and how is this monitored?”
-
Safety, women‑centric protocols, and audits
- “Walk through your women‑centric safety protocols for night shifts, including SOS flows, safe‑drop rules, and escort compliance.”
- “Show an actual incident log and RCA for a night‑shift safety or delay incident, with timestamps and actions taken.”
-
“How often are random route audits or safety inspections conducted at night, and can we see sample audit reports?”
-
Integration, manual overrides, and go‑live tests
- “If HRMS or roster integration fails at night, how do you operate manually without losing control or audit trails?”
- “Describe a dry‑run plan: how will we simulate a night‑shift launch week with controlled test routes and escalations?”
- “What are the go/no‑go criteria you commit to (OTP%, incident handling, app uptime) before full night‑shift rollout?”
These questions force providers to show rosters, SOPs, logs, and BCP artifacts rather than verbal assurances. They help a facility or transport head secure predictable night operations, reduce escalations, and avoid being the person everyone calls when things break at 2 a.m.
images:
For a tier-2 site rollout, what should the local admin set up on day one—contact tree, escalation drill, spares map—so employees don’t face chaos?
B1395 Tier-2 rollout day-one essentials — In India corporate Employee Mobility Services (EMS), what should a site admin in a tier-2 city do differently on day one of transition—local contact trees, escalation drills, spares mapping—so the new program doesn’t create chaos for employees?
On day one of an EMS transition in a tier‑2 city, a site admin should treat the shift like a controlled go‑live of a plant, not “just a new vendor start.” The site admin should lock down local contact trees, escalation paths, and backup capacity before the first shift rolls, so drivers and employees are never guessing who is in charge when something breaks.
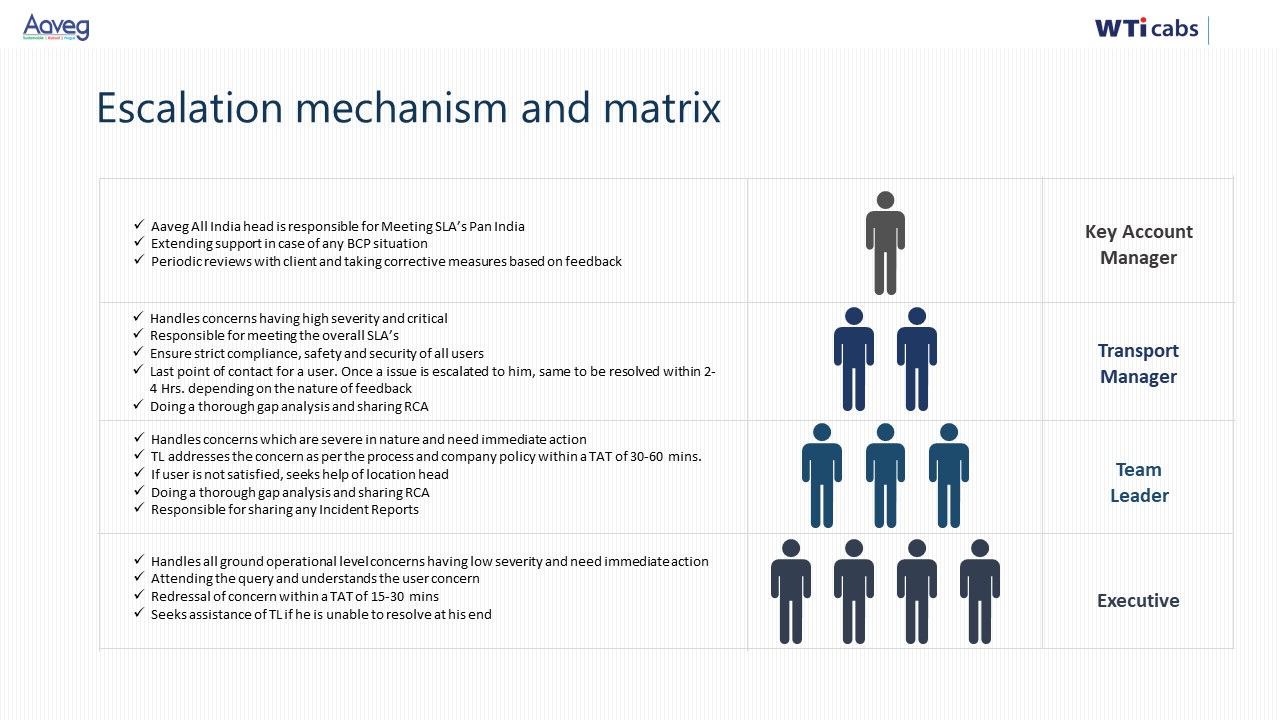
The most reliable transitions start with a clear local command structure. The site admin should publish a simple contact tree by timeband that includes the vendor’s city lead, routing desk, on‑ground supervisors, security, and HR. Each level in this tree should have specific responsibilities, aligned to an escalation matrix similar to the ones described in the “Escalation mechanism and matrix” collateral. This prevents confusion when a cab is late, a GPS device fails, or a woman employee raises a safety concern during a night shift.
The second non‑negotiable is a dry‑run plus escalation drill before day one. The site admin should run at least one mock shift using the new ETS operation cycle, including rostering, routing, app notifications, vehicle tracking, and shift report closure. During this drill, they should test the alert supervision system, SOS flows, and command‑center response, mirroring the alert logic shown in the “Alert Supervision System” and “Transport Command Centre” materials.
The third priority is mapping local spares and buffers. The site admin should agree on minimum standby vehicles, backup drivers, and alternates for key routes, anchored in a business continuity mindset like that shown in the “Business Continuity Plan” collaterals. These standbys should be tagged in the routing and command‑center tools so that when a vehicle breaks down or a driver drops off, the system and NOC can swap them in without manual chaos.
To keep day one calm instead of chaotic, the site admin can anchor on four practical checks:
- Publish and explain the local contact tree and escalation ladder to security, HR, and helpdesk.
- Run a full operational drill, including incident and SOS escalation, before the first live night shift.
- Physically verify standby vehicles, drivers, and critical routes, and tag them in the routing and tracking system.
- Align reporting: agree what “day one success” looks like in OTP, safety incidents, and complaint closure, and make sure the command‑center dashboard can show it.
For our employee transport, how can we tell if late pickups are happening because the vendor lacks Tier-2 coverage, or because our roster/route planning is the issue?
B1396 Diagnose Tier-2 coverage gaps — In India corporate Employee Mobility Services (EMS), how do we diagnose whether our current vendor’s regional coverage and Tier-2 city support are the real root cause of repeated late pickups and missed drops, versus our own shift rosters and route plans?
In Indian Employee Mobility Services, organizations can separate vendor coverage gaps from internal roster or routing issues by comparing where and when failures occur against fleet availability, Tier-2 city presence, and route design data for the same shifts. The root cause is typically vendor coverage if late pickups cluster in geographies or timebands where the vendor has thin presence or no rapid scale-up model, and it is typically internal planning if the same fleet performs well under better-structured rosters and realistic route plans.
A common failure pattern for vendor coverage is repeated OTP issues in Tier-2 or remote pockets where the vendor lacks a solid supply chain, buffers, or on-ground supervision. Another strong indicator is when emergency or peak-hour requirements cannot be served despite confirmed bookings, because the vendor’s fleet aggregation and command-center operations are optimized only for metro cores. Most operations heads see this as drivers coming from far-away hubs, high dead mileage, or frequent last-minute vehicle substitutions.
Internal shift or route problems usually show as unrealistic roster timings, frequent last-minute headcount changes, and routes that violate basic shift windowing or dead-mile caps. If OTP improves significantly whenever rosters are frozen earlier, seat-fill is optimized, and routing is recalibrated for traffic and monsoon conditions, then planning rather than coverage is the primary constraint. Centralized command-center data, including OTP%, Trip Adherence Rate, and vehicle utilization, helps correlate delays with specific rosters and route decisions.
Practically, transport heads can run three checks:
• Compare OTP and missed drops across cities where the vendor has proven operations versus new or Tier-2 locations.
• Overlay late trips on a map of vendor fleet hubs and buffers to see if coverage or dead mileage is driving delays.
• Run a controlled “clean roster” week with frozen headcounts and optimized routes to see if performance lifts materially with the same vendor fleet.
If OTP remains poor even with clean rosters and optimized routes in specific Tier-2 clusters, the regional coverage model is likely the constraint. If performance becomes stable under disciplined planning, the primary root cause sits inside shift roster practices and routing assumptions rather than vendor footprint.
What are the real signs a mobility vendor actually has strong Tier-2 coverage—supervisors on the ground, drivers at odd hours, and backup vehicles—beyond what they say in the pitch?
B1397 Verify true partner density — For India corporate ground transportation EMS, what are the practical indicators that a mobility partner has true partner density in Tier-2 cities (not just a sales claim), including on-ground supervisors, driver availability by timeband, and access to spares?
For corporate EMS in India, true partner density in Tier‑2 cities shows up in shift coverage, on‑ground presence, and recovery speed, not in marketing maps. A reliable mobility partner demonstrates verifiable branch operations, timeband‑wise vehicle and driver availability, and the ability to source spares and backup vehicles locally without breaking SLAs.
A strong indicator is a visible, staffed local command or control desk that runs daily shift briefings and real‑time supervision. Collateral that highlights “Location Specific Command Centres” alongside a Central Command Centre, as well as images of daily shift‑wise briefings and a defined team structure with local routers and pickup/drop coordinators, signals that the partner is not running Tier‑2 operations purely from a metro. True density also reflects in business continuity plans and project planners that explicitly mention city‑wise manpower deployment, local escalation matrices, and contingency playbooks for strikes, tech failures, or cab shortages.
On partner density, organizations should expect timeband‑wise data, such as driver and vehicle allocation for night shifts and early‑morning shifts, and evidence of achieved on‑time performance near 98% under adverse conditions like monsoons. Fleet and driver compliance artifacts, including local onboarding processes, driver training and rewards programs, and standardized safety inspection checklists, prove that there are enough vetted drivers in each city to rotate, rest, and replace without last‑minute scrambling.
Access to spares and recovery capacity is best judged by how quickly the partner can replace a failed vehicle or device in a Tier‑2 location. Evidence includes fleet compliance and induction processes, vehicle deployment and quality‑assurance flows, and business continuity plans that mention buffer vehicles, associated businesses for surge support, and defined mitigation steps during transitions. Centralized compliance management and a transport command centre only translate to real Tier‑2 resilience when backed by documented infrastructure requirements per branch and local vendor and statutory compliance frameworks that are actively audited, not just signed once.
For night shifts, what kind of on-ground supervision in Tier-2 cities really cuts down 2 a.m. escalations, and what breaks when it’s only monitored remotely?
B1398 Night-shift supervision model — In India corporate Employee Mobility Services (EMS) with night shifts, what minimum on-ground supervision model in Tier-2 locations actually reduces 2 a.m. escalations—site supervisor, roaming supervisor, or hub-and-spoke coverage—and what failure modes show up when supervision is purely remote?
In Tier-2 India locations with night-shift EMS, the minimum on-ground model that consistently reduces 2 a.m. escalations is a small hub-and-spoke setup anchored by at least one local supervisor at the main hub, supported by roaming supervision for outer spokes. Purely remote supervision usually fails once there are multiple shift windows, multiple vendors, or any women-night-shift volumes.
A hub-and-spoke model works because a local hub supervisor can handle driver no-shows, last-minute roster changes, and vehicle swaps in real time. Roaming supervisors can then cover high-risk spokes such as industrial clusters or areas with weak vendor depth. This pattern aligns with Transport Command Centre (TCC) governance, local command centres, and daily shift-wise briefings described in the collateral, which all assume some physical presence to turn NOC alerts into concrete action.
Purely remote supervision tends to fail in predictable ways. Vendor behaviour becomes opaque, so cab shortages, fatigue issues, and non-compliant replacement vehicles are only discovered after employees complain. Driver discipline and safety standards drift because there is no local enforcement of fleet and driver compliance, checklists, and HSSE culture. Night incidents escalate because remote teams cannot manage on-ground coordination with police, hospitals, or site security.
Failure modes also show up in routing and timing. Without on-ground eyes, dynamic route optimization and “98% on-time” plans are undermined by local traffic patterns, weather, and infrastructure disruptions that are visible to drivers but not properly surfaced to a remote-only NOC. Remote teams struggle to maintain women-centric safety protocols and escort compliance in late-night shifts, and they cannot run consistent pre-shift briefings or RNR-based discipline.
For a Facility / Transport Head, reliable control usually needs three things that remote-only models do not provide:
- A clearly identified local hub supervisor with authority over vehicles, drivers, and last-minute routing changes.
- Roaming supervisors or dedicated night marshals for high-risk routes and clusters.
- A remote command centre or TCC that focuses on alerts, dashboards, and escalation matrices, but is not the only line of control.
When these elements are absent, 2 a.m. escalations rise, OTP and safety SLA adherence drift, and the operations team bears the blame despite having no physical levers to pull.
How can HR properly test Tier-2 coverage for women’s night-shift safety—escorts, escalation, incident response—so we aren’t exposed if something happens?
B1399 Women-safety coverage pressure test — For India corporate ground transportation EMS, how should an HR head pressure-test Tier-2 city coverage for women’s night-shift safety protocols (escort availability, escalation reach, and incident response), so HR is not left holding the blame after an incident?
An HR head should pressure-test Tier-2 women’s night-shift safety by demanding evidence of end-to-end control: escort and driver compliance, live command-center observability, and a documented incident playbook with audit-ready proof. HR should not accept generic “we are compliant” claims but insist on concrete Tier-2–specific SOPs, staffing rosters, and past performance data before going live.
HR leaders are usually held emotionally accountable after an incident, so the objective is to move from trust-based assurances to verifiable controls. In Employee Mobility Services, safety-by-design means driver KYC and women-safety protocols embedded in routing, real-time tracking via a central command center, and SLA-bound incident response, not ad-hoc phone calls. Tier-2 cities often have fragmented supply and weaker supervision, so HR needs to check how escort rules and night routing are enforced when local vendor capacity is thin.
A practical pressure-test sequence is:
- Ask for the night-shift operating model in Tier-2
- Demand a written EMS SOP for Tier-2 night operations that shows how escort rules, shift windowing, and route approvals are handled.
- Check if there is a 24x7 centralized command center plus a local control desk, or only a vendor contact number.
- Verify how many dedicated night controllers and on-ground supervisors are actually staffed for those cities.
- Validate escort and driver compliance mechanisms
- Review the driver KYC and background-check process, including cadence for renewals and women-first policy adherence for night shifts.
- Ask how escort allocation is controlled by the routing engine and how exceptions are blocked or escalated.
- Check if route manifests, escort presence, and trip OTPs are captured in a tamper-evident trip ledger.
- Probe real-time observability and escalation reach
- Confirm that all Tier-2 trips are visible live in a central NOC with geo-fencing, SOS alerts, and deviation notifications.
- Ask to see the actual escalation matrix for a Tier-2 incident, with names, roles, and response SLAs.
- Pressure-test with scenarios: “Female employee drops last at 1:30 a.m., vehicle deviates 3 km from route; what happens in 5, 10, and 30 minutes, and who calls whom?”
- Examine incident response and audit trail quality
- Request anonymized incident case files from Tier-2 cities showing detection time, escalation path, closure time, and actions taken.
- Check whether panic/SOS events, calls, and GPS trails are stored with audit trail integrity for later investigations.
- Ensure there is a documented incident response SOP that aligns with internal EHS and labour/OSH obligations.
- Link safety assurances to contracts and governance
- Embed escort rules, OTP%, incident closure SLAs, and route adherence into the EMS contract with penalties and right to audit.
- Insist on quarterly safety reviews for Tier-2 locations with HR, Security/EHS, and the vendor’s command-center leadership.
- Require data access for HR and Security to run their own random route audits and spot checks.
If these tests surface gaps, HR should delay or phase Tier-2 night-shift rollouts until the operator can prove command-center readiness, escort capacity, and incident-response discipline. This shifts HR’s position from “we trusted the vendor” to “we demanded and verified controls,” reducing blame risk after any future incident.
For executive travel and airport pickups, how do we check if Tier-2 and airport coverage is strong enough to handle flight delays and last-minute changes without failures?
B1400 Executive CRD Tier-2 readiness — In India corporate Corporate Car Rental / business travel (CRD), how do we evaluate whether a vendor’s Tier-2 and airport-adjacent coverage is sufficient to protect executive punctuality when flights are delayed and pickups shift at short notice?
In corporate car rental for business travel in India, executive punctuality near Tier-2 cities and airports is protected when a vendor can prove standby capacity, real-time flight-linked dispatch, and 24/7 command-center control for short-notice changes. Evaluation must focus on operational buffers, not just coverage maps or city lists.
Vendors with strong airport-adjacent capability usually demonstrate an on-ground fleet buffer, centralized command center monitoring, and SLA-bound airport tracking with response playbooks for delays and reschedules. A weak vendor only “services” a Tier-2 location through distant vehicles or sub-vendors, which increases dead mileage, no-show risk, and escalation frequency when flights shift unexpectedly.
Evaluation should prioritize verifiable evidence over claims. Transport heads and travel desks should ask for live or recent examples of delayed flights handled in Tier-2 locations, examine on-time performance near airports, and review escalation matrices and business continuity plans for cab shortages, tech downtime, and weather or political disruptions. Centralized dashboards and alert systems, such as those described for command centers and alert supervision, are useful signals of real observability and control.
Key evaluation checks include:
- Proven airport SLA: flight-linked tracking, clear response times for delay, diversion, and reschedule scenarios.
- Local buffer and standby: documented standby vehicles and on-ground supervisors at airport-adjacent and Tier-2 hubs.
- 24/7 command center: real-time monitoring, alerting, and decision-making for missed connections and late-night arrivals.
- Contingency and BCP: written playbooks for cab shortages, strikes, weather, and tech failures, with defined responsibilities.
- Data-backed performance: OTP percentages, exception-closure times, and client testimonials for airport and Tier-2 operations.
Vendors that combine a wide operational footprint, such as multi-city and Tier-2 presence, with centralized compliance, safety, and business continuity frameworks offer stronger protection for executive punctuality when flight timings are volatile.
What’s a quick but reliable way to test Tier-2 coverage before signing—pilot the worst shifts, do supervisor call checks, and verify spare vehicles—without dragging it out for months?
B1404 Fast Tier-2 validation method — In India corporate EMS, what is the fastest and most reliable way to validate Tier-2 city coverage before award—like a controlled pilot on worst timebands, random supervisor call checks, and proof of spares—without turning it into a months-long program?
The fastest reliable way to validate Tier‑2 EMS coverage in India is to run a tightly scoped, 2–3 week “stress‑test pilot” in 1–2 representative locations, focused on worst timebands, with pre‑agreed OTP, safety, and escalation KPIs, and to back it with hard evidence of local fleet, drivers, and command‑center observability. A short, controlled pilot gives Transport Heads real on‑ground proof without slipping into a full transition program.
A practical pattern is to mirror how vendors already run rapid EV and project deployments. Vendors in this space demonstrate Tier‑2 capability through rapid fleet mobilization for events, project commute programs, and EV rollouts, supported by command centers, alert supervision systems, and daily shift‑wise briefings. The same structures can be reused for a focused Tier‑2 EMS validation, instead of designing something new and heavy.
Operations leaders can compress validation by bounding scope very clearly. They can pick one or two high‑risk timebands, such as night or early‑morning shifts, and 20–50 employees per site. They can demand real‑time command‑center visibility into these trips, with alerts on geofence violations, over‑speeding, and SOS readiness, and insist that the vendor routes, tracks, and closes trips through their existing EMS/Commutr stack. This keeps the exercise small but realistic.
To avoid a months‑long program, organizations can lock a simple validation checklist up front. Typical checks include: live OTP/route‑adherence reports from the command center, physical proof of spare vehicles and vetted drivers in that Tier‑2 city, working escalation matrices and BCP playbooks for tech failures or strikes, and basic women‑safety controls like SOS, driver compliance, and route audits. The same pilot can also give quick reads on employee satisfaction and local vendor responsiveness, which usually matter more at 2 a.m. than slideware.
images:
For long-term rentals in Tier-2 cities, how do we check if the vendor can support maintenance and give a replacement fast enough to avoid downtime when a vehicle goes off-road?
B1410 LTR replacement reach in Tier-2 — In India corporate Long-Term Rental (LTR) fleets operating in Tier-2 cities, how do we evaluate whether the vendor’s local service network and replacement vehicle reach is strong enough to avoid plant-down or sales downtime when a dedicated vehicle goes off-road?
In India Tier-2 city LTR fleets, the vendor’s local service network is “strong enough” when a single vehicle going off-road does not disrupt plant operations or sales commitments because buffer capacity, replacement SLAs, and on-ground support are already in place and auditable. The practical test is whether the vendor can demonstrate quantified uptime, clear replacement timelines, and real examples of handling breakdowns without missing client SLAs.
A common failure mode is treating LTR as a pure leasing decision and ignoring operational uptime. Most organizations look only at monthly rental and vehicle model but under-specify replacement coverage, local workshop depth, driver availability, and escalation paths. This creates plant-down or missed customer visits whenever a dedicated car is in accident, repair, or compliance hold, especially in Tier-2 locations where alternate supply is thin and informal.
To avoid downtime, organizations should evaluate the LTR vendor on four concrete dimensions during RFP and site due diligence:
- Local fleet depth and buffer policy. Check actual fleet count in the city and surrounding districts, the number of similar-category vehicles tagged as standby, and written rules for deploying them against LTR breakdowns or accidents.
- Replacement SLA and evidence. Ask for written SLAs for replacement vehicle deployment by time-band and geography, plus past data on fleet uptime and SLA breach rate for similar Tier-2 clients in project or long-term rental environments.
- Workshop and driver network. Verify local authorized workshops, preventive maintenance schedules, and availability of trained, compliant drivers who can be swapped in without re-onboarding delays.
- Command-center visibility and escalation. Ensure there is a 24x7 command or transport desk, with real-time GPS and incident tracking, escalation matrices, and business continuity playbooks that define what happens when multiple vehicles go off-road simultaneously.
Vendors with structured business continuity plans, centralized compliance management, and established project or employee mobility operations in multiple Tier-2 and Tier-3 cities are usually better positioned to protect against plant or sales downtime in LTR fleets, because they already run buffer fleets, have trained driver pools, and operate command-center based monitoring and escalation.
images:
In the first few weeks in Tier-2 cities, what early red flags should we watch—missed check-ins, slow replacements, no one reachable—that mean we’ll be firefighting again soon?
B1416 Early rollout red flags Tier-2 — In India corporate EMS, what are the ‘red flag’ behaviors during early rollout in Tier-2 cities—missed supervisor check-ins, delayed replacements, unreachable escalation contacts—that indicate we will be back to daily firefighting within weeks?
The most reliable early red flags in a Tier‑2 EMS rollout are any behaviors that break basic control-room hygiene. When supervisors go silent, replacements take hours instead of minutes, and escalation numbers do not pick up, the operation is already drifting toward daily firefighting.
One major signal is weak command-center discipline. Missed shift briefings, supervisors not logging handovers, or no real-time view of roster vs. actual trips show that NOC operations and escalation matrices exist only on paper. In Tier‑2 cities this often combines with patchy GPS or app downtime, so any reluctance to fall back to pre-agreed manual SOPs is a clear warning.
A second signal is unreliable bench strength and replacement readiness. If vendor partners argue about providing standby cabs, take more than 30–45 minutes to replace a breakdown, or blame “local market shortages” every night, fleet uptime and OTP will degrade quickly. Frequent last-minute vehicle swaps without updated details to employees indicate loose vehicle and driver compliance management.
A third signal is ineffective response channels. If the Alert Supervision or Transport Command Centre is formally “24/7” but calls go unanswered, tickets remain open across shifts, or the same incidents repeat without visible RCA, escalation governance is already failing. Safety alerts, women-safety protocols, and SOS events that generate no rapid callbacks are especially serious red flags, because they show that compliance and HSSE frameworks are not embedded in daily operations.
Further signals include inconsistent daily shift-wise briefings for drivers, poor adherence to Business Continuity Plans when local disruptions occur, and early resistance to audits or data sharing for dashboards and management reports. These patterns usually precede rising no-shows, falling OTP, and mounting complaints that force the Facility / Transport Head back into reactive mode every night.
For our shift transport in tier-2 cities, how do we check if a vendor has enough local partners, on-ground supervisors, and backup vehicles so service doesn’t break when one partner fails?
B1424 Tier-2 coverage readiness check — In India-based Employee Mobility Services (EMS) for shift commute, how should a facilities/transport head evaluate a vendor’s regional coverage in tier-2 cities—specifically partner density, on-ground supervisors, and spare vehicle availability—so night-shift operations don’t collapse when one local fleet partner fails?
A facilities or transport head should evaluate a vendor’s tier‑2 regional coverage by stress‑testing three things in advance. The three things are partner density in each city, the depth of on‑ground supervision, and the practical spare‑vehicle buffer that can be deployed at night without fresh approvals. Operations remain stable during a local partner failure only when these elements are quantified, contractually defined, and visible via a command‑center dashboard.
Vendors should be asked to provide a mapped partner network by city, including number of active fleet partners, total vehicles tagged to EMS, and the share of volume handled by the top one or two partners. Concentration risk is high when one supplier carries most of the load. A higher number of smaller partners is useful only if they are already integrated with the command center, trip lifecycle, billing, and centralized compliance management.
On‑ground supervision should be checked for each city. The transport head should verify whether there is a dedicated local control desk, how many supervisors or pickup‑and‑drop coordinators are deployed at night, and how these teams connect into the centralized transport command centre and alert supervision system for incident handling and rerouting.
Spare vehicle availability should be treated as a formal buffer policy, not an informal promise. The vendor should define a minimum standby fleet ratio, the location of standby cabs relative to major hubs, and the playbook used in their business continuity plans for cab shortages, political strikes, or technology failures. It is useful to align this with the vendor’s broader business continuity plan and command‑centre escalation matrix, so that a single‑partner failure automatically triggers predefined rerouting, vendor substitution, and standby deployment rather than ad‑hoc firefighting.
images:
What are the warning signs that a vendor’s tier-2 coverage is just on-paper and they don’t really have supervisors and backup cabs to manage nightly issues?
B1425 Detecting paper-only coverage — In India corporate ground transportation for Employee Mobility Services (EMS), what are the practical red flags that a vendor’s tier-2 city coverage is ‘paper coverage’ (subcontracted on demand) rather than real on-ground capability with supervisors and spares that can handle nightly exceptions?
In Indian Employee Mobility Services, “paper coverage” in tier-2 cities usually shows up as weak night-shift control, inconsistent OTP, and no visible local governance when exceptions hit. Real on-ground capability is marked by named supervisors, standby cabs, and a functioning local control-desk that can handle nightly breakdowns without pushing everything back to the HQ city.
A common red flag is when the vendor cannot share a clear local operating model for that city. Vendors with only subcontracted on-demand fleets usually have no city-wise command-center footprint, no documented ETS operation cycle locally, and no dedicated project / event control desks for peaks or emergencies. Operations often depend on the subcontractor’s retail taxi logic rather than an EMS-grade, shift-windowed roster and routing process.
Another red flag is fragmented visibility. If the same NOC tools, GPS tracking, and alert supervision system are not consistently available in the tier-2 city, then the command center is blind during incidents. On-ground fleets that are not inducted through the same centralized compliance management and fleet/driver induction frameworks usually lack uniform driver KYC, women-safety readiness, and HSSE discipline, which increases risk on night shifts.
Procurement and transport heads can also test for commercial and continuity gaps. Paper coverage often relies on ad-hoc CRD or spot-rental models, with no buffers for dead mileage, no spare vehicles, and no documented business continuity plan for cab shortages, local strikes, or tech failures. In these cases, outcome-linked KPIs like OTP%, trip adherence, and incident closure times in that city are either unavailable or not broken out separately, which hides the true reliability of tier-2 operations.
- Ask for city-specific team structure and escalation matrix.
- Verify local fleet and driver compliance induction records.
- Check if the central command center actively monitors that city in real time.
- Demand city-wise OTP, incident, and SLA reports for the last 3–6 months.
For night-shift safety in tier-2 cities, how do we check if the vendor can escalate fast—supervisor response time, local coordination, and immediate backup vehicles?
B1428 Tier-2 women-safety escalation readiness — In India Employee Mobility Services (EMS) for night shifts, how should a security/EHS lead evaluate whether a vendor’s tier-2 city escalation reach is sufficient for women-safety incidents—considering on-ground supervisor response time, police liaison readiness, and backup vehicle availability?
A security or EHS lead should treat “tier‑2 escalation reach” as a time‑bound, evidence‑backed capability. The vendor must prove that in each tier‑2 city they can: dispatch an on‑ground supervisor fast, engage local police without delay, and replace a vehicle quickly enough to keep the woman employee safe and visible throughout the incident lifecycle.
The first filter is on‑ground response time. A security lead should ask for city‑wise SOPs that define maximum response times for supervisors and escort resources. The vendor should show contactable duty rosters, escalation matrices, and proof of 24/7 command‑center monitoring with SOS alerts, geo-fencing, and trip-level audit trails. Case studies that demonstrate 98%+ on-time performance in adverse conditions and documented night‑shift safety playbooks are strong signals of maturity.
Police liaison readiness is a separate dimension. A robust vendor maintains pre‑established coordination with local authorities, documented in business continuity plans and safety frameworks. The security lead should see written SOPs for when and how the vendor escalates to police, how incident tickets flow from SOS panels to command centers, and how they preserve evidence using GPS logs and driver compliance records.
Backup vehicle availability is about buffers and supply-chain depth. In tier‑2 cities, the vendor should prove buffer fleet planning, standby car policies, and clear replacement SLAs. Structured business continuity plans that address cab shortages, political strikes, and technology failures indicate resilience.
A practical evaluation checklist can include:
• City-wise supervisor on-call lists with defined response SLAs.
• Evidence of a 24/7 transport command center monitoring SOS and deviations.
• Documented police liaison SOPs and prior incident handling examples.
• Written BCPs covering cab shortages, strikes, and tech downtime for tier‑2 cities.
• Data-backed performance reports on OTP, incident closures, and women-safety protocols.
This approach keeps evaluation grounded in measurable response capability rather than generic “pan‑India presence” claims.
How do we run a tier-2 pilot that really exposes gaps in supervisors, backup vehicles, and escalation—rather than just having one smooth week and getting fooled?
B1435 Designing a revealing tier-2 pilot — In India Employee Mobility Services (EMS), what’s the simplest way to run a tier-2 city pilot that actually surfaces on-ground support gaps (supervisor availability, spares, escalation reach) instead of producing a misleading ‘smooth week’ result?
In Indian Employee Mobility Services, the simplest way to run a tier‑2 city pilot that exposes support gaps is to design a “stress-test” pilot rather than a showcase week, by deliberately mirroring real shift complexity, edge cases, and incident scenarios over at least one full roster cycle. A pilot that includes night shifts, hybrid attendance variability, and pre-planned disruptions will surface weaknesses in supervisor depth, spare capacity, and escalation discipline that a clean, limited-hour trial will hide.
A stress-test pilot works when it copies the production ETS Operation Cycle in miniature. This means using the full booking→rostering→routing→vendor distribution→tracking→shift report→billing flow instead of an ad‑hoc manual workaround. It also means insisting on real command-center style oversight using the kind of alert supervision, safety protocols, and escalation matrix shown in the command centre and Alert Supervision System collaterals. A common failure mode is letting the vendor bypass their own tech stack and SOPs “just for the trial,” which removes the very signals that would show whether their NOC, driver app, and fleet dashboards hold under load.
The pilot should be scoped to intentionally cover:
- At least one full week with nights, weekends, and peak shifts to reveal supervisor coverage gaps and driver fatigue issues.
- Simulated or expected disruptions, such as heavy rain or political events, to test Business Continuity Plan responses and spare-vehicle buffers.
- Women-centric late shifts to pressure-test safety controls, SOS workflows, and compliance with women-centric safety protocols.
- End-to-end billing and MIS for the pilot period to check alignment between trip logs, GPS data, and invoicing flows.
Transport heads should define pilot success metrics around OTP%, escalation response time, incident closure quality, and how quickly the vendor stabilizes after a disruption. A pilot that triggers the vendor’s Business Continuity Plan, command centre micro‑functioning, and driver management routines will reveal whether they can sustain real tier‑2 operations without constant firefighting from the client.
In tier-2 cities, what should an on-ground supervisor actually do—pickup-point presence, driver replacement, incident notes, and escalations—and what should be formally owned?
B1438 Defining on-ground supervisor scope — In India Employee Mobility Services (EMS), what does ‘on-ground supervisor’ actually mean in tier-2 support, and what responsibilities should be formally owned (attendance at pickup points, driver substitutions, incident documentation, escalation coordination)?
In India Employee Mobility Services, an “on-ground supervisor” in tier‑2 support is the field operations owner for a shift or cluster of routes. The on-ground supervisor converts command-center instructions and vendor commitments into real-world execution at pickup points, in vehicles, and during incidents.
The on-ground supervisor typically owns physical presence and verification at key points. The supervisor validates that vehicles arrive at pickup points as per roster and that employees are boarded safely and on time. The supervisor supports shift windowing, route adherence, and real-time coordination with drivers when traffic or weather disruptions appear.
The on-ground supervisor also owns immediate driver substitutions and fleet changes. The supervisor arranges replacement vehicles or drivers when there is a no-show, breakdown, or driver fatigue issue. The supervisor aligns with routing decisions taken by the command center and ensures dead mileage and delays are minimized.
The on-ground supervisor is responsible for first-line incident documentation. The supervisor records what happened, when, who was affected, and which vehicle and driver were involved. The supervisor captures statements and supporting evidence that can feed compliance dashboards, EHS audits, and HR investigations.
The on-ground supervisor coordinates structured escalation across stakeholders. The supervisor informs the centralized command center, HR, security or EHS, and vendors according to agreed escalation matrices. The supervisor tracks closure actions and provides on-ground confirmation for SLA and safety compliance.
Key responsibilities that should be explicitly written into SOPs and role descriptions include: - Physical attendance or managed presence at critical pickup points during high-risk shifts. - Real-time driver and vehicle substitution decisions within defined authority limits. - Structured incident logging with time-stamped, auditable records for every exception. - Escalation and coordination with command centers and safety stakeholders until resolution.
What standards should we set for backup cabs in tier-2 cities—where they’re kept, how fast they reach, and what’s an acceptable substitute—so service doesn’t break last minute?
B1439 Setting tier-2 spares standards — In India Employee Mobility Services (EMS), how should a facilities/transport manager set ‘spares availability’ standards for tier-2 cities (where to stage spares, how fast to deploy, what counts as an acceptable substitute vehicle) to avoid last-minute service breakdowns?
In India Employee Mobility Services, facilities and transport managers should set spares availability standards for tier‑2 cities by defining a minimum standby fleet buffer, clear staging locations, and time‑bound deployment SLAs, and by pre‑agreeing what vehicle substitutions are acceptable for each shift type. The standards need to be written into SOPs and vendor SLAs so that command‑center teams can trigger backups before a breakdown becomes a missed pickup.
Spares should be staged where failure risk and response time matter most. In practice, managers often define a buffer of additional vehicles in the Business Continuity Plan and position them near key industrial zones, tech parks, or shift hubs rather than at a single garage. Buffer vehicles reduce the impact of vehicle shortages, accidents, and political or weather disruptions, and are most effective when tied to an escalation matrix and a dual command‑center model that provides both centralized supervision and local response.
Deployment speed should be governed by explicit “time‑to‑replace” targets linked to on‑time performance. Business continuity plans in this context specify mitigation actions for cab shortages, natural disasters, and technology failures, and they work best when spare capacity is tagged in the routing and dispatch system, visible on a centralized dashboard, and supported by 24/7 alert supervision.
Acceptable substitute vehicles should be defined per route category, not improvised during incidents. For example, a sedan can substitute for another sedan on a regular day shift, but women‑centric late‑night routes or high‑occupancy shuttles may require equivalent or higher‑safety configurations with all compliance and safety features intact. Centralized compliance management and fleet induction frameworks help ensure that any spare deployed—whether EV or ICE—is already vetted for statutory documentation, safety equipment, and driver training, so that substitutions protect reliability without compromising safety or audit readiness.
How do we verify the vendor can keep the same service and escalation discipline in tier-2 cities as they do in big metros, and not downgrade quality outside the top cities?
B1440 Consistency across metros and tier-2 — In India corporate ground transportation (EMS/CRD), how can a buyer check whether a vendor can maintain the same escalation reach and spares discipline across metros and tier-2 cities, rather than delivering ‘A-grade’ operations only in Bengaluru/Delhi and ‘C-grade’ elsewhere?
In corporate ground transportation in India, a buyer can test whether a vendor will maintain the same escalation reach and spares discipline across metros and tier‑2 cities by demanding location-wise evidence of command-center coverage, escalation matrices, and fleet/compliance readiness instead of accepting a single “national” story. A reliable vendor shows that its Business Continuity Plans, command-center operations, and vehicle/driver compliance processes work identically in every city, not just in one flagship metro.
A common failure mode is vendors showcasing a premium setup in Bengaluru or Delhi while relying on thin local partners elsewhere without the same Business Continuity Plan, Alert Supervision System, or Transport Command Centre coverage. This breaks escalation discipline, increases exception-closure time, and creates different grades of service. Buyers should therefore insist on city-wise proof of command-center integration, including how alerts, SOS triggers, and geofence violations are handled from metros to tier‑2 hubs, and verify that the same escalation mechanism and matrix applies across all locations.
In practice, buyers can apply a few concrete checks before and during contracting:
- Ask for city-wise escalation matrices with named roles and 24/7 reachability and verify that the Managed Service Provider governance structure and dual-command centre model are not limited to a single flagship city.
- Review Business Continuity Plans and contingency slides for specific scenarios such as political strikes, technology failures, monsoon disruptions, and cab shortages, and confirm that mitigation steps and backup capacity (buffer vehicles, associated businesses support) exist for each proposed city.
- Demand evidence of centralized compliance management and fleet/driver induction processes and require sample compliance dashboards and audit logs from at least one metro and one tier‑2 city to ensure uniform “maker & checker” checks and document currency.
- Inspect the Transport Command Centre design and command-centre micro-functioning, and confirm that tier‑2 traffic is monitored on the same single-window dashboard, with the same SLA for incident detection and closure, as metro operations.
- Use case studies and management reports to check whether performance KPIs such as On-Time Performance, fleet uptime, and safety incidents are reported by location, not only aggregated nationally, and tie payment or penalties to these city-specific KPIs.
These tests give the Facility / Transport Head and Procurement a defendable basis to distinguish vendors who can genuinely replicate A‑grade operations across the network from those who depend on fragmented, uneven local arrangements.
images:
images:
For executive airport pickups from tier-2 cities, how do we check the vendor has enough local partners, backup cars, and escalation support so we don’t miss high-visibility trips?
B1445 Tier-2 executive airport reliability — In India corporate car rental services (CRD) for executive airport transfers that originate in tier-2 cities, how should an admin/travel desk assess local coverage depth (partner density, backup cars, and escalation reach) to avoid high-visibility misses that damage leadership trust?
In corporate car rental services for executive airport transfers from tier-2 Indian cities, an admin or travel desk should treat local coverage depth as an operational risk metric and verify it with hard, city-specific evidence rather than generic “pan-India” claims. Local partner density, backup fleet availability, and a working escalation chain must all be validated before routing CXO or leadership travel through that vendor.
The most reliable vendors in this space usually demonstrate a structured, multi-layer model. They show a local team structure and escalation matrix that covers roles from ground coordinators up to a key account manager. They back this with a documented command centre or Transport Command Centre that operates 24/7 and monitors trips in real time across locations. Admin teams should ask for the actual escalation mechanism, response SLAs, and examples of how night or early-morning airport failures were handled in similar tier-2 locations.
For coverage depth in tier-2 cities, admin teams should expect clear visibility into how many vehicles and partners are tagged for that city, how standby vehicles are planned, and what business continuity plans exist for shortages, strikes, natural disruptions, or technology failures. A credible provider often maintains buffer fleets, leverages associated businesses in emergencies, and uses macro-level transition or project planners to show how fleet is mobilized and rebalanced across multiple cities.
Practical assessment questions for admin or travel desks include:
- How many active vehicles and partner vendors are dedicated to this city and airport corridor.
- What is the documented BCP for cab shortages, local disruptions, or system downtime.
- How does the centralized command centre monitor these trips and trigger standbys or manual overrides when apps or GPS fail.
- What is the escalation path and guaranteed response time if a CXO car has not reported at T-45 minutes to pickup.
A vendor that can answer these questions with city-wise fleet maps, business continuity plans, and real escalation matrices gives the travel desk a defensible basis for trusting them with high-visibility leadership transfers rather than relying on generic brand assurances.
What should be on a tier-2 go-live readiness checklist—partner onboarding, supervisor staffing, backup cab tagging, escalation testing, and contingency routing sign-off?
B1449 Tier-2 go-live readiness checklist — In India Employee Mobility Services (EMS), how should a buyer structure a ‘tier-2 readiness’ checklist for go-live that covers partner onboarding completeness, supervisor staffing, spare vehicle tagging, escalation ladder testing, and contingency routing sign-off?
A tier-2 EMS site in India is “go‑live ready” only when the buyer can evidence that partner onboarding, on-ground staffing, spare capacity, escalations, and backup routing are all validated in advance through a single, auditable checklist. The checklist must be structured as a control-room tool, not a PPT—each item should be binary (Pass/Blocker) with named owners and timestamps.
1. Partner onboarding completeness
Buyers should first verify that vendor and vehicle onboarding is fully compliant and logged.
- Vendor contracts are executed with clear SLAs, penalty logic, and business continuity clauses.
- Driver and fleet compliance is completed with documented checks, including background verification, license and PSV validation, health and training records, and vehicle fitness and statutory documents.
- Centralized compliance management is configured with maker–checker workflows and expiry alerts for all driver and vehicle documents.
- Technology access is provisioned, with driver, vendor, admin, and employee apps onboarded and tested for roster, routing, SOS, and tracking.
2. Supervisor staffing and command readiness
Second, the buyer should confirm that supervisors and command-center roles are staffed and trained to tier-2 volumes.
- Team structure is documented with named supervisors, routers, transport desk staff, and command-center operators, mapped to shifts.
- Daily shift-wise briefing routines are defined and rehearsed for route changes, weather, and safety reminders.
- Command-center micro-functioning is defined, including monitoring dashboards, alert supervision, and HSSE responsibilities.
- Training and induction for supervisors covers SOPs, escalation matrices, safety and compliance requirements, and use of dashboards and apps.
3. Spare vehicle tagging and capacity buffers
Third, the checklist should capture spare fleet strategy and tagging for breakdowns and peaks.
- Spare vehicles are pre-tagged in the system with assigned drivers, compliance cleared, and clearly distinguished from primary fleet.
- Business continuity plans define buffer percentages and sourcing paths for shortages, natural events, and political disruptions.
- Vehicle deployment and quality assurance processes for both primary and spare vehicles are documented, including pre-induction checks and safety inspection checklists.
4. Escalation ladder testing
Fourth, escalation mechanisms must be tested in realistic scenarios before go‑live.
- An escalation matrix is finalized from ground staff to key account manager, security, and leadership with response SLAs.
- Alert supervision systems for geofence violations, tampering, overspeeding, and SOS are configured to trigger the correct escalation levels.
- Tabletop drills are run for night-shift delays, safety incidents, and system downtime to validate that calls, tickets, and dashboards follow the defined ladder.
5. Contingency routing and continuity sign-off
Finally, continuity and alternate routing must be explicitly signed off for tier-2 conditions.
- Monsoon, festival, and local disturbance playbooks are documented, using dynamic route optimization and traffic trend analysis for minimum on-time performance.
- Business continuity plans for strikes, technology failures, and disasters include manual operations, backup tools, and coordination with local authorities.
- Contingency routes and stop-points are reviewed and signed off jointly by transport, security/EHS, and vendor, with command center visibility.
- The transport command centre’s role as auditor and facilitator is acknowledged, with outcome metrics and management reports aligned to OTP, safety, and exception closure.
How do we check if the vendor can reliably service remote tier-2 pickup points like industrial outskirts, where backups and supervisors are not nearby?
B1451 Servicing remote tier-2 pickup points — In India Employee Mobility Services (EMS) for multi-site operations, how should an operations leader evaluate the vendor’s ability to ‘reach’ remote tier-2 pickup points—like industrial outskirts—where spare vehicles and supervisors may be far away?
In India EMS for multi-site operations, an operations leader should evaluate “remote reach” by stress-testing the vendor’s supply chain depth, escalation playbooks, and command-center visibility specifically for tier‑2 and industrial-outskirt routes, not just their city coverage map. A capable vendor shows verifiable buffer capacity, local-ground support, and defined SOPs for breakdowns and no-shows in hard-to-serve pockets.
A common failure mode is judging reach by number of cities served or app features. Operations leaders need to probe how the vendor mobilizes actual vehicles, drivers, and supervisors when a cab breaks down 20 km outside town during a night shift. Vendors that only aggregate urban fleets often struggle with fleet uptime, fatigue management, and SLA adherence once routes extend into remote industrial clusters.
The evaluation should focus on a few concrete checks.
- Verify fleet depth and tagging by corridor, not just by city. Ask how many vehicles are mapped, on average, to each industrial belt, and what standby/buffer is committed in the contract.
- Review the Business Continuity Plan and emergency playbooks for cab shortage, political strikes, technology failures, and bad-weather scenarios, and check who takes ownership at 2 a.m. for an outskirt pickup.
- Check the team structure and local supervision footprint. Confirm whether there are on-ground supervisors or location-specific command centers for key plants or SEZs, and what their response time is to reach a stuck vehicle.
- Inspect the command-center tooling for remote routes. Ensure real-time GPS, alert supervision (overspeeding, geofence violations, device tampering), and escalation matrices are in place, and that these cover remote corridors as rigorously as city routes.
- Assess vendor and fleet compliance rigor. Strong driver onboarding, training, and fatigue controls reduce breakdowns and safety incidents, which are much harder to manage far from city hubs.
- Ask for case studies or MIS from similar geographies that show OTP%, incident response time, and fleet uptime for remote or weather-exposed operations.
Operations leaders should favor vendors that combine centralized command centers, data-driven routing and monitoring, and a documented field structure of drivers, supervisors, and backup fleets tuned to rural and industrial peripheries. This mix reduces firefighting, keeps OTP stable, and prevents outskirt failures from escalating to senior leadership.
escalation governance, ownership, and accountability
Define clear escalation ladders, on-ground ownership, and control-room routines to prevent ping-pong and ensure rapid, authorised responses.
How do we evaluate tier-2 escalation reach—who answers at night, what the escalation ladder is, and what can actually be fixed remotely vs needing someone on-ground?
B1380 Assessing escalation reach in tier-2 — In India corporate Employee Mobility Services (EMS), how should a buyer assess escalation reach in tier-2 cities—who answers at night, what the escalation ladder is, and what actions are possible remotely versus requiring on-ground intervention?
In Indian corporate Employee Mobility Services, buyers should assess escalation reach in tier‑2 cities by demanding a clearly documented 24x7 command‑center model, a named escalation ladder with response SLAs, and evidence of what the vendor can actually resolve remotely versus what needs on‑ground intervention. Buyers should treat “who answers the phone at 2 a.m.” as a hard evaluation criterion, not an informal assumption.
A strong vendor shows a Transport Command Centre or centralized command center that runs 24/7 and supervises all locations in real time. The command center typically manages GPS tracking, geo‑fence and overspeed alerts, SOS triggers, and incident tickets using tools like an Alert Supervision System and an SOS control panel. This remote layer should have clear SOPs for triage, communication with drivers and employees, and coordination with client security or HR for safety‑related cases.
Escalation reach in tier‑2 cities is best assessed through a documented escalation matrix that names roles at each level, from on‑ground supervisors to key account managers. A credible ladder defines time‑bound response commitments, when issues are handled by the centralized team, and when they are pushed to local command centres or site‑specific coordinators. Buyers should verify that there is a local operations and driver ecosystem in those cities, supported by business continuity and contingency plans for technology failures, strikes, or cab shortages.
Remote actions usually include route re‑planning, re‑assigning trips, notifying replacement vehicles, triggering SOS workflows, and communicating with employees. On‑ground actions include escort deployment, physical incident response, vehicle substitution where there is a breakdown, and coordination with local authorities during disruptions. During evaluation, buyers should ask for recent case examples, confirm coverage hours and languages at the command center, and check that escalation and response steps appear in standard operating procedures used for daily shift‑wise briefings and safety protocols.
What can a centralized NOC realistically solve remotely, and what still needs local tier-2 supervisors—and how should we put that into SLAs?
B1385 NOC vs on-ground responsibility split — In India corporate Employee Mobility Services (EMS), what’s the realistic boundary between a centralized NOC fixing issues remotely and what still requires local tier-2 on-ground supervisors, and how should that be reflected in SLAs?
In India EMS operations, a centralized NOC should own all telemetry‑driven monitoring, routing changes, and escalation coordination, while local tier‑2 supervisors should own any issue that involves physical presence, human judgement at the site, or multi-party coordination on the ground. SLAs should therefore distinguish between “detect and direct” response targets for the NOC and “reach and resolve” targets for on‑ground supervisors, with separate time commitments and accountability.
A centralized NOC works best for real-time observability, routing and capacity decisions, and governance. The NOC can monitor OTP, trip adherence, and route deviations using telematics and driver/rider apps, and it can trigger dynamic route recalibration in response to traffic, weather, or hybrid-work attendance volatility. The NOC is also suited to manage SOS workflows, incident logging, escalation matrices, and SLA reporting, because these depend on command-center tooling, audit trails, and data integration with HRMS and security systems rather than physical presence.
Local tier‑2 supervisors are essential where remote control ends and physical reality begins. This includes driver absenteeism handling at specific hubs, last-minute fleet substitution, on-site crowd movement for shift changes or events, and physical safety checks such as vehicle spot-audits or on-ground verification of escort compliance. On-ground supervisors are also required for business continuity actions like rerouting in response to local disruptions, coordinating with local authorities, and implementing project-specific control desks for ECS-type movements.
SLAs should encode this split explicitly through dual layers:
- NOC SLAs for monitoring, alerting, and instruction issuance, such as maximum time to detect a route breach or to dispatch revised routing instructions.
- On-ground SLAs for actual field intervention, such as maximum time for a standby vehicle or supervisor to arrive at a site and close an incident.
Contracts should define which failure modes remain NOC-only, which automatically trigger tier‑2 deployment, and how OTP%, safety incidents, and exception-closure times are jointly attributed. This alignment keeps the Facility/Transport Head in control with early alerts and clear SOPs, without pretending that a command center alone can replace local, accountable supervision.
After go-live, what governance rhythm keeps tier-2 coverage from degrading—partner drop-offs, supervisor attrition, spares readiness—so quality doesn’t slip after Q1?
B1387 Keeping tier-2 coverage strong post-award — In India corporate Employee Mobility Services (EMS), what should a post-award governance cadence look like to keep tier-2 coverage honest over time—partner density drift, supervisor attrition, and spares readiness—so service quality doesn’t quietly degrade after the first quarter?
In Indian Employee Mobility Services, a resilient post-award governance cadence keeps tier‑2 city performance visible every week and auditable every month so that partner density, supervisor strength, and spares buffers cannot quietly erode. The cadence must combine a fixed review rhythm, a minimal KPI set, and explicit checks on partner coverage, people capacity, and standby fleet, anchored in the command center’s live data rather than vendor self-reporting.
Weekly governance works best when it is short and operations-led. Transport and the vendor command center should review OTP, trip adherence, no-show handling, and incident logs for each tier‑2 location. The same review should surface concrete exceptions on driver availability, supervisor presence on ground, and use of standby cabs from the agreed buffer. A common failure pattern is to review only metros in depth. That pattern allows smaller cities to drift on staffing and spares until escalations spike.
Monthly governance should be structured like a lightweight vendor governance framework. Location-wise dashboards can show fleet uptime, vehicle utilization, EV vs ICE mix where relevant, and incident-free shifts, alongside staffing metrics such as supervisor headcount vs plan and driver attrition. This is where density drift and supervisor attrition are most visible. Partner rosters, fleet-compliance logs, and business continuity plans should be sampled, not assumed.
Quarterly governance is where commercial and continuity levers should be tied to outcomes. Outcomes such as OTP%, incident rate, fleet uptime, and complaint closure SLAs can be linked to incentives and penalties. This linkage keeps partners motivated to maintain spare capacity, comply with safety controls, and invest in tier‑2 coverage. A common failure mode is to allow tier‑2 routes to be served mostly by ad‑hoc or low-tier vendors without enforcing original SLA and buffer commitments.
A practical cadence usually includes: - A weekly 30–45 minute tier‑2 operations review using command center dashboards. - A monthly service review per vendor, combining operational KPIs with compliance and safety checks. - A quarterly governance council that reviews partner performance tiers, reallocates lanes, and tests business continuity readiness across locations.
How can HR ops set realistic expectations with business leaders on what strong tier-2 support can and can’t prevent, so HR doesn’t get blamed for every local disruption?
B1388 Setting expectations to protect HR — In India corporate Employee Mobility Services (EMS), how can an HR operations manager set expectations with business unit leaders about what ‘good’ tier-2 support can and cannot prevent, so HR isn’t blamed for every local disruption?
In India corporate Employee Mobility Services, an HR operations manager sets fair expectations by defining tier‑2 support as a governed escalation and recovery layer that reduces impact and duration of disruptions, not a guarantee that disruptions never occur. Good tier‑2 support prevents small issues from becoming safety or reputational incidents, but it cannot eliminate local causes like sudden road blocks, extreme weather, app outages, or vendor-side driver shortages.
Tier‑2 support in EMS is best positioned as a “second line of defence.” It coordinates with the centralized command center, vendors, and security teams. It owns SLA governance, incident logging, and interface with HRMS and business units. It does not own traffic conditions, police barricades, or individual driver behaviour in real time. It reduces risk by enforcing driver and fleet compliance, managing women-safety protocols, and ensuring that every trip has an audit trail.
A common failure mode is when HR promises “no disruptions” instead of “measured, predictable handling of disruptions.” That failure mode leads to unrealistic expectations and blame when local events break routes or schedules. Most organizations benefit when HR shares clear SOPs for what transport, command center, and vendors will do within defined time windows, and what line managers and employees must do when alerts indicate delays.
To keep HR from being blamed for every breakdown, expectations should be framed around four tiers of control:
- Tier‑0: Uncontrollable external events. Examples include sudden road closures, political strikes, flash flooding, or extreme congestion. HR can log and report these, but cannot prevent them. “Good” here means timely alerts, alternate routing attempts, and documented decisions.
- Tier‑1: Vendor and fleet performance. This includes driver availability, vehicle uptime, and adherence to basic SLAs like reporting time. HR can influence this via vendor governance, penalties, and performance reviews, but cannot micro-manage every vehicle. “Good” here means consistent OTP, low incident rate, and action on recurring patterns.
- Tier‑2: Command-center and HR operations. This layer is responsible for rostering rules, escalation matrices, incident SOPs, and NOC visibility. “Good” here means structured escalation within defined minutes, clear communication to affected managers, and closure reports for every major deviation.
- Tier‑3: Business unit behaviour. This covers shift planning, last-minute roster changes, and manager-level cooperation with safety and routing rules. “Good” here means business units locking rosters on time, respecting women-safety routing constraints, and not bypassing approved processes.
In practice, HR operations can protect itself by codifying and sharing three visible artefacts with business unit leaders:
- A service charter that defines what EMS can promise in terms of OTP bands, communication timelines, and incident handling, and what it cannot promise in the face of Tier‑0 events.
- A joint responsibility matrix that clearly assigns who owns routing rules, last-minute roster changes, women-safety compliance, and exception approvals. This matrix should show HR, transport, vendors, and business units on separate rows.
- A standard incident report format that classifies each major disruption by root cause category (external, vendor, process, or BU-driven), documents timestamps from alert to closure, and states what changed in the process to reduce recurrence.
Most organizations that avoid HR blame use data from their command center and EMS platform to show recurring Tier‑0 and Tier‑1 patterns. They track metrics like on-time performance percentage, incident rate, exception closure time, and seat-fill to demonstrate that systemic controls are working. They also log when business units cause avoidable stress, such as late roster uploads or ad hoc shift extensions that break routing windows.
A clear rule of thumb for HR operations managers is to commit to “no unmanaged incidents” rather than “no incidents.” That means every major disruption must be detected, escalated, messaged, and closed with evidence. It also means women-safety rules and statutory compliance must never be relaxed even if business units request exceptions under pressure.
Why do tier-2 escalations keep bouncing between vendor, NOC, and site teams, and how do we redesign ownership so our transport team isn’t overloaded?
B1389 Stopping escalation ping-pong — In India corporate Employee Mobility Services (EMS), what are the most common reasons tier-2 escalations bounce between vendor, NOC, and site teams, and how should escalation ownership be redesigned to reduce cognitive load on the Facilities/Transport Head?
In Indian corporate Employee Mobility Services, tier-2 escalations usually bounce between vendor, NOC, and site teams when ownership is unclear for specific failure types, when data needed for root cause lies in different systems, and when the escalation matrix is role-based instead of incident-type-based. Escalation ownership reduces cognitive load on the Facility/Transport Head when every major failure has a pre-assigned “accountable owner,” clear triage rules in the command center, and time-bound SOPs that run without requiring ad-hoc decisions from the site lead.
Most organizations route any serious issue straight to the Facility/Transport Head. This pattern turns the Facility/Transport Head into a manual router instead of an exception manager. A common failure mode is fragmented responsibility across the vendor operations team, the centralized NOC, and local supervisors. Another frequent cause is incomplete observability in EMS platforms, where GPS, rostering, driver compliance, and HRMS attendance sit in silos, so no single team feels confident to close the loop. Tier-2 issues also bounce when safety, billing, and routing incidents use the same generic escalation path instead of specialized queues.
Escalation ownership improves when it mirrors command center operating models and business continuity playbooks. Each incident class, such as safety, OTP breach, driver or fleet compliance failure, and technology outage, requires a named “control owner” anchored either at the NOC, vendor partner, or security/EHS. The Facility/Transport Head should only own cross-functional prioritization and communication instead of first-line diagnosis.
A practical redesign typically has three layers. The first layer is automated detection and routing in the transport command center, with alert rules tied to OTP%, geo-fence violations, SOS triggers, and app or GPS downtime. The second layer defines single owners for each queue. For example, safety incidents go to security or EHS with NOC support, driver behavior and fatigue issues go to vendor operations, and routing or capacity issues go to the routing desk. The third layer keeps the Facility/Transport Head in a governance role, with dashboards, SLA summaries, and periodic reviews instead of acting as a 24/7 dispatcher. This structure aligns with centralized command-center governance and continuous assurance concepts from mature EMS operations.
images:
How do we check if the vendor’s on-ground supervisors can actually make decisions—replace drivers, reroute, dispatch spares—or if they’re just coordinators needing approvals?
B1391 Do supervisors have real authority? — In India corporate Employee Mobility Services (EMS), how should a Facilities/Transport Head judge whether the vendor’s on-ground supervisors have real decision rights (driver replacement, rerouting, spares dispatch) versus being merely coordinators who still need multiple approvals?
A Facilities or Transport Head should judge supervisor decision rights by what supervisors can authorize in real time without “calling someone else,” especially for driver replacement, rerouting, and spare deployment during live shifts. Real authority shows up as documented SOPs with named thresholds, clear financial limits, and measurable incident-response SLAs that supervisors can execute directly from the command center or field, rather than only escalating.
A common failure mode is vendors presenting “on-ground coordinators” who track trips and update spreadsheets but cannot swap a vehicle, extend duty, or approve a reroute without chasing approvals. This creates hidden latency, more night-shift calls for the client team, and OTP or safety risk during breakdowns, weather events, or driver no-shows.
In practice, decision rights can be assessed through a few concrete checks during evaluation and pilot:
- Ask for written SOPs that define exactly when a supervisor may replace a driver or vehicle, reroute a cab, or dispatch standby fleet, including budgetary caps and escalation thresholds.
- Run scenario drills, especially on night-shift or monsoon use cases, and time how long it takes the vendor supervisor to resolve issues without involving senior management.
- Review escalation matrices and Business Continuity Plans to see whether the first two levels can actually commit assets and take routing decisions, or only “inform and report.”
- Inspect command center tooling and dashboards to confirm supervisors have system permissions to reassign trips, push new routes, and trigger spares, not just monitor GPS and log incidents.
If these checks show supervisors are empowered with codified authority, live tools, and time-bound SLAs for interventions, the Facilities or Transport Head can expect less firefighting and more predictable EMS operations.
How do we write enforceable SLAs for Tier-2 coverage—like minimum spare vehicles, supervisor response time, and escalation—so it doesn’t turn into ‘best effort’ later?
B1402 Write enforceable coverage SLAs — In India corporate EMS across multiple Tier-2 locations, how do we set coverage commitments in the SLA in a way that is enforceable—e.g., minimum spares ratio, supervisor response time, and escalation reach—rather than vague ‘best effort’ language that fails during audits and disputes?
In India corporate EMS across Tier-2 locations, coverage commitments become enforceable only when they are expressed as measurable ratios, time-bounded response targets, and clearly mapped escalation paths, all tied to data sources and audit evidence. Vague terms like “adequate spares” or “best effort response” must be replaced with explicit numeric thresholds, location-wise baselines, and exception-handling rules that survive audits and disputes.
Coverage in Tier-2 EMS operations should be defined against the rostered shift demand per location and timeband. A practical construct is to specify a minimum active-fleet-to-rostered-route ratio and a separate buffer ratio for spare vehicles. This can be expressed as a “minimum spares ratio” per shift window with city-level caps on dead mileage, and supported by duty slips and telematics logs as the audit trail. Tier-2 variability in driver and fleet availability makes this ratio-based method more realistic than a flat “X spare cabs per city” clause.
Supervisor response time and escalation reach must be specified as control-room SLAs within the broader command center operations model. The SLA should define maximum time to acknowledge an alert from the NOC, maximum time to contact the affected employee, and maximum time to provide a workaround such as a replacement vehicle or alternate routing. Each of these steps should reference concrete observability data such as ticketing system timestamps, IVR or call-log records, and trip lifecycle management events.
Escalation reach needs a written escalation matrix that aligns with the buyer’s own governance structure. The SLA should map levels (e.g., duty officer, city supervisor, regional manager, central command center) to specific incident types such as no-show, women’s night-shift deviations, repeated OTP failure, or safety complaints. For each level, it helps to define an escalation trigger, an expected response action, and a closure SLA that flows into the service level compliance index.
Most organizations encode these commitments by linking them to a small set of canonical EMS KPIs. These usually include on-time performance percentage by location and shift window, trip adherence rate, exception detection-to-closure time, and command center alert latency. For Tier-2 coverage, the contract often differentiates day vs night bands and sets higher buffer ratios and stricter supervisor reach SLAs for night-shift women’s safety scenarios, aligning with escort policies and night routing rules.
To ensure enforceability, each SLA term needs four explicit elements. There must be a definition that removes ambiguity, such as what counts as “spare capacity” or “response.” There must be a measurement method that references the routing engine, telematics dashboard, and incident logs. There must be a reporting cadence such as daily NOC summaries and monthly governance reviews. There must also be consequences encoded as incentive and penalty ladders that are proportionate but meaningful.
In practice, disputes often arise where data ownership and observability are weak. A robust SLA therefore names the system of record for each metric, such as the EMS platform, HRMS integration layer, or mobility data lake, and clarifies how data corrections and reconciliations will be managed. This reduces room for disagreement when OTP, coverage gaps, or escalation delays are reviewed in audits, QBRs, or during vendor rebalancing discussions.
images:
When Tier-2 coverage is critical, how should we choose between one national vendor and a multi-partner setup, so Procurement isn’t blamed later if service fails?
B1403 Single vs multi-partner Tier-2 — For India corporate ground transportation EMS, how should Procurement compare a ‘single national vendor’ versus a ‘tiered multi-partner model’ specifically for Tier-2 cities, given the operational risk of thin partner density and the political risk of being blamed for the wrong choice?
For Employee Mobility Services in India, Procurement should treat “single national vendor” versus “tiered multi-partner” as a risk-balancing decision across reliability, governance effort, and blame exposure in Tier-2 cities. A single national vendor reduces contracting complexity and gives clearer accountability, but often hides thin on-ground capacity and concentration risk. A tiered multi-partner model improves resilience and regional fit, but increases governance overhead and makes failures harder to attribute to one counterparty.
In Tier-2 cities, thin partner density magnifies fleet uptime risk, driver attrition, and business continuity vulnerability. A single national EMS provider aligns with Procurement’s desire for standardized SLAs, centralized billing, and simpler audits. It also supports unified command-center visibility, technology integration, and consistent safety/compliance processes across locations. However, if that vendor’s local supply chain is shallow, Procurement inherits high exposure to cab shortages, night-shift disruptions, and EV charging gaps without alternative capacity.
A tiered multi-partner model fits the fragmented supply reality. It allows specialized regional operators, diversified fleet sources, and better contingency options when political events, weather, or vendor-side failures hit Tier-2 clusters. It also aligns with vendor tiering, buffer fleet strategies, and multi-hub command center practices described in business continuity and MSP-governance collateral. The trade-off is that Procurement must invest more in a vendor governance framework, standard contracts, escalation matrices, and centralized compliance monitoring to keep safety, cost per trip, and OTP consistent.
Procurement can de-risk “being blamed for the wrong choice” by framing the selection not as vendor A vs B, but as a governed operating model choice with explicit controls. This means documenting how central command-center oversight, business continuity plans, and centralized compliance dashboards will work across either option, and making OTP, safety incidents, and SLA-breach rates the measurable basis for revisiting the model.
A practical comparison lens for Tier-2 cities is:
- Check real, auditable fleet and driver depth in each Tier-2 city, not just national claims.
- Assess business continuity plans, including standby capacity, cross-support from nearby cities, and political-strike or tech-failure playbooks.
- Require technology and data standards that allow Procurement to re-balance volume across partners later without lock-in.
- Tie commercials to outcome metrics such as OTP%, incident rate, and complaint-closure SLAs instead of just base per-kilometer cost.
This shifts Procurement’s defensibility from “we picked the right brand” to “we set up the right, auditable risk-managed model for Tier-2 EMS operations.”
In real life, why do escalations fail in Tier-2 cities—no one answers, ownership is unclear, no supervisors—and how do we catch this before we go live?
B1407 Find escalation failure modes early — For India corporate EMS in Tier-2 locations, what are the most common reasons escalation chains fail in practice (unreachable vendor managers, unclear ownership between aggregator and fleet partner, lack of on-ground supervisors), and how do we surface those failure modes during evaluation rather than after go-live?
For India corporate EMS in Tier-2 locations, escalation chains usually fail because real accountability is diffused, on-ground supervision is thin, and command-center visibility does not extend into vendor and driver behavior during night and peak shifts. Escalation models work on paper but break in practice when the Transport Head depends on vendor managers who are unreachable, fleet partners who blame aggregators, and local teams that are either understaffed or non-existent.
In Tier‑2 EMS operations, the most frequent failure modes involve weak command-center operations and fragmented vendor governance. Escalation matrices are often defined but not stress-tested against real ETS operation cycles, adverse-weather scenarios, or business continuity events. Aggregator–sub-vendor structures create ambiguity about who owns driver compliance, vehicle readiness, and incident response. This ambiguity undermines the Transport Command Centre, Alert Supervision System, and centralized compliance management, because alerts may be generated but not acted upon fast enough.
These gaps can be surfaced before go‑live only by forcing vendors to expose their operating reality, not just their slides. Buyers should request live demonstrations of the command centre and escalation mechanism during night-shift windows, including mock SOS incidents and geofence violations. Buyers should also insist on speaking directly with location-specific command centre leads and on-ground supervisors in proposed Tier‑2 cities, and should verify team structure, HSSE roles, and Business Continuity Plan specifics for cab shortages, tech failures, and strikes.
A practical evaluation approach includes: - Running a time‑boxed pilot on a Tier‑2 route with full ETS Operation Cycle tracking. - Demanding vendor-written playbooks that link Alert Supervision System triggers to specific response SLAs and named roles. - Reviewing prior Business Continuity Plan execution examples and client references from similar Tier‑2 EMS deployments.
These steps increase the chance that escalation chains are proven under controlled conditions, rather than discovered to be fragile after full-scale deployment.
From an IT angle, what should we check so Tier-2 escalations still work if the app is down or connectivity is poor?
B1409 Escalations during app downtime — For India corporate EMS, what should the IT team ask to ensure Tier-2 escalation workflows work even during app downtime or low connectivity—so the operation doesn’t collapse when the primary system is unavailable?
For India corporate EMS, IT teams should insist on explicit design and test evidence for “graceful degradation” of escalation workflows when apps, network, or primary platforms are down. The core requirement is that Tier‑2 escalation must still trigger, route, and close incidents using alternate channels, with an auditable trail, even if the main system is unavailable.
IT should structure questions around four areas: failure detection, alternate channels, data integrity, and governance. Vendors should be asked how outages are detected in real time, how alerts are generated when NOC tooling or rider/driver apps cannot be reached, and how escalation matrices are activated from the command center during such events. IT should probe whether SMS, voice, or email-based workflows exist as fallbacks when mobile apps or push notifications fail, and whether the centralized command center can manually trigger SOS, geo-fence, or incident escalations without the primary UI.
Data and auditability remain critical in a DPDP and audit-driven environment. IT should ask how offline events are buffered on devices, how trip and incident logs are reconciled into a mobility data lake once connectivity returns, and how audit trail integrity is preserved for command center operations, safety incidents, and SLA breaches. Questions should also cover role-based access, logging of manual interventions, and how Tier‑2 escalation actions are timestamped and attributed for later compliance or EHS review.
To keep operations stable, IT should seek concrete SOPs and test artefacts. These include documented business continuity playbooks for EMS, evidence of periodic drills with the centralized NOC and location hubs, and clear escalation matrices that specify who responds at Tier‑2 when technology is partially unavailable. A common failure mode is relying on platform features without codified command center procedures, which leaves the Facility / Transport Head exposed during night‑shift disruptions.
images:
How should we set up a clear escalation matrix for Tier-2 incidents—who calls whom—so it doesn’t become random WhatsApp chaos at night?
B1411 Build Tier-2 escalation matrix — For India corporate EMS in smaller cities, how should a Transport/Facility Head structure an internal ‘war-room’ escalation matrix (HR, Security, vendor, and site leadership) so Tier-2 incidents don’t turn into uncontrolled WhatsApp chaos?
Transport and Facility Heads reduce WhatsApp chaos by pre-defining a simple, role-based escalation matrix with time-bounded response SLAs, a single command channel, and clear ownership per incident tier. A practical structure assigns Tier-1 to the transport desk, Tier-2 to a local “war-room” led by Transport with HR and Security on-call, and only escalates to site leadership and senior HR when defined thresholds are breached.
The escalation matrix works best when it mirrors how operations actually run in Tier-2 cities. Transport should own the first response and fact-finding, since the Facility / Transport Head already acts as the internal command center. HR should be pulled in only when there is employee distress, repeat complaints, or women-safety implications. Security / EHS should lead whenever there is a safety, incident, or compliance angle, using tools like GPS trails, incident logs, and driver compliance records as evidence. Vendor SPOCs must have explicit SLAs for response and rectification, with clear backup contacts for night shifts in smaller cities.
To prevent uncontrolled WhatsApp escalations, the war-room needs a single official channel for logging and tracking issues. This can be a command-center style dashboard or ticketing log that the Transport Command Centre or local NOC supervises, as shown in WTi’s centralized command and alert supervision collateral. WhatsApp can still be used for quick coordination, but every incident must be captured in the formal log with time, tier, owner, and closure note. Daily or weekly review of this log with HR and site leadership turns random noise into patterns that can be fixed through routing changes, driver retraining, or vendor reallocation.
- Tier-1: Routine delays & no-shows → Transport desk + vendor only, with short SLAs.
- Tier-2: Repeated ETA breaches, app/GPS failure, or employee anxiety → Local war-room (Transport lead, HR and Security on-call).
- Tier-3: Any safety, women-safety, or legal-risk incident → Immediate Security / EHS lead, HR co-lead, and rapid briefing to site leadership using command-center data.
How do we manage the politics when HQ thinks Tier-2 support is fine, but site operations is the one taking 3 a.m. calls because escalation reach is weak?
B1417 HQ vs site politics on coverage — For India corporate EMS, how do we handle the organizational politics when metro leadership assumes Tier-2 support is ‘good enough,’ but the site Transport Head is the one getting 3 a.m. calls due to weak escalation reach?
For India corporate EMS, organizational politics around metro vs Tier-2 support improve when escalation rights, response SLAs, and command-center coverage are written into the operating model instead of left to informal assumptions. The metro leadership expectation of “Tier-2 is good enough” usually holds only until a night-shift failure escalates to HR or Security, so the Transport Head needs a governance-backed way to convert 3 a.m. pain into measurable risk that leadership cannot ignore.
A common failure pattern is treating Tier-2 locations as “light-touch” sites. This often means weaker vendor presence, slower response, and no real-time command-center observability. The result is the Facility / Transport Head running manual workarounds, with HR and Security still holding them emotionally accountable for women-safety, OTP, and incident readiness. In practice, the buyer priorities for EMS—reliability, safety/duty of care, auditability, and centralized NOC governance—do not change because a site is Tier-2.
The practical way to handle the politics is to shift the conversation from “Tier-2 vs Metro” to “risk and outcome class.” The Transport Head can frame Tier-2 night ops with the same lenses used in the industry brief. These lenses include on-time performance, safety incident exposure, business continuity and BCP expectations, and ESG and reputational stakes for employee mobility. If the same SLAs and safety standards apply, then support and escalation coverage become non-negotiable controls rather than “nice to have.”
Three levers are usually effective.
First, codify escalation coverage and command-center roles for Tier-2 in formal governance. The MSP-style governance structures described in the collateral already distinguish between a Centralized Command Centre and Location-Specific Command Centres. The Tier-2 Transport Head should insist that the contract and SOPs explicitly define 24/7 coverage for high-risk bands, response-time SLAs for incident triage, escalation matrices with named roles and time-bound responsibilities, and command-center KPIs like incident detection-to-closure time and SLA breach rate. Once these are documented, the argument is no longer personal. It is about whether the organization wants to accept a higher SLA-breach risk at Tier-2 sites handling night shifts and women commuters.
Second, bring data from Tier-2 into the same dashboards and observability stack as metro operations. The industry brief emphasizes centralized NOC, streaming telematics, and unified KPI layers. If Tier-2 trips, SOS events, and vendor response times are visible on the same CO₂, OTP, and safety dashboards that CHRO, CFO, and ESG teams use, the gap between “perceived” and “actual” support quality shrinks. For example, if Tier-2 shows lower OTP%, longer exception closure times, or more manual interventions, the Transport Head can point to quantifiable risk instead of anecdotal complaints. This also ties into outcome-based procurement. Payments and penalties can be indexed to the same metrics across all locations. That makes underpowered Tier-2 support visibly expensive, not just uncomfortable.
Third, align HR, Security/EHS, and ESG around a single risk narrative for Tier-2. The persona summary shows that HR fears reputational damage and unanswerable leadership questions. Security fears incidents without auditable proof. ESG fears unverifiable claims. The Transport Head can use that to reframe Tier-2 under-support as a shared exposure. A small failure in a Tier-2 city still appears in internal forums and ESG or employee mobility narratives, and it still lands first on HR’s desk. This gives CHRO and Security a reason to back the demand for equivalent command-center coverage, women-safety protocols, and incident SOPs at Tier-2. Once HR and Security push for “safety and evidence parity” across sites, metro leadership has less room to insist on a “good enough” support tier that leaves Tier-2 operations exposed.
In operational terms, the Transport Head can push for a few concrete guardrails.
- Classify Tier-2 sites by risk (night shifts, women ridership, critical business processes) and link them to “metro-grade” support bands rather than geography.
- Extend the centralized command-center playbook—alerts, escalation, geo-fencing, and SOS monitoring—to these sites, with documented exception workflows.
- Include Tier-2 metrics in enterprise-level QBRs, mobility dashboards, and vendor scorecards so gaps become visible to CFO, Procurement, and HR.
- Use BCP and business continuity collateral to argue that Tier-2 weaknesses jeopardize continuity commitments made to clients and leadership.
This approach does not rely on the Transport Head “winning an argument” with metro leadership. It instead uses the industry’s own operating norms—centralized governance, outcome-linked contracts, continuous assurance, and command-center observability—to make under-support at Tier-2 logically inconsistent with the organization’s stated risk, safety, and ESG posture. It also redistributes ownership. Once the standards are codified, the 3 a.m. calls become evidence of a governance gap, not just an operations failure.
For Tier-2 sites, what review rhythm actually works—daily exception huddles, weekly reviews, monthly audits—so problems get fixed before they reach leadership?
B1418 Governance cadence for Tier-2 — In India corporate ground transportation EMS, what practical governance cadence works best for Tier-2 cities—daily exception calls, weekly performance reviews, or monthly audits—so issues are fixed before they become leadership escalations?
For Employee Mobility Services in India’s tier-2 cities, the most practical governance model is a three-layer cadence. Daily calls should focus only on exceptions and night-shift risks. Weekly reviews should manage performance and capacity. Monthly audits should handle deep compliance and commercial health. This pattern fixes issues early without overloading the transport team.
Daily exception governance works best as a short control-room huddle. The focus stays on high-risk shifts, driver availability, vehicle health alerts, and known trouble routes or weather disruptions. Transport heads and vendor supervisors rely on alert systems, GPS dashboards, and command-center visibility so they are not manually chasing every trip.
Weekly performance reviews work best for trend correction. Transport and vendor teams review OTP%, no-show patterns, seat-fill issues, repeated driver or vehicle failures, and open safety tickets. Most operational fixes, like rebalancing fleet, adjusting routing windows, and tightening roster cut-off times, are decided here.
Monthly audits work best for issues that require evidence and cross-functional alignment. Compliance teams, HR, Security, and Procurement validate driver and vehicle documentation, women-safety protocols, incident logs, and billing linkages to SLAs. This is also where EV utilization, CO₂ reduction tracking, and ESG-related metrics are reviewed.
A common failure mode is using daily calls as mini “audits,” which burns out the transport team and vendors. Another failure mode is relying only on monthly audits, which allows recurring issues to accumulate and turn into leadership escalations.
Tier-2 operations are more stable when organizations define clear SOPs for each layer of cadence, attach escalation matrices to the daily and weekly cycles, and keep monthly audits strictly evidence-based and cross-functional.
How should escalation layers be set up for Tier-2—local supervisor, regional manager, 24x7 contact—so ownership is clear during incidents?
B1419 Define clear Tier-2 accountability — For India corporate EMS, how should we structure escalation reach in Tier-2 cities—local supervisor, regional manager, and 24x7 command contact—so accountability is clear and we’re not stuck arguing ‘who owns it’ during an incident?
For India corporate EMS in Tier-2 cities, escalation works best as a three-layer, time-bound chain of responsibility where each layer has a clearly defined scope, clock, and “own it” boundary. The local supervisor owns trip-level fixes, the regional manager owns pattern and vendor issues, and the 24x7 command center owns cross-site incidents, safety, and client communication.
A common failure mode is leaving ownership implicit. This creates 2 a.m. arguments between vendor, local site, and central teams. A written matrix with names, phone numbers, and response SLAs prevents this. Most organizations define bands by severity and time-to-impact on shift start, safety, and compliance. The command center typically anchors this with real-time monitoring, alerts, and an incident log.
A practical structure is:
-
Local city supervisor. Owns live trip execution. Responds to driver no-shows, GPS or app glitches, last-minute roster changes, and route deviations. Has a strict response SLA (e.g., acknowledge in 5 minutes, action in 15). Escalates up if a shift is at risk or safety is in question.
-
Regional operations manager. Owns structural issues. Steps in when there are repeated OTP failures, chronic driver shortages, vendor non-performance, or city-level disruptions. Has authority to reassign fleet, change vendors, or approve temporary exceptions. Accountable for weekly review of Tier-2 performance and preventive actions.
-
24x7 central command center. Owns safety, compliance, and multi-city or high-severity incidents. Receives SOS, geo-fence and over-speed alerts, and BCP triggers. Decides when to invoke contingency plans and when to notify client HR, Security/EHS, and leadership. Maintains the audit-ready incident log and post-incident RCA.
To make this operationally calm for a Facility / Transport Head, the escalation reach should be encoded as:
- A one-page escalation matrix per city with:
- Named primary and backup for each level.
- Direct phone/WhatsApp plus command-center hotline.
- Clear severity bands and when each band jumps levels.
-
Explicit “who updates the client and when.”
-
Default rules, such as:
- Any women-safety, night-shift, or SOS event routes straight to the command center, even if the local supervisor is already working it.
-
If local supervisor does not acknowledge within the defined window, the command center auto-takes ownership and informs the regional manager.
-
Integration with the command capability and alert supervision stack described in the collateral, so geofence violations, device tampering, and over-speeding immediately create tickets that are tagged to the correct city and escalation route.
When escalation reach is defined this way, the Transport Head is not debating accountability during an incident. Instead, the system routes the event, the command center coordinates, and post-incident reviews with regional ops close the loop.
As a site HRBP, what’s the right way to frame Tier-2 transport failures to central HR so it doesn’t look like we’re failing locally, but we still get support for supervisors and spares?
B1422 Site HR escalation without blame — In India corporate Employee Mobility Services (EMS), what questions should a site HRBP ask to safely escalate Tier-2 city failures to central HR—without it sounding like local incompetence—and still get budget support for on-ground supervision and spares?
In India EMS programs, a site HRBP protects credibility by framing Tier‑2 failures as structural, evidence-backed risks rather than local mismanagement. The HRBP should ask questions that surface gaps in governance, command-center coverage, vendor capacity, safety assurance, and contingency buffers, and then link those gaps to HR’s duty of care, audit readiness, and shift stability.
The HRBP can anchor the escalation on three themes. The first theme is control-room visibility and governance. The HRBP should ask whether the central command center and Transport Command Centre view Tier‑2 routes with the same real-time tracking, alert supervision, and escalation matrix as metros. The HRBP should request clarity on SLAs for OTP%, incident detection-to-closure time, and business continuity plans in that city, and ask if central dashboards show audit-ready evidence for women’s night-shift safety, SOS response, and route adherence.
The second theme is vendor, fleet, and driver resilience. The HRBP should ask if current vendors in the Tier‑2 city have passed the same fleet compliance and induction checks, driver compliance and induction, and driver management and training standards used in primary sites. The HRBP should probe whether there is a defined buffer fleet or standby cars, as described in business continuity plans, and what the documented mitigation strategy is for cab shortages, strikes, technology failures, or weather events.
The third theme is safety, ESG, and reputational exposure. The HRBP should ask how women-centric safety protocols, escort rules, SOS control panel workflows, and centralized compliance management are being enforced and audited locally. The HRBP should link gaps to corporate ESG, HSSE, and women safety commitments, using user satisfaction index trends, complaint analysis, and any drop in commute experience or employee satisfaction scores as supporting data. The request for budget can then be positioned as funding specific guardrails. These guardrails include a local command-desk or on-ground supervisor tied into the centralized command center, defined spare fleet and driver buffers for peak and night shifts, and minimal EV or compliant-fleet capacity where ESG targets require it.
To make this defensible, the HRBP can structure the escalation around a few explicit questions:
- “Can central HR confirm what minimum OTP% and incident-closure SLAs are approved for Tier‑2 sites, and whether our current operations there are within those thresholds based on centralized dashboards?”
- “Has the existing vendor base in this city been put through the same Fleet Compliance & Induction, Driver Compliance, and Business Continuity Plan standards as our metro locations, and where are the gaps?”
- “What is the approved buffer policy for vehicles and drivers in smaller cities, and is there a budgeted provision for standby cars and backup drivers during weather, political, or technology disruptions?”
- “How are women-centric safety protocols, SOS–control panel response, and safety & security for employees being monitored and audited at this site, and who is accountable on-ground when there is an alert outside central command hours?”
- “User feedback and satisfaction from this location show X pattern; what central support and budget can be allocated for a local transport coordinator or on-ground supervisor to stabilize operations and protect HR’s duty-of-care commitments?”
These questions shift the conversation from “local failure” to “system design gap,” keep ownership with central governance frameworks, and create a clear, budget-backed case for on-ground supervision, buffers, and spares as standard EMS safeguards rather than ad-hoc favors.
How do we set incentives/penalties for Tier-2 escalation response and spare vehicle dispatch so the vendor improves, but we don’t end up in constant disputes?
B1423 Tier-2 incentives without disputes — For India corporate ground transportation EMS, how do we structure penalties and incentives specifically around Tier-2 escalation responsiveness and spares dispatch, so we improve behavior without creating constant disputes and vendor defensiveness?
Penalties and incentives around Tier-2 escalation and spares dispatch work best when they are tied to a few clear, time-bound KPIs, backed by clean data and pre-agreed dispute rules. The contract should reward consistent “green zone” performance on response and resolution times, and only trigger penalties for repeated or high-severity misses that are traceable in the command-center logs.
Avoid generic “poor service” clauses. Define Tier-2 escalation explicitly in the EMS context. For example, app failures, repeated GPS drop-offs, vehicle breakdowns, or safety-relevant issues that Level-1 support cannot close within a defined period. Use the command center and alert systems described in the collateral to time-stamp when an escalation is raised, acknowledged, and resolved.
Structure financials around a small set of measurable metrics such as average Tier-2 response time, percentage of escalations acknowledged within a defined window, and time-to-dispatch for replacement vehicles or spares. Link modest penalties to monthly breach bands on these metrics instead of per-incident fines. This reduces daily arguments and still shapes behavior.
Balance penalties with upside. For example, offer quarterly incentives if Tier-2 response and spares dispatch consistently outperform agreed thresholds, while related KPIs like On-Time Performance and incident closure SLAs remain stable or improve. This aligns escalation behavior with overall reliability rather than encouraging corner-cutting.
To limit disputes, make the command center or Transport Command Centre the single source of truth for timing and status, and define a simple review process where disputed cases are sampled in monthly governance or QBR meetings. This keeps the Facility / Transport Head in control of the real-world edge cases while giving vendors confidence that penalties are evidence-based, not subjective.
How do we write SLAs and penalties for tier-2 failures—no supervisor, no backup cabs, partner no-show—so we don’t fight about it every month with Finance and HR?
B1431 Tier-2 SLA and penalty design — In India Employee Mobility Services (EMS), how should procurement define SLAs and penalties specifically for tier-2 coverage failures (no supervisor reachable, no spares, partner no-show) so disputes don’t become monthly firefights between Finance, HR, and the vendor?
Procurement should define SLAs for tier-2 coverage failures as clear, incident-based commitments with objective evidence rules and pre-agreed penalty ladders, rather than open-ended “service is bad” clauses. Coverage must be quantified per site and shift, with specific definitions of “no supervisor reachable”, “no spare”, and “partner no-show” tied to timestamped command-center and app logs.
Procurement should first codify what “tier-2 coverage” means operationally. For Employee Mobility Services this typically includes a location-specific command centre, on-ground supervisors, standby or buffer vehicles, and a working escalation mechanism. The MSP governance structure and Transport Command Centre material show that centralized and local command centres are expected to provide real-time supervision, quick response, and business continuity, so the SLA must refer to that model explicitly.
A common failure mode is vague “24/7 support” language. Procurement should instead specify response-time SLAs for supervisors (for example, call or ticket acknowledgement within defined minutes), minimum standby vehicle ratios per active fleet, and clear definitions of “no-show” using GPS and trip ledger data. The Business Continuity Plan and “Guarantee for Uninterrupted Services” collaterals demonstrate that buffers, alternate vendors, and transition playbooks can be formalized as part of tier-2 readiness, which allows penalties to be linked to whether those buffers were actually in place.
Penalties should be structured as stepwise, outcome-linked instruments. A practical pattern is to start with service credits or invoice deductions per validated incident, then escalate to higher slabs if breach volume crosses a monthly threshold, and finally trigger governance actions such as performance reviews or vendor tier downgrade. The “Tech Based Measurable and Auditable Performance” material suggests using auditable KPIs and independent audits to verify breaches and avoid argument over root cause.
To prevent monthly firefights between Finance, HR, and the vendor, procurement should anchor all SLAs in shared data and governance. Trip logs, alert supervision dashboards, and command center reports should be the single source of truth for counting tier-2 failures. A joint “indicative management report” plus a dashboard-based “single window system” help ensure all parties see the same numbers before invoices are raised. Quarterly governance (using the Engagement Model and Account Management & Operational Excellence framework) should review patterns, not re-litigate individual trips.
Procurement can further reduce disputes by building in a short closure SLA for incident disputes. For example, any challenge to a logged tier-2 failure must be raised within a defined number of days, with required evidence (call recordings, GPS data, screenshots) or else the metric stands as logged. This uses the Continuous Assurance idea from the industry brief, shifting arguments from subjective complaints to verifiable data.
What’s the best operating model when HR owns employee experience and transport owns day-to-day ops, especially in tier-2 cities where escalations are harder and incidents lead to blame?
B1432 HR vs Ops governance in tier-2 — In India corporate employee transport (EMS), what governance model works best when HR owns employee experience but facilities/transport owns daily operations—especially for tier-2 cities where escalation reach is thin and misalignment leads to blame during incidents?
A dual-layer governance model with a central mobility board plus a 24x7 command center works best when HR owns experience and facilities/transport owns operations. The central layer gives HR policy control, evidence, and escalation clarity, while the command center gives Transport early alerts, playbooks, and on-ground control, which is critical when tier-2 escalation reach is thin.
The most stable pattern puts HR as chair of an enterprise “mobility board” that owns policies, women-safety rules, SLA targets, and experience KPIs. Facilities/transport leads execution through a central command center with regional hubs, using defined SOPs for routing, exceptions, and incident response. This separates “what good looks like” (HR and governance) from “how it runs at 2 a.m.” (Transport and vendors) but links them through shared KPIs like OTP, incident closure time, and complaint SLAs.
In practice, problems arise in tier-2 cities when there is no single NOC view and no clear escalation ladder. A command-center model with real-time alerts, business continuity playbooks, and an escalation matrix protects HR from surprise escalations and protects operations from blame for issues outside their control. Vendor governance, central compliance dashboards, and periodic joint reviews (HR + Transport + vendor) create a record of decisions, which reduces finger-pointing after incidents and supports both safety and cost discussions with leadership.
As HR, what are the key non-negotiable questions to quickly confirm tier-2 coverage is real and not just jargon and promises?
B1433 CHRO coverage assurance questions — In India Employee Mobility Services (EMS), how can a CHRO pressure-test ‘coverage assurances’ for smaller cities without getting trapped in operational jargon—what are the few non-negotiable questions that reveal whether tier-2 support is real?
In India Employee Mobility Services, a CHRO can pressure‑test tier‑2 “coverage assurances” by asking a small set of specific, evidence‑seeking questions that force vendors to show real fleet, real partners, and real SOPs for smaller cities. The most revealing questions focus on current operations, command‑center visibility, business continuity, and women‑safety readiness rather than generic “pan‑India” claims.
First, the CHRO should ask about existing operations with proof. A direct question is: “In which tier‑2 and tier‑3 cities are you already running EMS today, for which named clients, with how many vehicles?” This question exposes whether coverage is aspirational or live. The vendor should be able to show a current EV or ICE fleet footprint map, like the one that highlights 327 active EVs across multiple Indian states and logos of Fortune 500 clients, rather than just saying “we can scale anywhere.” The CHRO should also ask, “Can you share one recent case where you launched EMS in a new tier‑2 city and the exact go‑live timeline?” This tests whether the “rapid EV adoption” or “project commute” playbooks are actually used in smaller locations.
Second, the CHRO should probe command‑center and escalation support outside metros. A key question is: “What does my control room see for a small city at 2 a.m., and who picks up the phone?” The answer should reference a 24/7 centralized command centre or Transport Command Centre, with clear escalation matrices and alert supervision systems that monitor geofence violations, overspeeding, and SOS triggers across all locations. Another question is: “Show me how your centralized command centre supervises location‑specific command centres for smaller sites.” This reveals whether the MSP governance structure with dual command centres is real or only a slide.
Third, the CHRO should validate business continuity and backup capacity for non‑metro routes. They can ask: “If three cars break down in the same smaller city on a rainy night, what buffer fleet and BCP plan kicks in, and who authorizes deviations?” The vendor response should mention a business continuity plan with buffer vehicles, associated businesses for additional support, and mitigation playbooks for strikes, technology failures, and weather disruptions. The CHRO should request one written BCP document that explicitly covers smaller cities, not just metro‑focused scenarios.
Fourth, the CHRO needs to check women‑safety and compliance readiness in tier‑2. A precise question is: “Are your night‑shift women‑safety protocols, chauffeurs, and SOS coverage identical in smaller cities as in metros, and how do you audit this?” The vendor should explain women‑centric safety protocols, chauffeur excellence programs, driver compliance checks, and SOS control panels that work uniformly across locations. The CHRO can ask: “Show me your driver assessment, background verification, and training records for drivers in one non‑metro city.” This confirms that driver compliance, POSH training, and safety briefings apply outside main hubs.
Fifth, the CHRO should insist on measurable SLAs and reporting specific to smaller cities. They can ask: “What on‑time performance and safety KPIs do you commit to in tier‑2 cities, and where will I see them?” The answer should reference dashboards with OTP%, incident logs, and user satisfaction indices segmented by city, not just overall averages. A follow‑up is: “Can you show me a sample single‑window dashboard or indicative management report where I can filter by city and see compliance, deviations, and CO₂ impact for that site?” This tests whether the data platform and reporting actually break down performance at the location level.
- Ask for current tier‑2 client list, live fleet counts, and one recent non‑metro go‑live story.
- Demand to see the 24/7 command‑center view, escalation matrix, and alert types that apply to small cities.
- Review a written BCP that includes cab shortages, strikes, and tech failures in smaller locations.
- Inspect driver verification and women‑safety SOPs for at least one non‑metro site, with training and compliance evidence.
- Require city‑wise dashboards or sample reports showing OTP, incidents, and satisfaction scores by location.
In tier-2 cities with limited supply, should we standardize on one vendor or use multiple vendors for coverage and backups—and how do we avoid governance chaos either way?
B1437 Single vs multi-vendor tier-2 model — In India corporate employee mobility (EMS), when tier-2 cities have limited supply, how should an operations head decide between single-vendor standardization versus multi-vendor tiering for partner density and spares—without creating governance chaos?
In tier-2 Indian EMS markets with thin supply, most operations heads are better served by a structured multi‑vendor tiering model anchored by one primary partner, instead of pure single‑vendor dependence or uncontrolled vendor sprawl. The primary partner carries standardized SOPs and command‑center integration, while 1–2 tightly governed secondary partners provide capacity buffers, geography coverage, and spares.
Single‑vendor standardization gives cleaner governance and simpler SOP enforcement. It also concentrates risk when driver attrition spikes, new plants open, or monsoon/political events strain capacity. A common failure mode is night‑shift breakdowns when the single vendor cannot source buffer vehicles in time, which then forces last‑minute “spot vendors” with no compliance history.
A multi‑vendor tiering model works when the operations head treats it as one governed network under a central command center, not as parallel silos. The primary vendor runs most shift rosters, technology stack, and compliance baselines. Tier‑2 vendors get defined roles such as specific timebands, routes, or peak‑load blocks, with clearly tagged fleets and pre‑audited driver and vehicle compliance.
To avoid governance chaos, the operations head needs a single operations and data plane. The command center should see all vendors through one dashboard, one alert system, and one escalation matrix. Trip adherence, on‑time performance, incident response, and compliance currency must be measured per vendor but reported on a unified KPI sheet that feeds HR, Finance, and Security.
A practical decision rule in constrained tier‑2 markets is to keep vendor count intentionally low and roles explicit. Most organizations stabilize at one primary vendor plus one backup vendor, with pre‑approved Business Continuity Plan triggers for activating additional capacity. Governance remains manageable when vendor onboarding, compliance checks, driver training, and billing models follow the same standardized templates for every partner.
- Use single‑vendor when volume is modest, risk tolerance is low, and the vendor has proven buffer capacity and local depth.
- Use tiered multi‑vendor when shifts are high‑volume, night‑heavy, or multi‑site, and when business continuity depends on spare vehicles and geographic reach.
- In both cases, insist on one command center, one ETS/EMS platform, and common SOPs to keep partner density from turning into governance overload.
In tier-2 cities, who exactly is on-call, what’s the escalation ladder, and what’s the fallback if the local supervisor can’t be reached?
B1444 Validating escalation ladder in tier-2 — In India Employee Mobility Services (EMS) for distributed offices, how should a buyer validate escalation reach in tier-2 cities—who is the named person on-call, what is the escalation ladder, and what happens if the local supervisor is unreachable?
In India Employee Mobility Services for distributed offices, buyers should validate escalation reach in tier-2 cities by demanding a named 24x7 duty owner, a written multi-level escalation ladder, and a clear failover path to a central command center when the local supervisor is unreachable. Escalation design must be treated as an auditable SOP with defined roles, time-to-respond targets, and backup coverage across all time bands, not as an informal “call the local vendor” arrangement.
Buyers should first insist on a documented escalation matrix that specifies individual names, designations, and mobile numbers for each level, starting from local ground staff up to the key account manager. The matrix should explicitly map which person is primary on each shift, who is the backup, and how quickly each level must acknowledge and act on alerts such as SOS triggers, geofence violations, or no-show vehicles, as supported by materials describing alert supervision systems and escalation mechanisms. Validation is stronger when the vendor operates a central command centre or transport command centre with 24/7 monitoring and the authority to override local gaps during breakdowns, political strikes, or technology failures, as evidenced in the business continuity and command-centre collaterals.
A common failure mode is over-reliance on a single local supervisor with no tested backup route, which results in stalled responses during night shifts, festivals, or sudden absenteeism. To reduce this risk, buyers should run table-top drills and live tests before go-live, such as midnight test calls, simulated SOS events from the employee app, and forced-escalation scenarios when the first contact does not respond within the defined SLA. Strong vendors will demonstrate how alerts from driver and employee apps feed into a centralized dashboard, how the alert supervision system auto-escalates if local personnel are offline, and how regional or central command staff intervene to coordinate alternate vehicles, driver replacement, or emergency support in tier-2 locations.
Useful validation steps for buyers include: - Reviewing a written escalation matrix that ties into the vendor’s command-centre governance. - Confirming that escalation contacts are mirrored inside tools like the alert supervision system and transport command centre, not only in a PPT. - Checking that business continuity plans explicitly cover tier-2 and 24/7 operations with buffer vehicles and shared fleets. - Asking for past incident reports from similar cities to see actual response and closure patterns, not only promises.
How do we avoid the blame loop in tier-2 issues where HR says it’s vendor negligence and the vendor says it’s roster changes—what clear rules and escalation steps prevent that?
B1448 Preventing tier-2 blame loops — In India enterprise employee transport (EMS), how do transport heads avoid the political trap where HR escalates tier-2 failures as ‘vendor negligence’ but the vendor blames ‘roster changes’—what operating rules and escalation protocols prevent this blame loop?
In India EMS operations, transport heads break the HR–vendor blame loop by turning every “reason” into an explicit, pre-agreed operating rule with timestamped evidence and a clear escalation ladder. When roster changes, routing, and on-ground exceptions are governed by written SOPs, command-center workflows, and audit-ready logs, HR cannot casually call it “vendor negligence” and vendors cannot hide behind “last-minute changes.”
Transport heads who avoid political traps usually put four guardrails in place.
First, they standardize the operation as a governed service, not an informal arrangement. Routes, shift windows, SLA definitions for OTP and Trip Adherence Rate, and change cut‑off times for rosters are documented in the EMS operation cycle, ETS Operation Cycle, and ETS Operation Cycle Detailed collaterals. Roster changes beyond the cut-off push trips into a codified “best-effort” bucket, which is visible to HR through dashboards like Dashboard – Single Window System and Customized Dashboard. This converts “he said–she said” into “this booking breached the agreed window.”
Second, they move all daily control into a command-center model with observable evidence. A Centralized Command Centre and Location Specific Command Centres, as shown in Model Proposed – MSP Governance Structure and Transport Command Centre, monitor GPS, route adherence, and exceptions in real time. The Alert Supervision System and Management of on Time Service Delivery collateral show how alerts (no-show, geofence violation, over-speeding, traffic disruption) are generated and closed. Every incident has a ticket, a timestamp, and an assigned owner in the escalation matrix.
Third, they hard-wire escalation and governance rather than relying on ad-hoc phone calls. Engagement Model – Approach, Escalation mechanism and matrix, and Account Management & Operational Excellence Model define who gets called at Level 1–3, what SLA applies for response and closure, and how issues move from operational floors to governance committees. HR escalations are routed into this structure, not handled as informal complaints, which protects the transport head from being the lone “shock absorber.”
Fourth, they make reports and audits the single source of truth. Indicative Management Report, Data Driven Insights, and Tech Based Measurable and Auditable Performance show that OTP, seat-fill, route deviations, and complaint closure SLAs are reported systematically. When HR flags “vendor negligence,” the transport head’s first move is to pull the trip ledger, roster version history, and alert timeline from systems like Commutr, the WTI Cabs dashboard, or the Command Centre. This evidence shows whether the root cause was a late roster, a driver failure, or a genuine external disruption, and it can be reviewed in governance forums instead of argued in corridors.
images:
images:
images: 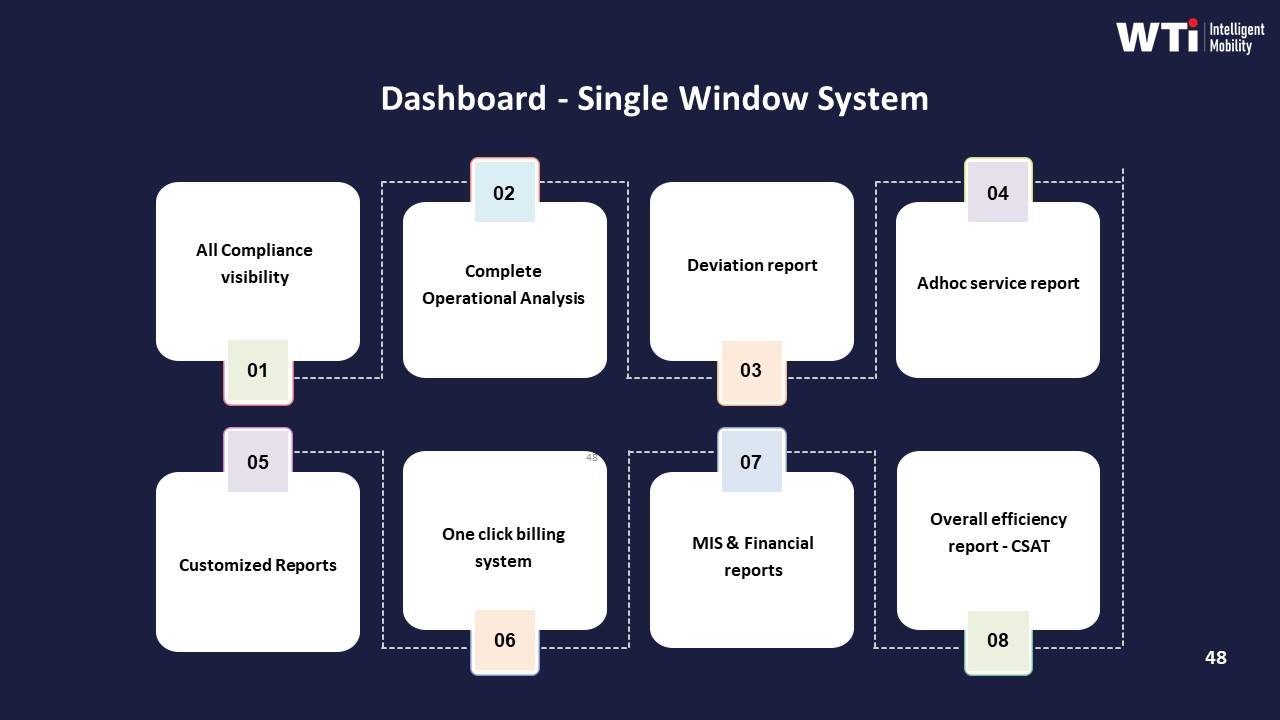
If a vendor says ‘pan-India coverage,’ what exact tier-2 definitions should we lock in—city list, minimum partners, supervisor hours, and minimum backups—so it’s enforceable?
B1450 Contracting pan-India tier-2 definitions — In India corporate employee mobility (EMS), when a vendor claims ‘pan-India coverage,’ what precise tier-2 definitions should procurement insist on (city list, minimum partner count, supervisor presence hours, minimum spares) to make the claim contract-enforceable?
Procurement teams should convert “pan-India coverage” into a tiered, city-wise service definition with hard numbers on cities, partners, people coverage, and spare capacity.
The definition should be explicit enough that a failure is measurable against contract SLAs and not arguable.
City List and Tier Definitions
Procurement should require the vendor to submit a named city list grouped by clear tiers. Each tier should then carry its own mandatory coverage parameters.
Tier-1 / Metro cities. The vendor should list all metros where EMS is offered with full SLA governance. Procurement should bind the vendor to this exact list in the contract.
Tier-2 cities. The vendor should provide a separate list of Tier-2 cities where shift-based EMS is available with SLAs comparable to Tier-1. Any use of “tier-2 and 3” in sales material should be translated into a concrete, named list.
Expansion clause. Any future city additions should require formal onboarding (supply check, compliance check, driver onboarding) before “pan-India” is claimed for that city.
Minimum Partner and Fleet Backing per Tier-2 City
Procurement should anchor “coverage” to minimum operator depth, not just presence. A common failure mode is single-vendor dependence in a city that is labeled as “covered.”
Minimum partner count. For Tier-2 EMS, the vendor should commit to at least a defined number of active fleet partners per city. This allows continuity if one supplier fails.
Verified fleet availability. The vendor should declare a baseline number of EMS-suitable vehicles tagged to the client or to EMS operations in that city. This fleet should be compliance-cleared and visible in the vendor’s command center.
On-Ground Supervisor Presence and Hours
Procurement should insist that “pan-India” includes defined human supervision, not just an app and a remote helpdesk. Control-room stability in Tier-2 cities depends on an accountable local lead.
Local supervisor role. Each Tier-2 city used by the client should have a named supervisor or city lead responsible for shift operations, escalations, and vendor coordination.
Presence hours. The contract should specify minimum on-ground supervisor hours aligned with the client’s peak EMS windows, especially night shifts where safety and women-first policies apply.
Escalation linkage. The local supervisor should be formally integrated into the central command center’s escalation matrix with response-time SLAs.
Minimum Spare Fleet / Standby Capacity
“Pan-India” is only meaningful if the vendor can absorb breakdowns, weather events, and local disruptions without collapsing OTP. Spare capacity should therefore be defined per city, not just nationally.
Standby vehicles per city. Procurement should define a minimum spare percentage or count of EMS-ready vehicles in every contracted Tier-2 city. These vehicles should be pre-onboarded with full fleet and driver compliance.
Buffer logic for peaks. The definition should clarify how spares are deployed during seasonal peaks, political strikes, or monsoons, with linkage to the vendor’s business continuity plans.
Making It Contract-Enforceable
To make “pan-India coverage” enforceable rather than marketing language, procurement should:
Attach the city and tier list as a binding annexure with change control.
Embed minimum partner count, declared EMS fleet, on-ground supervisor presence, and spare capacity as measurable SLAs per Tier-2 city.
Link non-compliance in any contracted city to penalties, step-in rights, or rebalancing to alternate vendors under a documented vendor governance framework.
What usually causes 3 a.m. escalations in tier-2 cities—no-shows, driver churn, no backups, unreachable supervisors—and how do we test the vendor has controls for each?
B1452 Testing controls for tier-2 failures — In India Employee Mobility Services (EMS), what are the most common failure modes that cause 3 a.m. escalations in tier-2 cities (partner no-show, driver churn, spare not available, supervisor unreachable), and how should a buyer test whether a vendor has controls for each?
In Indian Employee Mobility Services for tier-2 cities, 3 a.m. escalations usually trace back to four operational failure modes. Each failure has a specific control that a buyer can and should test before awarding business.
1) Partner / Vehicle No-Show
The common pattern is thin bench strength in smaller cities and weak real-time supervision.
- Vendors over-assign a limited fleet across multiple clients.
- There is no enforced standby logic or pre-shift readiness check.
- Rosters change late, but routing and allocation are not recalibrated.
Buyers should insist on seeing a documented ETS Operation Cycle or similar process that shows how rostering, routing, vendor distribution, and pre-shift checks are handled end to end.
A practical test is to run a live pilot on night shifts in at least one tier-2 location and review OTP% and no-show data alongside route adherence and exception logs.
Another direct test is to ask for the Business Continuity Plan pages that handle cab shortage, strikes, and technology failures and then simulate a few scenarios during evaluation.
2) Driver Churn and Last-Minute Dropouts
The common pattern is over-dependence on a few local drivers and poor fatigue or morale management.
- Vendors do not maintain a trained buffer pool for night operations.
- Driver training is one-time, not continuous, so discipline and safety culture erode.
- Incentives do not support unpopular timebands like 11 p.m.–5 a.m.
Buyers should review the vendor’s Driver Assessment & Selection Procedure and Driver Management & Training material, including refresher and rewards programs, for evidence of systematic onboarding and retention.
A strong test is to ask for historical data on driver attrition for tier-2 locations, plus a sample of driver compliance audits and training attendance records.
Another test is to check whether the vendor runs daily shift-wise briefings and has written SOPs for replacing an absent driver within a defined SLA.
3) No Spare Vehicle Available When a Cab Breaks Down
The common pattern is no structured standby fleet policy and no supply-chain “Q” model for remote sites.
- Standby ratios are defined on paper but not tagged to specific routes or hubs.
- There is no clear Maker & Checker process for fleet compliance and health checks.
- Vendors rely on ad-hoc calling of local market taxis when breakdowns occur.
Buyers should request the Customized Service Delivery System view or equivalent, looking for explicit mention of supply chain design, standby allocation, and centralized helpdesk support.
A key test is to ask for the Fleet Compliance & Induction framework and a sample Safety Inspection Checklist for Vehicles, then verify that these are applied in tier-2 cities with audit evidence.
Another test is to run a structured simulation where one vehicle on a night route is “failed” and the vendor must demonstrate time-to-spare-replacement and communication flows.
4) Supervisor / Command Center Unreachable or Powerless at 3 a.m.
The common pattern is daytime governance only, with thin or absent 24x7 command capability for smaller cities.
- Local transport desk is a single person without escalation rights.
- No central Transport Command Centre or EV/EMS Command Centre is actively monitoring tier-2 demand.
- Alerts for no-show, speeding, or geofence violations do not route to an always-on NOC.
Buyers should ask to see the proposed MSP Governance Structure or Command Centre model, confirming that tier-2 cities are within real-time monitoring scope with defined escalation matrices.
A practical test is to conduct an unannounced after-hours escalation drill during the pilot and observe how quickly the Command Center, on-ground supervisor, and driver all respond.
Another test is to review the Alert Supervision System and SOS control panel configuration for night shifts and confirm that alerts are actively monitored and closed with time-stamped tickets.
How to Structure Vendor Testing Across These Failure Modes
Most reliable organizations combine document checks, live pilots, and scenario drills to avoid paper-only assurances.
They insist on at least one tier-2 city being included in pilots with real shift rosters, live routing via platforms like Commutr, and Command Center visibility dashboards.
They test women-centric safety protocols, BCP playbooks, and escalation matrices under simulated disruptions before scaling to more sites.
They cross-verify vendor claims with indicative management reports, CO2 and uptime dashboards, and client testimonials that mention night-shift reliability and 98%+ on-time arrival performance.
How do we balance central control-room monitoring and local supervisors in tier-2 cities so escalations are fast but costs don’t blow up?
B1453 Central NOC vs local supervision — In India enterprise employee transport (EMS), how should a buyer decide the right balance between centralized NOC monitoring and local on-ground supervision for tier-2 cities, so escalation reach is fast without bloating headcount and cost?
In India enterprise employee transport, buyers get the best balance by running one centralized 24x7 NOC for governance and observability, and adding lean, SOP-driven local supervision in tier‑2 cities only for high‑risk timebands, sites, or projects. Centralization should own routing, GPS visibility, alerts, SLA reporting, and vendor governance, while local teams handle physical contingencies, driver management, and immediate employee support when something goes wrong on the ground.
Centralized NOC monitoring works well for trip tracking, alert supervision, and SLA governance because real-time dashboards, geo-fence alerts, and SOS events can be managed for many cities from one command center. Central teams can also standardize driver and fleet compliance checks, run safety and women-security protocols, and manage incident logs and audits. This reduces duplicated overhead and gives HR, Security, and Finance one source of truth for OTP, incident rate, and safety evidence.
Local on-ground supervision is still essential in tier‑2 cities where driver availability, infrastructure gaps, or political and weather disruptions are more volatile. Local teams are needed for rapid fleet mobilization, last-minute route changes, and physical incident handling, backed by a defined escalation matrix to the central NOC. Buyers should size these local teams based on shift volumes, night-shift density, and incident history, instead of mirroring metro headcount.
A practical way to avoid bloated cost is to define clear triggers for local presence and escalation. Examples include night-shift operations for women employees, high-volume project or event commute, or sites with recurring disruption patterns. For smaller or stable locations, buyers can rely on central NOC plus vendor supervisors on shared duty, governed by standard safety, BCP, and compliance playbooks, with performance reviewed through centralized KPIs like OTP%, incident closure time, and route adherence.
surge, peak, and contingency planning
Prepare for predictable peaks with tested contingency routing, surge playbooks, and on-ground control desks that stay engaged during disruptions.
What should a real surge/festival playbook look like for tier-2 commute ops—extra capacity, driver controls, escalation rules, and backup routes—so service doesn’t collapse in peak weeks?
B1379 Surge and festival playbook essentials — In India corporate Employee Mobility Services (EMS), what should a surge and festival season playbook contain for tier-2 cities—capacity buffering, driver attendance controls, escalation rules, and contingency routing—so the program doesn’t collapse during predictable peak weeks?
A surge and festival season playbook for Employee Mobility Services in tier‑2 Indian cities must hard‑code capacity buffers, driver attendance controls, escalation rules, and contingency routing into simple, repeatable SOPs. The objective is to keep OTP, safety, and command‑center stability intact through predictable peak weeks instead of relying on last‑minute improvisation.
A practical playbook starts with calendarization. Transport teams should lock a surge calendar with HR and business units that maps local festivals, exam seasons, political events, and weather patterns to expected demand spikes. This calendar becomes the trigger for pre‑approved capacity buffers, vendor commitments, and Business Continuity Plan activation and is reviewed in the command center huddle.
Capacity buffering in tier‑2 cities works best with clear fleet-mix rules. Operators typically define minimum extra standby capacity by shift window, diesel–EV mix for night reliability, and vendor tiering for backup vehicles. These buffers are tied to measurable OTP and dead mileage limits so that cost control and resilience stay balanced. Rapid fleet mobilization models from project and event commute services can be borrowed for these windows.
Driver attendance control requires structured onboarding, fatigue management, and incentives. Organizations formalize attendance expectations well before festivals, align duty cycles with labor norms, and use driver apps for real‑time availability and roster confirmation. Training and rewards programs for safe and reliable drivers are scheduled before peak weeks to stabilize morale and reduce last‑minute no‑shows.
Escalation rules are encoded into the command center operations. A tiered escalation matrix defines who picks up which issue at what threshold for delays, app downtime, cab shortages, or safety exceptions. The command center uses real‑time alerts from the supervision system, geo‑fence violations, and SOS signals to trigger predefined playbooks rather than ad‑hoc decisions.
Contingency routing in tier‑2 cities depends on dynamic route recalibration, weather or event-aware detours, and predefined alternate hubs. The routing engine and control desk collaborate to maintain trip adherence and seat fill while switching to backup routes when roads are blocked by processions, markets, or waterlogging. Random route audits ensure that safety rules, especially for women and night shifts, are still enforced under rerouting conditions.
images:
How can we test a vendor’s tier-2 contingency routing for closures, local events, and weather without piloting in every single city?
B1384 Testing contingency routing without full pilot — In India corporate Employee Mobility Services (EMS), how should a Facilities/Transport Head test a vendor’s contingency routing capability in tier-2 cities—road closures, local events, weather disruptions—without running a full pilot across every location?
A Facilities or Transport Head can test a vendor’s contingency routing capability in tier‑2 cities by running targeted, scenario‑based drills from a central command setup instead of doing a full multi‑city pilot. The focus should be on observing how the vendor’s command center, routing engine, and on‑ground teams handle simulated disruptions, and how quickly they restore predictable, SLA‑aligned operations.
A practical approach is to start with 2–3 representative tier‑2 locations and define 4–6 disruption playbooks that matter most. Typical scenarios include road closures due to local processions, monsoon‑style waterlogging, sudden cab shortages, political strikes, and partial tech outages. The vendor should demonstrate dynamic route recalibration, live driver communication, and clear escalation paths for each scenario. In India EMS, mature operators already document such Business Continuity Plans with buffers, backup fleets, and local authority coordination for strikes, disasters, and technology failures. These artifacts can be reviewed upfront to filter out weak vendors before any field test.
The test should be structured as standard operating drills rather than ad‑hoc checks. The Facilities Head can ask the vendor’s command center to run time‑boxed simulations using actual or anonymized rosters, then review OTP, exception closure times, and communication logs. A common failure mode is vendors who talk about “AI routing” but cannot show command‑center workflows, alert supervision, or clear BCP triggers. Strong vendors link their routing and command center operations with explicit mitigation steps for cab shortages, political events, and app or GPS downtime, and can show how they maintained >98% on‑time arrival in real‑world disruptions like monsoon operations.
Key signals to check in these limited tests include whether the vendor has pre‑approved alternate routes and pickup clusters for known bottlenecks, whether they maintain standby vehicles and multi‑vendor buffers for cab shortages, and whether safety and compliance controls still hold under rerouting. The Facilities Head should insist on seeing integrated alert supervision, escalation matrices, and a central dashboard view, since these reduce night‑shift firefighting in practice.
images:
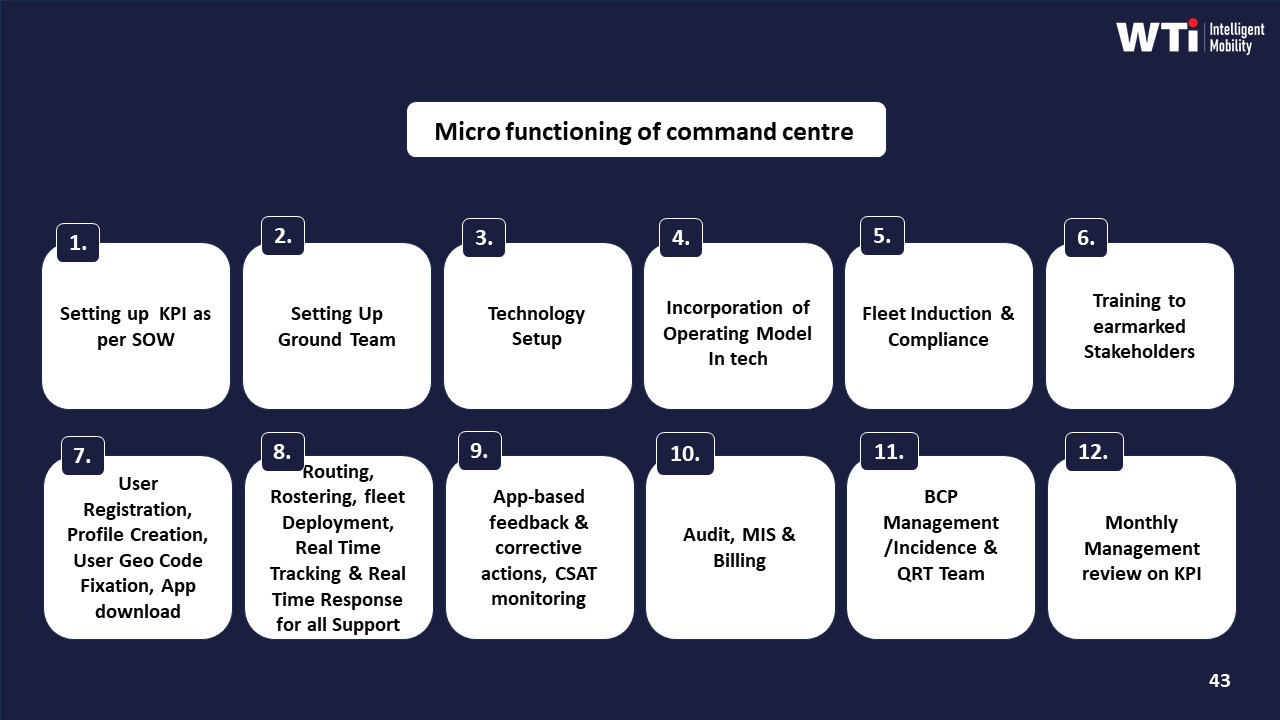
For event transport in Tier-2 cities, what should we expect in a real surge/festival playbook—how fast they add vehicles, who runs on-ground control, and what backup routes exist?
B1401 Tier-2 surge/festival playbook — For India corporate Project/Event Commute Services (ECS), what does a credible surge and festival-season playbook look like for Tier-2 cities—fleet mobilization timelines, on-ground control desks, and contingency routing—so the event doesn’t collapse under peak demand?
A credible surge and festival-season playbook for Project/Event Commute Services in Tier‑2 Indian cities hard‑codes rapid fleet mobilization, a dedicated on‑ground control desk, and pre‑approved contingency routes into a time‑bound plan. The playbook converts peak‑demand uncertainty into dated milestones, buffer capacity, and clear SOPs so the event can absorb traffic, weather, and vendor failures without collapsing.
In practice, operators in ECS start with a macro transition and project planner. They map a 6–10 week window that includes pre‑transition work, manpower deployment, tech implementation, and fleet deployment, with weekly responsibilities assigned to client and vendor. During this window, they lock infrastructure requirements per city branch, finalize package options by duty duration and distance, and confirm insurance coverage to protect against operational risks.
For surge periods, a rapid EV or ICE adoption model is mirrored. Operators use a project commute framework that provides dedicated vehicles and drivers across contracted hours. They create a temporary but fully staffed project/event control desk that functions as a local command centre. This desk uses an alert supervision system, data‑driven insights dashboards, and transport command centre processes to monitor routes, geofence breaches, over‑speeding, and no‑show patterns in real time, with escalation matrices defined in advance.
Contingency routing in Tier‑2 cities relies on prior monsoon and disruption case‑study learning. Providers use dynamic route optimization and traffic‑trend analysis to maintain high on‑time performance during adverse conditions, with pre‑approved alternate paths, time‑band specific routing, and coordination protocols with local authorities. Business continuity plans explicitly cover cab shortages, political strikes, natural disasters, and technology failures, assigning named owners and fallback actions such as shift time changes, backup systems, and associated‑business fleet support.
Signals of a solid playbook include: documented ETS/ECS operation cycles for booking→rostering→routing→vehicle distribution→tracking→reporting; a micro‑functioning of command centre checklist; vendor and statutory compliance processes for fleet and drivers; and periodic safety and compliance audits tied to HSSE tools and safety‑inspection checklists. Without this structure, festival‑season surges default to reactive firefighting with high escalation risk for the facility or transport head.
images:
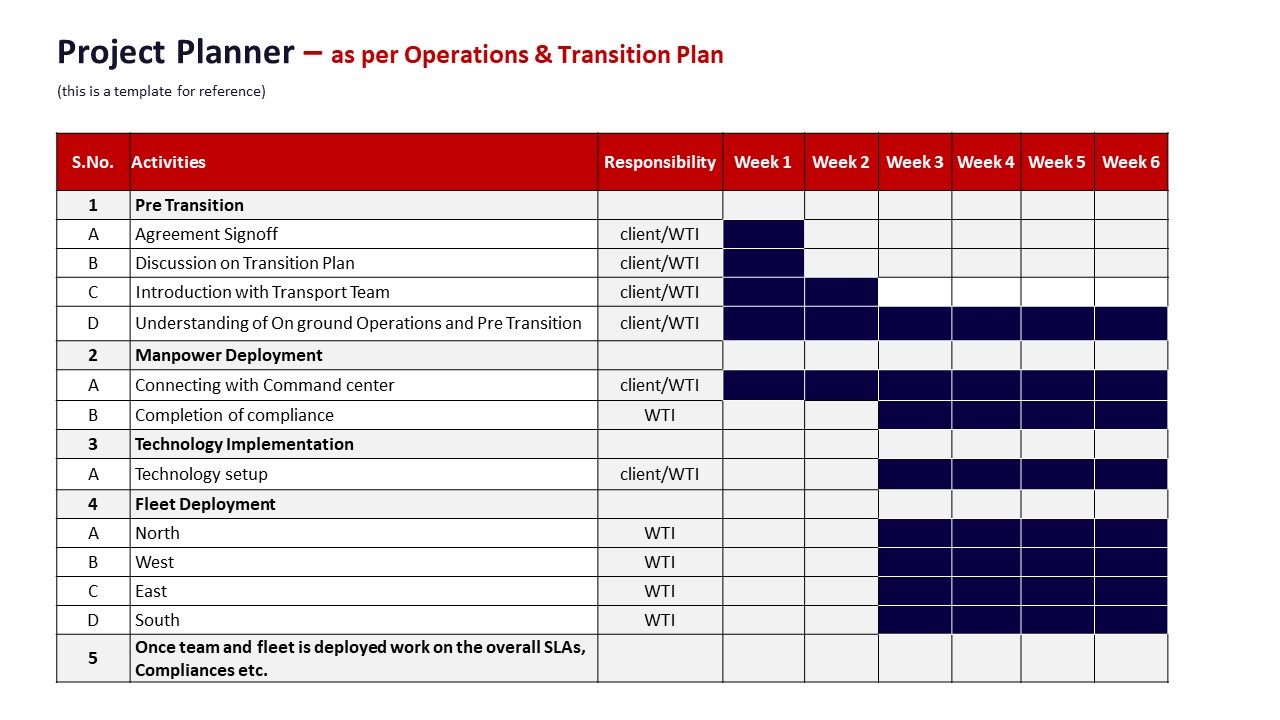
For Tier-2 event commute, how do we check if contingency routing is actually doable—alternate pickup points, approvals, and on-ground marshalling—not just a proposal slide?
B1414 Validate contingency routing execution — In India corporate ECS (project/event commute), how do we evaluate whether contingency routing in Tier-2 cities is genuinely executable—alternate pickup points, permissions, and on-ground marshalling—or just a slide in a proposal?
In India Tier-2 ECS operations, contingency routing is genuinely executable when an operator can show pre-agreed local SOPs, mapped alternates, and tested marshalling workflows that link into a 24x7 command center, not just generic “BCP” slides. Real contingency capability is evidenced by documented playbooks, local partnerships, and prior execution in adverse conditions like strikes, weather events, or infrastructure failures.
A common failure mode is proposal-only BCP that relies on “will coordinate locally” without pre-mapped alternate pickup points, advance permissions, or a defined command-center escalation matrix. In practice, project / event commute services depend on rapid fleet mobilization, temporary routing, and on-ground control desks. These requirements expose whether an operator has real Tier-2 depth or just metro-centric processes.
Operational buyers should demand concrete proof that contingency routing is embedded into the target operating model. They should also verify that the same governance used for employee mobility services and project commute is applied in Tier-2 cities, including vendor aggregation, business continuity playbooks, and escalation matrices.
Signals that contingency routing is likely executable rather than cosmetic include:
- Named Tier-2 locations with pre-surveyed alternate pickup points and access roads documented in routing tools.
- City-specific business continuity plans that address political strikes, natural events, and technology failures with clear action owners.
- Evidence of a 24x7 command center or TCC that already manages incidents with geofencing, alert workflows, and on-ground supervision.
- Prior project or event commute case studies showing time-bound delivery under disruption, with metrics like on-time performance maintained.
- Defined coordination mechanisms with local authorities, business parks, or SEZs for permissions and traffic management.
- Structured marshalling SOPs specifying how buses, cabs, and crowds are handled at temporary sites, including roles, signage, and safety controls.
Without these artifacts and proofs, contingency routing in Tier-2 cities is usually a proposal artifact rather than an operational reality.
images:
In Tier-2 cities, how do we tell if a vendor can recover quickly when things go wrong—driver no-shows, vehicle breakdowns—and what recovery times are actually realistic?
B1421 Normal ops vs fast recovery — For India corporate EMS in Tier-2 cities, how do we distinguish between a vendor that can ‘operate normally’ versus one that can ‘recover fast’ when supply breaks (driver no-shows, vehicle breakdowns), and what recovery-time expectations are realistic?
For corporate EMS in Indian Tier-2 cities, a vendor that can “operate normally” keeps daily routes running when nothing unusual happens, while a vendor that can “recover fast” restores service within defined minutes when supply breaks such as driver no-shows or breakdowns occur. Fast-recovery vendors have visible buffers, codified business continuity plans, and a command-center playbook that turns breakdowns into managed delays instead of missed shifts.
A normal-operations vendor usually depends on fixed rosters, single suppliers, and manual coordination. This pattern works until a cab shortage, technology failure, political strike, or severe weather exposes the lack of backup vehicles, alternate vendors, or transition plans. In Tier-2 cities, fragmented supply and thinner fleets amplify this risk because standbys and replacements are naturally scarcer.
A fast-recovery vendor demonstrates a documented Business Continuity Plan with specific mitigation for cab shortages, natural disasters, political strikes, and technology failures. These vendors maintain buffer vehicles, associated business support, and clear escalation matrices through centralized and local command centers. They also run alert supervision systems for real-time tracking, geofence violations, and safety events, which shortens detection-to-response time.
Realistic recovery-time expectations in Tier-2 cities are tighter for first departures and more relaxed for mid-shift events. Many strong operators target about 98% on-time arrivals overall, supported by traffic trend analysis and coordination with local authorities. Within that, practical benchmarks are: - Driver no-show detected before shift: replace vehicle within 30–45 minutes for critical routes. - En‑route breakdown: arrange transfer or replacement so total delay at employee gate is typically under 45–60 minutes. - System or app outage: shift to defined manual or semi-manual SOPs within 15–30 minutes, with continued GPS and safety supervision through the command center.
Signs that a vendor is truly recovery-capable include pre-defined transition timelines, macro and project-level planners, multi-vendor and buffer strategies, and a tested business continuity plan that assigns named responsibilities rather than generic assurances.
What should a festival/surge playbook include for tier-2 cities—drivers, backups, rerouting, extra control-room coverage—and how can we test it before launch?
B1429 Festival surge playbook validation — In India corporate ground transportation for Employee Mobility Services (EMS), what ‘surge and festival season’ playbooks should exist at the tier-2 city level (driver availability, spares positioning, contingency routing, extended NOC coverage), and what’s a reasonable way to test them before go-live?
In Indian Employee Mobility Services for tier-2 cities, surge and festival-season playbooks need to be formal, shift-wise SOPs that front-run predictable stress points such as driver availability, route disruptors, and app or GPS instability. A practical playbook builds buffers into fleet, people, and routing, and then hard-tests these SOPs through controlled pilots, night drills, and data-backed simulations before the actual festival window.
A robust surge playbook in a tier-2 city usually starts with planning for driver capacity and fatigue. Transport heads should tag a buffer fleet and standby drivers against each shift window and each high-risk cluster. Driver duty cycles and rest periods need to be defined for peak days so that OTP is protected without breaching labour and safety norms. Driver retention levers such as temporary incentives, festival advances, and roster preferences directly reduce last-minute absenteeism during surge periods.
Contingency routing is a second essential layer. Operations teams should pre-map alternate routes for every critical cluster, factoring in religious processions, market congestion, and weather-related bottlenecks. Command center operations should maintain live visibility into route adherence and exception trends, using real-time analytics to trigger dynamic route recalibration and vendor rebalancing under stress.
The Network Operations Center (NOC) or command center needs its own extended-coverage SOP. This includes defined escalation matrices for night shifts, clear ownership of exception-detection SLAs, and explicit thresholds for when to invoke business continuity plans. Tier-2 cities benefit from a hub-and-spoke governance model in which a central 24x7 command center supports local control desks during festival peaks.
Testing these surge and festival playbooks before go-live works best with structured drills. Organizations can run controlled pilots on selected routes during smaller local events to measure on-time performance, incident response latency, and driver fatigue indicators. Command center teams can also simulate disruptions through tabletop exercises and dry-run scenarios that test escalation paths, routing engine behaviour, and manual override procedures.
A reasonable test approach typically includes three elements. The first element is a limited-scope live pilot over a few weeks on representative shifts and routes with defined KPIs for OTP, exception closure time, and Trip Adherence Rate. The second element is cross-functional simulations that involve Transport, Security, HR, and vendors, rehearsing emergency re-routing, driver shortfall, and app downtime cases. The third element is a post-pilot review that converts observed gaps into updated SOPs and route-level rules, backed by a clear decision on when to escalate to business continuity playbooks during the main surge season.
If normal routes break in a tier-2 city due to traffic, curfews, or strikes, how should we set up contingency routing, and what should we require from the vendor to make it work?
B1430 Contingency routing in tier-2 disruptions — In India shift-based employee transport (EMS), how do experienced transport heads structure contingency routing for tier-2 cities when traffic disruptions, curfews, or localized strikes break normal routes, and what should they demand from a mobility vendor to operationalize that plan?
In shift-based employee transport in Indian tier-2 cities, experienced transport heads pre-build a formal “disruption playbook” with alternate routes, backup capacity, and clear escalation paths, instead of improvising on the night of a curfew or strike. They combine pre-approved contingency route banks, temporary hub-and-spoke pickups, and buffer vehicles with a command-center–style alert and supervision layer so OTP and safety stay within SLA even when primary corridors fail.
They usually map 2–3 alternates for each critical route in advance. They validate each for vehicle access, safety hotspots, and escort feasibility for women night shifts. They set dead-mile caps and pre-agree which routes are allowed to deviate during curfew or police diversions. They pair this with a small standby fleet, pre-briefed drivers, and pre-defined shift-window changes that can be triggered if a disruption extends beyond a threshold.
A common failure mode is relying only on GPS apps and local driver knowledge without codified SOPs, which collapses when networks fail or drivers rotate. Another is not having a unified command view, which leads to each vendor solving locally and creating fragmented decisions, inconsistent safety standards, and billing disputes.
To actually operationalize this, transport heads should demand from any mobility vendor:
- 24x7 centralized command center capability with real-time alerts, geo-fence violations, and over-speeding flags, plus location-specific control desks for quick local decisions.
- A documented Business Continuity Plan and Contingency Plan that explicitly covers cab shortages, political strikes, technology failures, and natural disasters with named owners and response timelines.
- Dynamic routing and re-routing tools integrated with rosters, with the ability to switch routes manually if automation or networks fail, while preserving trip logs for audit.
- Pre-defined escalation matrix and SOPs for disruption days, including who approves route relaxations, shift-time changes, and emergency pickups, and how employees are informed.
- Driver and fleet onboarding that includes seasonal and specialized training (for events like monsoon, unrest, or night operations) and clear fatigue and safety protocols.
- Centralized compliance management to ensure only fully compliant vehicles and credentialed drivers are used on higher-risk contingency routes.
- Data-driven dashboards and indicative management reports that surface OTP, exception patterns, and incident closure times, so contingency performance can be reviewed and improved rather than staying ad hoc.
If these elements are in place and tested through drills, the transport head gains earlier alerts, fewer 2 a.m. surprises, and a defensible, repeatable way to keep shifts running even when tier-2 city conditions are volatile.
images:
For a tier-2 event commute, what questions confirm the surge capacity is real—supervisors on ground, staged backups, and rerouting plans—before we commit to strict timelines?
B1446 Tier-2 event surge capacity proof — In India project/event commute services (ECS), what should an events/operations lead ask to confirm that tier-2 surge capacity is real—on-ground supervisors per venue, spare staging, and contingency routing—before committing to a zero-tolerance timeline?
In India project/event commute services, an events or operations lead should probe for hard evidence of surge capacity by asking specific questions on on-ground staffing, spare fleet staging, and contingency routing, and then tying every answer back to prior execution, documented SOPs, and measurable SLAs. The focus should be on what is already in place, not what can be “arranged,” before accepting any zero-tolerance timeline.
To verify on-ground supervisors per venue, the lead should ask how many supervisors will be deployed per gate or cluster. The lead should ask for a supervisor org chart, shift-wise deployment plan, and their exact responsibilities for queue management, driver briefings, and incident escalation. The lead should insist on examples of dedicated project or event control desks and live coordination from past programs, such as the rapid EV adoption or project commute deployments shown in the “Rapid EV Adoption” and “Project & on-site commute Introduction” collaterals.
To validate spare staging, the lead should ask what percentage of buffer vehicles will be parked within a defined radius of each venue. The lead should ask where they will be physically staged and which Business Continuity Plan and “Guarantee for Uninterrupted Services by Management of COB” measures apply when there is a cab shortage or sudden overrun. The lead should request photos or maps from previous large events showing standby lines, plus the BCP slides that cover backup vendors and associated businesses.
To test contingency routing, the lead should ask for written playbooks and case studies describing how the vendor has handled monsoon, political strikes, or technology failures. The lead should insist on seeing the actual routing and dynamic optimization approach, incident alert supervision systems, and command center workflows that were used to maintain on-time arrivals in past high-disruption scenarios.
Concrete questions an events or operations lead can use include: 1) “Show the event-specific command center design, including escalation matrix, alert supervision, and who signs off on rerouting decisions during a live breach.” 2) “Share your Business Continuity Plan slides for cab shortages, natural disasters, political strikes, and app/GPS downtime, and map each scenario to our event days and venues.” 3) “Provide a detailed hour-by-hour deployment plan for fleet and supervisors, including buffer ratios, staging lots, and handover SOPs between shifts, validated by a prior event or project commute case study.” 4) “Walk through how your dashboards and data-driven insights will surface early warnings on crowding, delays, and vehicle gaps, and specify the SLA from alert to action for each type of deviation.”
These questions convert generic claims into verifiable operational guardrails. They also protect the events or operations lead from accepting a zero-tolerance timeline without proof that supervisors, spare fleet, and routing contingencies will actually exist on the ground when the event goes live.
proof, auditability, and operational reporting
Require verifiable evidence of Tier-2 capability—rosters, escalation logs, spare deployment, and post-incident RCA—to enable audits and repeatable processes.
What reference checks really matter for tier-2 coverage—like talking to ops managers in similar cities and shift timings—instead of generic case studies?
B1383 Reference checks for tier-2 reality — In India corporate Employee Mobility Services (EMS), what reference checks actually reduce risk for tier-2 coverage—like speaking to operations managers in similar cities and timebands—versus generic case studies that don’t reflect smaller-city realities?
In Indian Employee Mobility Services, the reference checks that reduce risk for tier‑2 coverage are direct, operations-focused validations in comparable cities and timebands, not polished case studies or generic NPS numbers. The most useful checks mirror the buyer’s exact constraints on shift windows, night safety, driver supply, and EV or ICE mix, and they involve speaking to the Facility / Transport Heads or HR Ops who “live the night shift,” not only CXOs.
The strongest pattern in EMS is that failures usually come from local supply, command-center responsiveness, and safety/compliance gaps rather than from the high-level “solution design.” Case studies tend to compress these details into a single success story, while real reference calls surface whether the vendor can actually hold OTP%, seat-fill, and safety compliance under monsoon traffic, festival weeks, and chronic driver churn in tier‑2 locations. Operations managers in similar cities can also validate whether promised command-center support, alert supervision, and escalation matrices really work at 2 a.m.
A practical reference-check approach uses three filters. First, match context by city tier, timeband (especially night shifts), and service mix (EMS vs blended EMS+CRD+ECS). Second, probe specific KPIs like on-time performance, incident rate, driver retention, and the quality of centralized command-center monitoring and BCP playbooks. Third, test governance by asking how often QBRs, route audits, and compliance checks actually happen and what changed after issues were raised. These targeted checks give a Facility / Transport Head more predictive comfort than any generic testimonial, especially when planning expansion into tier‑2 pools where supply, safety, and uptime are structurally more fragile.
For tier-2 incidents, how do we make sure evidence and accountability are clear—who logs what, what’s retained, and how actions are proven—especially when local supervision is thin?
B1386 Auditability of tier-2 incidents — In India corporate Employee Mobility Services (EMS), how should Internal Audit or Legal think about evidence and accountability in tier-2 incidents—who logs what, what’s retained, and how escalation actions are proven—when on-ground supervision is limited?
Internal Audit and Legal should treat tier-2 commute incidents as “mini-cases” with a standard, tech-backed evidence pack, instead of ad‑hoc explanations from the transport desk. Each actor in the trip lifecycle needs explicit logging responsibilities, a minimum retention period, and a verifiable escalation trail that works even when no supervisor is physically on-site.
Internal Audit and Legal teams gain control when incident evidence is anchored to the existing EMS trip lifecycle. The routing engine, driver app, rider app, and command center already generate GPS traces, manifests, OTP logs, and SOS alerts. A common failure mode is that these signals are not normalized into a structured incident record with timestamps, roles, and follow-up actions. Tier-2 events such as delays, no‑shows, minor altercations, or geo‑fence deviations need a defined category code in the command-center tooling, with mandatory fields for “who reported,” “time first detected,” “root-cause hypothesis,” and “closure status.”
Accountability becomes auditable when every role is assigned clear logging duties. Drivers should confirm trip start, deviations, and cancellations via the driver app. Employees should raise complaints, SOS, or feedback through the rider app rather than informal channels. The command center should convert every alert, call, or email into a ticket with a unique ID, linked to the trip ledger and escalation matrix. Transport or Facility Heads should approve or override key decisions such as route changes or vehicle substitutions through the system, not by offline instructions alone.
To make these records usable for audit and legal review, organizations should define a retention baseline that is consistent with DPDP and internal risk policies. Typical artefacts include GPS trails, app logs, trip OTP verification, voice or chat records with the command center, and copies of notifications sent to HR, Security, or line managers. These should be stored in a governed data lake or equivalent repository with role-based access and immutable audit trails. A common failure mode is losing chain-of-custody when logs are editable, scattered across vendor systems, or purged before the next ESG or safety audit cycle.
Tier-2 escalation proof should be tied to pre-approved SOPs and the integrated command framework. A clear escalation matrix must state when an incident moves from driver/agent handling to supervisor, then to HR, Security/EHS, or Legal. The command center should automatically stamp every escalation step with time, assignee, and action taken, including attempted calls and unread notifications. Internal Audit and Legal can then test a small sample of incidents each quarter to verify that the escalation path followed the documented SOP and that closure notes are consistent with trip data and employee feedback.
Practical guardrails that Internal Audit or Legal can mandate include: - A single incident/ticketing system linked to the EMS platform for all commute-related issues. - Mandatory incident categories and minimum fields for all tier-2 cases. - Defined log retention windows for travel telemetry and communication records. - Quarterly route adherence and incident closure audits, with exceptions highlighted to the Mobility Governance Board or equivalent body.
For tier-2 support, what social proof should we trust most—references in similar cities, proof from festival surges, or third-party audits—and how should it influence selection?
B1394 Most credible proof for tier-2 support — In India corporate Employee Mobility Services (EMS), what are the most credible forms of social proof for tier-2 support—named references in similar cities, performance proof during festival surges, or third-party audits—and how much should each influence vendor selection?
In Indian Employee Mobility Services, the most credible tier‑2 social proof comes from performance proof under stress conditions. Named references in similar cities and third‑party audits are also important, but they should be weighted differently in vendor selection. Most organizations get the best signal by combining all three, with more weight on stress-tested operational evidence than on generic credentials.
Performance proof during festival surges or disruptions gives the clearest view of real reliability. This type of proof shows how a vendor handled peak-load routing, driver availability, and on-time performance when roads, traffic, and attendance patterns were abnormal. It helps Facility and Transport Heads judge whether the vendor can protect OTP and safety during Diwali, monsoon disruption, or political events, when HR and leadership scrutiny is highest.
Named references in similar tier‑2 cities help validate contextual fit. These references indicate whether the vendor has actually run EMS in comparable labor markets, traffic patterns, and regulatory environments. They help Procurement and HR test claims about driver availability, night-shift safety practices, and command-center responsiveness in smaller or non-metro locations.
Third‑party audits and certifications give structured assurance on compliance and process, but they say less about day-to-day operational behavior. These audits support CFO, Procurement, IT, and Security comfort on governance, documentation, safety protocols, and data practices. They are strong signals for “floor” quality, but they do not guarantee performance under real-world surge or hybrid-work variability.
As a practical weighting in vendor selection for EMS in India: - Performance proof under stress conditions should carry the highest influence. - Named references in similar tier‑2 cities should be the next most influential. - Third‑party audits and certifications should act as necessary hygiene and tie-breakers, not the primary selection driver.
This mix reduces the risk of choosing a vendor that looks strong on paper but fails during night shifts, festival peaks, or weather disruptions.
What proof should we ask for to confirm Tier-2 spare vehicles are реально available—like maintenance records, past replacement dispatches, or standby contracts?
B1406 Prove spares availability — In India corporate ground transportation EMS, what operational evidence should we require to prove spares availability in Tier-2 cities (maintenance logs, replacement dispatch history, or standby contracts), so ‘backup vehicles’ are not just a promise that disappears during outages?
The most reliable proof of real spares and backup availability in Tier‑2 EMS ops is a combination of auditable maintenance history, documented standby capacity, and past outage behavior that is visible in dashboards and reports. Vendors should show how many spare vehicles and drivers are tagged per city, how quickly they were actually dispatched during breakdowns, and how this is governed through a command-center SOP and business continuity plan rather than informal promises.
For Tier‑2 cities, most organizations need hard evidence that ties “backup vehicles” to real assets, time stamps, and escalation rules. Vendors in this space already present Business Continuity Plans, buffer-vehicle strategies, and Rapid EV Adoption or Project Planner timelines that define transition and fleet deployment week by week. The same rigor is needed for spares. A central command centre view and single-window dashboard should show live fleet utilization, standby tags, and exception closures, so transport heads can verify that a defined buffer actually exists and is not double-counted.
Standby capacity also needs to be linked to compliance and driver readiness. Centralized Compliance Management and Fleet Compliance collaterals show that vehicles go through pre‑induction checks and that driver onboarding and training are structured. Backup vehicles are only meaningful if their documentation, inspections, and driver compliance are current, which should be visible in compliance dashboards and audit logs.
Outage handling and response time are critical operational signals. Business Continuity Plan assets describe mitigation during cab shortages, strikes, or tech failures, while Alert Supervision and Transport Command Centre materials show how alerts, geofencing breaches, and exceptions are processed. Vendors should therefore produce incident logs that correlate breakdowns with the time to dispatch a spare vehicle, plus BCP records that prove Tier‑2 coverage was maintained during disruptions. This allows facility heads to test whether the “buffer” consistently protected on‑time performance, especially in night shifts and peak windows.
When we call references, what should we ask about Tier-2 support—supervisors, backup vehicles, festival surge—so we hear the real story, not just metro performance?
B1412 Reference checks for Tier-2 reality — In India corporate EMS, what questions should we ask reference customers specifically about Tier-2 cities—like supervisor presence, spares, and festival surge—so we get ‘street truth’ rather than polished metro-city performance stories?
In India’s corporate EMS, transport heads get better “street truth” from Tier-2 reference calls by asking hyper-specific, operations-level questions on supervision, backup capacity, and surges rather than generic satisfaction queries. Each question should force the reference customer to describe an actual practice, metric, or incident, not just say “service is good.”
For supervisor and on-ground control, it is useful to ask who physically manages the shift in that Tier-2 city and during which hours that person is on-site or on-call. Managers should ask how many supervisors or pickup/drop coordinators the vendor deploys per X vehicles and how often they rotate or attrit in Tier-2. They should ask how issues are escalated after 10 p.m. and which location-specific command centre or transport command centre takes charge when something breaks. This aligns to the vendor’s stated command centre model and escalation matrix.
For spares, buffer fleet, and driver depth, transport heads should ask how many standby vehicles are committed per depot or per 10 running cabs in that city and how often those spares actually get used in a typical month. They should ask what happens when two vehicles fail at the same time and whether the vendor pulls cars from other projects, long-term rentals, or project commute pools to protect OTP. They should ask how quickly a replacement vehicle reaches the employee once breakdown is reported and what the last three breakdown cases in that city looked like end-to-end.
For festival, election, and monsoon surges, the questions should probe real contingency playbooks. It is useful to ask which specific festivals or local events have historically disrupted services in that city and what mitigation the vendor executed, including altered shift times, pooled routing, or additional buffers. Reference customers can be asked what OTP, employee satisfaction, and complaint volumes looked like during the last Diwali or major strike compared to a normal week. They should also be asked whether the vendor had a written business continuity plan specific to that city and if it was actually used during disruptions like floods or political strikes.
To avoid polished metro narratives, transport heads should always anchor questions to city names, time bands, and hard metrics. They can ask the reference customer to share Tier-2 specific OTP percentages, no-show rates, and driver attrition rates, as well as any instance where local compliance, women safety routing, or vehicle induction standards slipped outside metro hubs. Finally, asking, “What is the one thing that still keeps you awake in your Tier-2 locations?” often surfaces the most honest operational gaps.
How do we make sure the vendor isn’t just audit-compliant on paper but still failing day-to-day in Tier-2 cities because coverage and escalations are weak?
B1413 Avoid paper compliance, real failures — For India corporate EMS, how do we prevent a vendor from ‘passing audits’ with documentation while still failing operationally in Tier-2 cities due to thin partner density and weak escalation reach?
For India corporate EMS, organizations prevent vendors from “passing audits on paper” but failing operationally in Tier‑2 cities by tying compliance to live operational observability, outcome‑linked contracts, and command‑center based governance rather than static documents. Vendors are evaluated and governed on real OTP, safety, and escalation performance across locations, with tech and NOC data treated as the primary source of truth and paperwork only as supporting evidence.
A common failure mode is audit programs that focus only on document checks, periodic reviews, and policy sign‑offs. This fails when real operations in Tier‑2/Tier‑3 cities depend on thin local partner density, fragile driver supply, and weak on‑ground escalation. Vendors appear compliant through KYC files, SOPs, and training records but miss shift adherence, have cab shortages, and cannot respond at night because there is no regional hub, no buffer capacity, and no functioning escalation beyond the metro.
Stronger buyers treat EMS as governed operations with measurable outcomes, not a file‑based compliance exercise. They use centralized command‑center monitoring, real‑time alerts, and trip‑level data to see OTP, dead mileage, incident rates, and SLA breaches by city and timeband. Vendor governance frameworks assign performance tiers and rebalancing rules for low‑density cities, and business continuity plans codify buffers, substitute vendors, and escalation matrices. Commercial models index payouts to on‑time performance and closure SLAs, so a city with weak partner density cannot “hide” behind clean documentation if live KPIs or incident handling degrade.
For a Facility / Transport Head trying to protect Tier‑2 operations, practical guardrails include:
- Mandate city‑level OTP%, seat‑fill, and exception‑closure SLAs, not only global averages.
- Require a concrete partner‑density and buffer‑fleet plan for each Tier‑2 location, reviewed via a structured transition and project planner.
- Run periodic live drills from the command center and test the escalation matrix at night, documenting actual response times.
- Use centralized compliance management and vehicle/driver onboarding controls, but cross‑check these with real trip logs, GPS traces, and random route audits.
- Link vendor scorecards and renewal decisions to integrated NOC dashboards and indicative management reports, not self‑reported PPTs.
These mechanisms shift audits from “does the vendor have documents?” to “can the vendor reliably run Tier‑2 shifts under real‑world stress while staying safe, compliant, and on time.”
What proof can we ask for to confirm real tier-2 support—like supervisor rosters, escalation logs, and backup cab records—instead of trusting promises?
B1427 Proof of tier-2 support — In India enterprise employee transport (EMS), what specific proof should a buyer ask for to validate tier-2 operational support—such as supervisor rosters, escalation reach, spare tagging, and incident logs—without relying on vendor promises?
In Indian enterprise employee transport, buyers should demand concrete, auditable artefacts that prove tier‑2 operational support exists in daily practice, not just in sales decks. Buyers should focus on supervisor coverage, escalation clarity, spare capacity, and incident handling, and they should ask to see live or recent evidence rather than accepting static SOPs.
For supervisor rosters, buyers should request actual shift‑wise supervisor and control‑room rosters for the last 30–60 days, including names, designations, timebands, and locations. They should cross‑check these against the vendor’s documented team structure and “Daily Shift Wise Briefing” records to confirm that briefings, on‑ground presence, and 24/7 coverage are real and not nominal.
For escalation reach, buyers should insist on a written escalation matrix with named roles, contact details, and timebound SLAs, and they should test it with live escalation drills during evaluation. They should ask to see how this matrix is embedded into the vendor’s command‑center tools and “Alert Supervision System” workflows so that geofence violations, overspeeding, or SOS triggers create auditable tickets and not just phone calls.
For spare tagging and buffer vehicles, buyers should demand a documented Business Continuity Plan that specifies standby ratios, backup fleet sources, and actual deployment logs from recent disruptions. They should review “Business Continuity Plan” artefacts that show how additional vehicles and associated networks were activated during cab shortages, strikes, or natural events, with timestamps and closure details.
For incident logs and safety handling, buyers should review anonymized incident registers and SOS dashboards for the past 3–6 months, including trigger type, detection source, response time, and closure actions. They should ensure these link to centralized dashboards, “Safety & Security for Employees” controls, and women‑safety protocols, with clear evidence of alerts from IVMS/GPS, driver apps, and employee apps being captured and resolved through a defined workflow.
A practical validation checklist for tier‑2 operational support typically includes: - Recent supervisor and command‑center rosters with attendance or login proofs. - A live view of command‑center screens showing alerts, trip monitoring, and escalation queues. - Documented escalation matrices aligned with “TCC – Roles & Responsibilities” and tested via mock escalations. - BCP documents plus real event post‑mortems that show buffer fleet and partner support being used. - Sample management reports and dashboards (OTP, exceptions, compliance) that confirm continuous monitoring instead of episodic review.
By insisting on recent, verifiable artefacts from the command center, BCP plans, safety frameworks, and data‑driven insight dashboards, buyers can validate tier‑2 operational depth and response capability in EMS without depending on vendor assurances alone.
From an IT angle, how do we ensure tier-2 escalations are handled through proper alerts and workflows (and work even with poor network), so ops doesn’t fall back to WhatsApp during issues?
B1436 Tier-2 escalation tooling reliability — In India shift-based employee transport (EMS), how should an IT leader verify that tier-2 escalation reach is supported by reliable tooling (NOC alerts, escalation workflows, offline-first apps) so operations doesn’t revert to WhatsApp calls during outages?
In Indian shift-based employee transport, an IT leader should validate tier‑2 escalation reach by proving that NOC alerts, escalation workflows, and apps continue to work in real operating conditions, including outages, without relying on informal channels like WhatsApp. The verification focus should be on end‑to‑end behavior from incident detection to closure, plus observable evidence that transport teams are actually using the tooling instead of bypassing it.
IT leaders should first require a clear demonstration of the 24x7 command‑center stack. The stack should include real‑time monitoring dashboards, alert supervision for events like over‑speeding and geofence violation, and a defined escalation matrix that routes incidents from frontline staff to tier‑2 owners. A common failure mode is when vendors show dashboards but do not have a practical command‑center SOP or do not run genuine triage and escalation workflows during night shifts.
IT leaders should then insist on configuration proof for escalation workflows. The vendor should show mapped roles, timebound escalation steps, and ticketing behavior for events such as GPS failure, app downtime, or driver no‑show. Tooling should support automated ticket creation, status changes, and reminder alerts so that escalation timelines do not depend on manual follow‑up. IT should verify that escalation flows align with the organization’s own escalation matrix and business continuity plans.
Offline‑first behavior must be tested explicitly using controlled outage drills. IT should ask the vendor to simulate network loss and app unavailability during a test shift and show how drivers, employees, and the NOC can still capture trip states, SOS signals, and basic manifests. A robust system supports graceful degradation where critical safety and escalation data is cached and synchronized back to the platform once connectivity returns.
To prevent reversion to WhatsApp, IT leaders should examine adoption and evidence. This includes checking NOC logs, alert closure reports, and management dashboards that aggregate incident data, CO₂ reporting, and SLA compliance. It also includes verifying that command‑center micro‑processes, shift‑wise briefings, and safety protocols instruct teams to use the official alert supervision system and SOS workflows instead of ad‑hoc messaging.
IT should finally tie technical verification to governance and continuity artifacts. This includes reviewing business continuity plans, transport command‑center roles and responsibilities, and HSSE tools. It also includes validating that security, privacy, and compliance requirements are met alongside operational reliability so that escalation tooling remains defensible during audits and investigations.
If a tier-2 city failure happens—no cab, no backup, no one answers—what should the RCA include, and what evidence should the vendor share within 24 hours?
B1441 Tier-2 incident RCA expectations — In India Employee Mobility Services (EMS) for shift commute, what should a post-incident RCA look like when a tier-2 city failure occurs (no partner available, no spare deployed, escalation unanswered), and what evidence should the vendor be able to produce within 24 hours?
A robust post-incident RCA for a tier‑2 EMS failure must reconstruct the full trip lifecycle, pinpoint control breakdowns across partner, spare planning, and escalation, and produce auditable evidence for every decision and non‑decision within the shift window. The vendor should be able to provide time‑stamped operational, telematics, and communication records within 24 hours to satisfy HR, Transport, Security/EHS, Procurement, and Audit.
An effective RCA starts with a clear incident summary. The report should define who was affected, which shift and route were involved, the promised SLA (pick‑up window, escort or women‑safety conditions), and the exact failure pattern. The vendor should then map the event onto the ETS Operation Cycle or EMS operation cycle, showing at which specific steps the failure occurred, such as roster finalization, routing, vendor distribution, vehicle allocation, command center monitoring, or exception closure. The vendor’s command center materials on micro functioning and principle role of the command centre set a clear structure for this step.
The next section should identify root causes across capacity, governance, and technology. Capacity analysis should reference fleet induction and vendor & statutory compliance evidence to show whether the contracted vendor pool and buffer vehicles were actually available and compliant in that city. Governance analysis should check adherence to the escalation mechanism and matrix, the MSP governance structure with central and location command centres, and any business continuity plans relevant to vendor failure, political disruption, or resource shortage. Technology analysis should cover the mobility app, Commutr dashboards, alert supervision system, and transport command centre views to see if GPS, routing, alerting, or app downtime contributed to delayed detection.
Corrective and preventive actions should then be defined in operational terms rather than generic assurances. Corrective actions may include immediate service restoration plans, temporary rerouting, or emergency vendor substitution under the business continuity plan and guarantee for uninterrupted services. Preventive actions may include revising spare‑capacity buffers for tier‑2 locations, altering the vendor mix, tightening alert thresholds in the command centre, refining women‑safety protocols, or updating the indicative transition or project planner for that geography. Each action should have an owner, deadline, and explicit KPI linkage, such as OTP, SLA breach rate, or Trip Adherence Rate.
Within 24 hours, a credible vendor in this EMS context should be able to provide specific evidence artifacts. Trip and routing evidence should include trip logs from the Commutr or WTicabs Mobility App with timestamps for booking, roster lock, route generation, assignment, and cancellation, as well as command centre screenshots illustrating real‑time status, alerts, and interventions from the EV fleet or EMS dashboards. Driver, fleet, and vendor compliance evidence should include extracts from centralized compliance management and fleet compliance checks showing which vehicles and drivers were tagged for that city and shift, their compliance status, and any open non‑conformities. Capacity planning evidence should draw on vehicle deployment & quality assurance and management of on‑time service delivery materials to demonstrate planned fleet, buffer, and actual dispatch for that shift.
The vendor should also produce communication and escalation evidence. This includes the escalation mechanism & matrix, transport command centre logs, and alert supervision system records of alerts raised, calls placed to the primary partner, attempts to deploy spares, and escalations to higher levels, all with time stamps. User‑side evidence from employee, driver, and vendor apps should show notifications, SOS or complaint tickets from the SOS – control panel and employee app, user protocols & safety measures logs, and any ride cancellation or “no cab assigned” messages delivered to employees.
Safety and risk documentation is also critical. For night shifts or women employees, the vendor should show compliance against women‑centric safety protocols, employee safety procedures, and safety & security for employees, including whether female‑first, escort, and route‑approval policies were applied. If business continuity was invoked, the vendor should attach the relevant BCP sections, such as Business Continuity Plan and contingency/BCP documents, to show that predefined mitigation paths were activated or explain why they were not.
Finally, the RCA should end with a concise governance and follow‑up section. This should specify how the incident and RCA will flow into the vendor’s engagement model, account management & operational excellence model, and command‑center‑driven continuous improvement. It should define when the incident will be reviewed in QBRs or governance forums and how improvements will be audited using tech‑based measurable and auditable performance frameworks and indicative management reports. This ensures the RCA is not just a one‑off explanation but a traceable input into improving EMS reliability in tier‑2 operations.
What tier-2-specific reports should we insist on—coverage map, partner performance, supervisor availability, backup deployments, missed escalations—so we’re not surprised every week?
B1443 Tier-2 operational reporting requirements — In India Employee Mobility Services (EMS), what operational reporting should be required specifically for tier-2 cities (coverage map, partner performance, supervisor uptime, spares deployment rate, unanswered escalation count) so the transport head can stop being surprised every week?
In India Employee Mobility Services for tier‑2 cities, transport heads need a fixed, SOP-driven reporting pack that exposes coverage, partner performance, supervision gaps, and unresolved risks before they explode. Operational reporting must convert fragmented vendor and app data into a small set of daily and weekly reports that show where OTP, safety, and capacity are likely to break.
For tier‑2 locations, coverage reporting should show mapped routes, shift windows, and active vehicle tags for each site. Transport heads should see which pin-codes or villages have thin coverage, which routes routinely cross high-risk or congestion zones, and how many employees are beyond agreed coverage radius per shift.
Partner performance reporting should present OTP%, Trip Adherence Rate, No-Show Rate, Vehicle Utilization Index, and SLA breach rate for each vendor. Tier‑2 reports should also call out driver attrition and credentialing currency, because thin vendor benches magnify single-point failures.
Supervisor uptime reporting should track whether local on-ground supervisors or control-desk staff are actually online during critical bands. The report should log presence by shift, average response time to incidents, and gaps against agreed coverage hours, because missing supervisors turn minor issues into escalations.
Spares deployment rate should be measured as buffer vehicle readiness against planned trips per shift. The report should show standby ratio, actual utilization of spares, and how often standby shortfalls caused cancellations or delays. Tier‑2 cities often depend on fewer suppliers, so explicit visibility on buffers is a core resilience metric.
Unanswered escalation count should be tracked by shift, city, vendor, and category. The report must show median closure time, escalations breaching SLA, and repeated patterns by route or driver. This escalation view should align with the central command center logs and Business Continuity Plan playbooks so the transport head can intervene before patterns turn into reputational or safety incidents.
To make this operational reporting usable, most organizations standardize three bundles:
- Daily tier‑2 city snapshot for control-room use, focused on previous shift OTP, spare usage, supervisor uptime, and open escalations.
- Weekly partner and route performance summary highlighting systemic issues in coverage, vendor reliability, and safety/compliance deviations.
- Monthly risk and continuity review combining unanswered escalation trends, supervisor coverage gaps, and buffer shortfalls into a simple risk heatmap.
For tier-2 support, what reference checks really matter—like talking to similar companies in the same cities that rely on the vendor’s supervisors and backup fleet?
B1447 Tier-2 consensus safety reference checks — In India Employee Mobility Services (EMS), what reference checks matter most for ‘consensus safety’ in tier-2 support—like getting names of similar enterprises in the same city cluster that rely on the vendor’s on-ground supervisors and spares?
In India Employee Mobility Services, the most effective “consensus safety” reference checks focus on verifiable operational behavior in similar enterprises, in the same city cluster, under similar shift patterns. Facilities and transport heads usually prioritize references that prove on-ground supervisors, backup fleet, and business continuity actually work during disruptions, not just on paper.
The strongest references come from companies with comparable night-shift density, women commuters, and hybrid rosters in the same tier‑2 or adjoining cities. These references are most useful when they confirm that centralized command centers, alert supervision systems, and local location-specific control desks consistently manage geofence violations, SOS triggers, and monsoon or strike-related diversions with high on-time performance. Case studies showing 98% on-time arrivals in severe weather, or 98% on-time and 15% satisfaction uplift for women’s late-night shifts, are powerful because they demonstrate real-world safety and reliability outcomes.
Operations leaders also look for evidence of structured escalation matrices and business continuity plans that have been invoked in practice. References are most credible when they can speak concretely about how standby cars, buffer fleets, and associated local vendors were mobilized during cab shortages or technology failures, and how quickly issues were closed. Where a vendor already operates EV fleets and charging infrastructure in the same region, references that validate zero-downtime charging and reliable fleet uptime further strengthen consensus safety perception, especially when combined with centralized compliance management and driver vetting processes.
images:
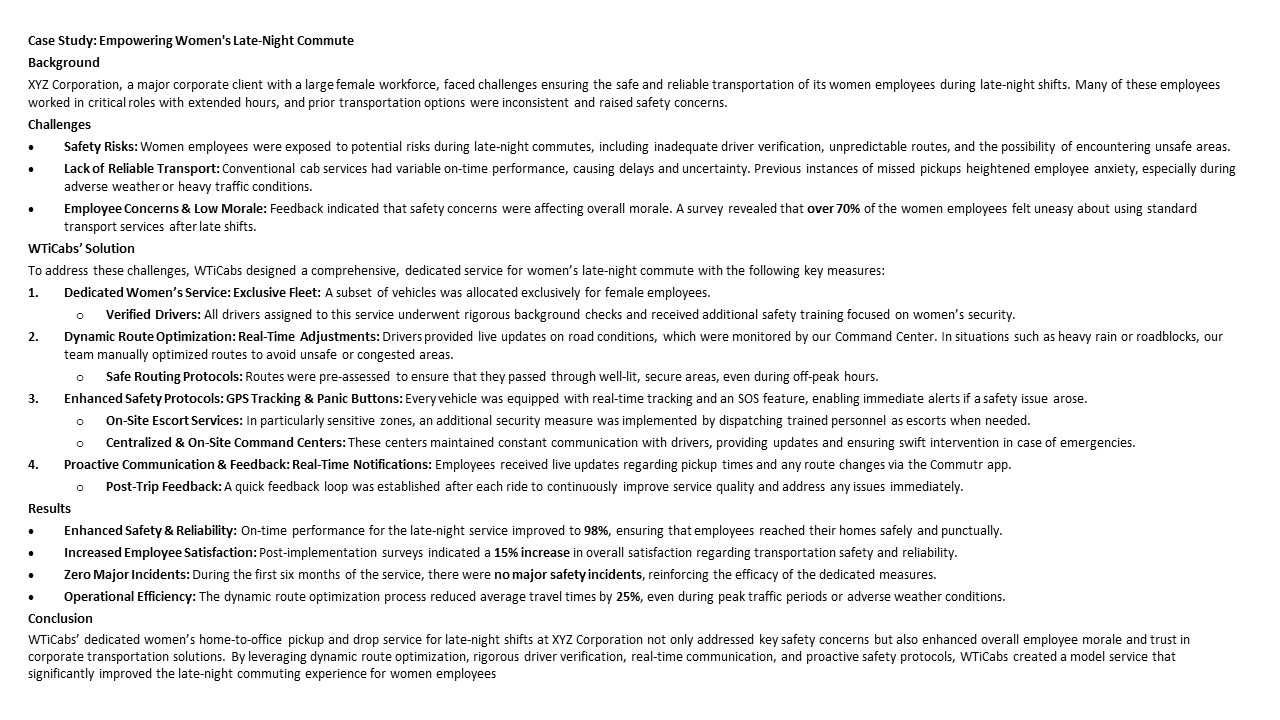
cost, risk, and stakeholder alignment
Balance cost with risk: justify Tier-2 resilience through governance levers, SLAs, and budget clarity so finance and operations align.
How should Finance think about the real cost impact of weak tier-2 support—shift delays, last-minute premium trips, and ongoing disputes—without doing a complex model?
B1376 Financial exposure of weak tier-2 support — In India corporate Employee Mobility Services (EMS), how should a CFO frame the financial exposure of weak tier-2 support—such as productivity loss from shift delays, ad-hoc last-minute vehicle premiums, and recurring dispute costs—without needing a full-blown modeling exercise?
A CFO can frame the financial exposure of weak tier‑2 support in EMS using simple, order‑of‑magnitude “rules of thumb” anchored to existing HR, transport, and finance data instead of a full model. The intent is to convert reliability gaps like shift delays, last‑minute premiums, and disputes into a small, defensible set of recurring cost buckets per month or per site.
The most practical approach is to treat poor vendor or tier‑2 performance as a hidden surcharge on Cost per Employee Trip and Cost per Kilometer rather than a separate abstraction. A CFO can start with current EMS spend and then layer indicative percentages or simple multipliers for three buckets. The first bucket is productivity loss from late pickups or missed shifts. The second bucket is ad‑hoc premiums paid for last‑minute vehicles when planned capacity fails. The third bucket is the internal cost of recurring disputes, reconciliations, and escalations.
For productivity loss, the CFO can approximate the number of delayed or missed trips from OTP% and no‑show reports. The CFO can then multiply those events by an average hourly cost per employee or per shift to show avoidable salary and productivity leakage. For ad‑hoc vehicle premiums, the CFO can compare last‑minute trip rates against contracted slabs and estimate the monthly delta as a percentage uplift on base EMS spend.
For dispute and reconciliation costs, the CFO can estimate how many person‑hours Finance, Procurement, and Operations spend each month on resolving billing mismatches, manual reconciliations, and vendor escalations. This can be multiplied by average fully loaded cost of those roles to derive a simple monthly overhead figure. When these three buckets are added back to the nominal EMS budget, the CFO can present a single headline number for “hidden cost of weak support” and express it as an approximate percentage of total EMS spend.
In practice, a CFO can communicate this exposure using a small set of indicative parameters rather than granular models. These parameters include current OTP% and no‑show trends, proportion of rides paid at premium or ad‑hoc rates, internal hours spent on disputes, and the share of EMS spend that is repeatedly touched by exception handling. This framing aligns directly with outcome‑linked procurement logic, because it ties weak operations to higher Cost per Employee Trip, lower reliability KPIs, and increased audit friction without requiring a detailed analytics project.
If HR wants stronger tier-2 coverage but Procurement is cost-focused, what contract levers (coverage SLAs, spares commitments, tier-2 adders) help avoid picking a cheap but fragile setup?
B1381 Balancing cost vs tier-2 resilience — In India corporate Employee Mobility Services (EMS), when HR pushes for wider tier-2 coverage to reduce complaints but Procurement pushes lowest cost, what contract and governance levers (like tier-2 service adders, coverage SLAs, or spares commitments) help avoid a ‘cheap but fragile’ outcome?
In Indian corporate Employee Mobility Services, “cheap but fragile” outcomes are usually avoided when wider tier‑2 coverage is treated as an explicit, priced service outcome in the contract, and not as an implicit free add‑on. Contracts that work separate base EMS rates from coverage, spares, and resilience levers, and then govern them through a central command‑center model and auditable SLAs.
A common failure mode is when RFPs benchmark only per‑km or per‑trip rates, while HR expects tier‑2 / fringe‑area coverage, night shifts, and women‑safety protocols at metro‑core pricing. Vendors then under‑provision fleet, avoid hard routes, or silently drop compliance to protect margins. This pattern drives missed pick‑ups, high exception noise in the command center, and escalation back to HR and the Facility / Transport Head.
Stronger structures define tier‑2 coverage explicitly in the EMS service catalog and SLAs. Contracts can specify which PIN codes or distance bands count as tier‑2, with guaranteed coverage windows and higher, pre‑agreed commercials for those zones. Buffer or “standby” vehicles can be mandated in high‑risk geographies through spares commitments, linked to minimum fleet uptime and on‑time performance KPIs, so Procurement buys resilience as a line item instead of expecting it for free.
Governance improves when a 24x7 centralized command center is contracted as part of the scope and not treated as overhead. The command center can run live routing, exception detection, and escalation workflows for tier‑2 routes, with commitment to specific exception‑to‑closure SLAs. These operational controls protect HR’s reliability expectations while giving Procurement measurable outcome levers such as OTP%, incident rates, and fleet uptime.
To balance HR’s tier‑2 coverage needs and Procurement’s cost discipline, organizations can use a few concrete levers in the MSA and SOW. Tier‑2 service adders define uplift factors or separate slabs for outer corridors, late‑night bands, or low‑density clusters, so coverage is viable without hidden shortcuts. Spares and business continuity commitments define buffer fleet ratios by city or cluster, backed by documented business continuity plans for cab shortages, political strikes, or weather disruptions.
Coverage SLAs can be split into metro‑core and tier‑2 bands, with separate OTP and “trip acceptance” thresholds, so non‑performance in difficult areas is visible and addressable. Outcome‑linked commercials can then tie a portion of vendor payouts to service quality in those bands, not just volume or distance, which aligns Procurement’s value metrics with HR’s reliability and safety priorities.
How can Finance and Operations agree on what we’re willing to pay for tier-2 resilience—supervisors, spares, surge buffers—so it’s not seen as waste but also not underfunded?
B1392 Funding tier-2 resilience without conflict — In India corporate Employee Mobility Services (EMS), what is a reasonable way for a CFO and Facilities head to agree on paying for tier-2 resilience (supervisors, spares, surge buffers) so Finance doesn’t see it as ‘overhead’ and Operations doesn’t feel set up to fail?
In Indian corporate Employee Mobility Services, CFO and Facilities heads align on tier‑2 resilience when buffers are treated as explicit, outcome‑linked capacity rather than vague “extra overhead.” A practical approach is to define, price, and govern supervisors, spare vehicles, and surge buffers as a separate resilience layer with clear triggers, KPIs, and reporting, instead of burying them inside base per‑km or per‑trip rates.
The resilience layer works best when its components are codified in the operating model and business continuity plan. Supervisors, standby vehicles, and surge capacity can be mapped to specific failure modes such as cab shortages, natural disasters, political strikes, and technology failures that are already described in documented Business Continuity Plans. Finance then sees this spend as controlled risk mitigation rather than uncontrolled operator padding.
A CFO gains comfort when resilience is tied to measurable outcomes like on‑time performance thresholds, incident rates, and continuity commitments. The organization can set explicit buffers such as dedicated standby cars, additional vehicles sourced via associated businesses, and rapid redeployment protocols, and then link part of the commercial construct to whether these buffers keep OTP and incident metrics within agreed bounds. This shifts the discussion from “why are we paying for extra vehicles and staff?” to “what level of uptime and continuity are we buying, and at what cost per avoided disruption?”
The Facilities or Transport Head achieves operational safety when resilience entitlements and SOPs are defined in advance. Standby vehicles, command‑center supervision, and escalation mechanisms can be documented along with roles and responsibilities, ensuring that at 2 a.m. the team is not improvising. This reduces personal burnout risk, clarifies who activates buffers under which conditions, and aligns expectations between operations and Finance.
A workable structure typically includes three elements. The base EMS rate covers normal rostered operations at agreed utilization levels. A clearly priced resilience package covers 24x7 command‑center oversight, supervisor staffing, defined standby fleet, and pre‑agreed surge rules. An outcome‑linked governance layer tracks KPIs and conducts periodic reviews, so that resilience levels or commercials are adjusted based on actual incident data rather than perceptions.
How can we put a clear rupee cost on weak Tier-2 support—missed shifts, overtime, escalations—so Finance sees why better coverage matters?
B1405 Cost of weak escalation reach — For India corporate EMS with smaller-city sites, how do we quantify the business cost of weak Tier-2 escalation reach (missed shifts, overtime, and leadership escalations) so Finance understands why coverage investments are not ‘nice to have’?
For Indian corporate EMS in Tier-2 cities, weak escalation reach creates a direct, quantifiable P&L drain through missed shifts, premium recoveries, and management time. The simplest way to convince Finance is to express every failure as cost per incident and then annualize it across sites, using metrics they already track such as cost per employee trip, overtime premiums, and leadership time value.
The starting point is missed or delayed shifts. Each no-show or late login typically triggers either overtime for previous-shift staff, idle time for downstream teams, or paid downtime for the affected employee. This can be converted into a per-incident rupee cost using standard hourly salary plus any night or critical process premiums. In Tier-2 locations with thinner bench strength, a single missed cab in Employee Mobility Services often disrupts a full work cell, so the cost multiplier per incident is higher than in metro sites.
Escalation gaps also show up as hidden administrative overtime. When Transport or HR teams manually firefight with vendors and drivers during breakdowns, that time comes from salaried staff whose cost is fully visible to Finance. Hours spent on repeated manual rostering, troubleshooting GPS failures, or resolving billing disputes attributable to poor escalation readiness can be quantified as an internal operations cost and attached to those same incidents.
Leadership escalations add another layer of measurable impact. Every time a transport failure in a Tier-2 site reaches senior managers, there is a predictable block of meeting time, mail trails, and remedial reviews that displace higher-value work. Finance can assign a blended hourly rate for senior leaders and apply it to the average number of escalation calls or reviews per month linked to EMS reliability in those locations.
Once these three components are framed as line items, the case for escalation coverage becomes a comparison between current failure cost and the spend required for better Tier-2 command-center reach. The cost of extending centralized NOC coverage, strengthening business continuity plans, or adding a local command hub can then be benchmarked against avoided overtime, fewer missed shifts, and reduced leadership intervention, positioning coverage as a risk-control and cost-containment measure rather than a discretionary “nice to have.”
How do we balance HR’s safety expectations with Procurement’s cost targets when Tier-2 reliability needs supervisors and spare vehicles that add cost?
B1408 HR–Procurement conflict on overhead — In India corporate EMS, how do we align HR’s demand for zero-incident readiness with Procurement’s cost targets when Tier-2 coverage requires on-ground supervisors and spare capacity that vendors will price as ‘non-productive overhead’?
Aligning HR’s zero-incident readiness with Procurement’s cost targets in Tier‑2 EMS requires treating on‑ground supervision and spare capacity as explicitly contracted risk controls with defined outcomes, not as vague “overheads.” The controls need clear scope, measurable KPIs, and ring‑fenced commercials tied to safety, OTP, and continuity outcomes that both HR and Procurement can defend.
In practice, HR’s risk posture in Tier‑2 is driven by night‑shift women‑safety protocols, incident readiness, and command‑center visibility. The context requires buffer vehicles, dedicated on‑ground supervisors, and a functioning business continuity playbook covering cab shortages, political strikes, natural disasters, and tech failures, as described in the Business Continuity Plan and Transport Command Centre collateral. These elements are what keep a 98%+ on‑time arrival rate and zero‑incident posture realistic rather than aspirational.
Procurement can align with this if the “overheads” are decomposed into named service elements with outcomes and price tags. Examples include a defined standby fleet buffer, site-specific command or control desks, and alert supervision systems with geofence and overspeed alerts. Each element can carry KPIs such as OTP%, incident response time, and escalation closure, supported by tech-based measurable and auditable performance dashboards and indicative management reports.
A workable approach is to structure a two-part commercial model. The first part is the core per‑trip or per‑km EMS pricing with utilization and seat‑fill expectations. The second is a clearly scoped risk and safety layer that includes Tier‑2 command‑center coverage, spare capacity, and BCP readiness, priced as a fixed monthly retainer or outcome‑linked fee. Procurement can then benchmark and negotiate this layer using standard EMS KPIs, while HR can defend it as the minimum spend required to maintain audit‑ready safety and continuity in more fragile Tier‑2 environments.
images:
How do we choose the right buffer for Tier-2 operations—extra vehicles/drivers—so service stays stable, but Finance doesn’t see it as easy cost to cut later?
B1415 Right-size Tier-2 coverage buffer — For India corporate EMS across Tier-2 sites, how do we decide the right ‘coverage buffer’ (extra vehicles/drivers) to buy so operations are stable, without creating a visible cost target that Finance will cut at the first budget review?
For Tier-2 EMS operations in India, the most durable way to set “coverage buffer” is to tie extra vehicles and drivers to observable risk and reliability metrics, not to a fixed percentage or arbitrary headcount. Coverage that is expressed as a quantified risk-control (for OTP, safety, and continuity) is far harder for Finance to cut than a generic “extra fleet” line item.
A common failure mode is treating buffer as a static number of standby cabs. Static buffers are easy to spot in budgets and are usually questioned at the first cost review. Buffer that is dynamically linked to shift windows, OTP performance, driver fatigue norms, and Tier-2 incident history is easier to defend because it is operationally explainable and auditable.
Coverage should be planned at the shift-window plus geography level. Tier-2 sites often have thinner vendor bases, weaker spot-market supply, and more infrastructure constraints, so the cost of a missed shift is materially higher. In such environments, buffer should be indexed to:
• recent OTP% and exception trends for each timeband
• driver availability and attrition patterns
• minimum compliance for rest periods and duty cycles
• local disruption frequency (weather, political events, road conditions).
To keep Finance comfortable, organizations should frame buffer as a governed capacity envelope rather than named standby assets. Procurement and Transport teams can define rules such as “X% seats above average demand in night windows until OTP is consistently >98%” or “Y spare drivers per Z active vehicles to maintain rest-cycle compliance,” then review these rules in quarterly governance meetings. This shifts the conversation from “why are we paying for idle cabs?” to “what level of buffer is required to keep risk within agreed thresholds?”
Over time, data from command-center operations, vendor performance, and route-level utilization can be used to fine-tune this envelope and to demonstrate where buffer can safely be reduced without compromising stability or safety in Tier-2 EMS operations.
As Finance, how can we challenge the claim that better Tier-2 coverage will ‘save money’ when it usually adds upfront cost for supervisors and spare vehicles?
B1420 Finance challenge to coverage ROI — In India corporate EMS, what’s the most defensible way for a CFO to challenge claims that improved Tier-2 coverage will reduce cost—when better coverage usually means paying for supervisors and spares upfront?
A CFO can most defensibly challenge “Tier‑2 coverage reduces cost” claims by forcing vendors to translate coverage promises into unit-economics, utilization, and outcome-linked KPIs instead of headcount or fleet counts. The CFO’s core stance is that better coverage is only value-positive if it improves on-time performance and utilization enough to offset the fixed cost of supervisors, spares, and fragmented operations.
A hard-nosed challenge starts by reframing the discussion around Cost per Employee Trip and Cost per Kilometer. The CFO can insist that any Tier‑2 expansion model show how Vehicle Utilization Index, Trip Fill Ratio, and dead mileage will change once local supervisors and standby vehicles are added. If local management only adds fixed cost without raising seat-fill or reducing exceptions and cancellations, then improved coverage is just a more expensive way to deliver the same or worse economics.
The CFO should also demand outcome-linked commercial structures for Tier‑2 EMS rather than flat retainers. Payment can be indexed to on-time performance, exception-closure time, and SLA breach rate, with clear baselines and earnback mechanisms. This forces vendors to put their margin at risk and proves whether Tier‑2 coverage is operationally efficient or just commercially padded.
A practical challenge frame is:
- “Show me a before/after model of CET, CPK, and dead mileage for Tier‑2 including your proposed supervisors and spares.”
- “Commit to outcome-based commercials where part of your fee is tied to OTP%, Trip Adherence Rate, and no-show/exception trends in Tier‑2.”
- “Prove that your command-center model, routing engine, and vendor governance actually reduce fragmentation instead of creating multiple small, underutilized pools.”
How do we measure tier-2 ‘coverage risk’ in a simple way—like partner concentration and backup ratio—so we can explain it clearly to HR and Finance?
B1426 Quantifying tier-2 coverage risk — In India Employee Mobility Services (EMS) for shift-based employee transport, how can an operations leader quantify the ‘coverage risk’ for smaller cities (e.g., partner concentration, supervisor-to-vehicle ratio, spares-to-demand ratio) in a way that’s simple enough to explain to the CHRO and CFO?
Coverage risk in smaller cities can be quantified as a small set of simple ratios that describe how thin or fragile the operation is. Each ratio should have a clear threshold, a current value, and an implied failure mode that a CHRO or CFO can understand without operational detail. A practical approach is to define 3–5 “coverage levers” and express them as per‑X ratios for vehicles, trips, or employees.
An operations leader can start with vendor concentration and supervisor coverage. Vendor concentration can be expressed as the share of active capacity controlled by the top one or two partners. A high share indicates single‑point dependency in that city. Supervisor coverage can be expressed as a supervisor‑to‑vehicle or supervisor‑to‑trip ratio per shift. A high ratio indicates that one incident can distract the only supervisor and delay responses elsewhere.
The next levers relate to buffer and resilience. A spares‑to‑demand ratio across shifts shows how much buffer fleet is available against peak rostered demand. Any time this ratio is below a defined minimum, the risk of no‑shows and escalations increases. A multi‑vendor presence count indicates how many independently governed suppliers are actually operating in that city. A low count reduces substitution options when one vendor faces a driver shortage, political strike, or technology failure, which are all captured in continuity plans in the collateral.
To keep this simple in leadership reviews, the operations leader can present a small coverage‑risk scorecard per city. That scorecard can aggregate ratios into traffic‑light bands and link each band to clear outcomes in terms of on‑time performance, business continuity posture, and incident escalation exposure. This framing aligns with how centralized command centres, business continuity plans, and vendor governance models are already described in the existing material, so it is intuitive for CHRO and CFO stakeholders to absorb and act on.
How should Finance think about the real cost risk of weak tier-2 coverage—missed pickups, ad-hoc premium cabs, penalties, and audit issues—even if the per-trip rate is low?
B1434 CFO view of tier-2 exposure — In India corporate ground transportation (EMS/CRD), how should a CFO evaluate the financial exposure of weak tier-2 coverage—such as productivity loss from missed pickups, penalty payouts, ad-hoc vendor premiums, and audit noise—even if the base per-trip price looks cheaper?
In India corporate ground transportation, a CFO should evaluate weak tier‑2 coverage as a composite financial risk exposure, not just a lower per‑trip tariff. The correct lens is total cost of mobility reliability, including productivity loss, penalty leakage, ad‑hoc premiums, and audit effort linked to missed pickups and inconsistent service performance in those markets.
Weak tier‑2 coverage typically shows up as poor On‑Time Performance and higher exception rates. This drives late logins, partial shifts, and rescheduling. Finance teams can translate this into a cost per hour of lost productivity and compare it against the perceived saving on base fare. In Employee Mobility Services, repeated delays increase noise for HR, Transport, and managers, which adds hidden coordination labour that is rarely budgeted but is real.
Service gaps in tier‑2 cities also tend to trigger last‑minute ad‑hoc vendor usage and surge‑style premiums. These trips often fall outside standard governance, creating fragmented invoices, higher per‑km rates, and weaker Service Level Agreement enforcement. The CFO should compare the unit economics of these exceptions against a stronger, operation‑backed provider that can mobilize vehicles quickly and maintain uptime targets across locations.
From a governance perspective, inconsistent tier‑2 performance drives penalty disputes, credit notes, and heavier reconciliation cycles. This increases audit noise and time spent defending numbers to Internal Audit and external auditors. In a regulated Indian context with SLA‑linked payouts and ESG or EV disclosures, fragmented operations also create data quality risks for trip logs, carbon reporting, and billing integrity.
A practical approach for a CFO is to build a reliability‑adjusted cost model with four explicit components: • Direct tariff and minimum charges. • Exception and ad‑hoc premiums for missed or delayed trips. • Productivity and overtime impact from late starts or extended shifts. • Audit and reconciliation effort arising from disputes and fragmented data.
Most organizations find that once these elements are quantified across EMS and Corporate Car Rental, the apparent savings from a cheaper but weak tier‑2 operator are outweighed by the total cost of unreliability, especially when decisions are scrutinized against audit standards and board‑level expectations for predictable, governed mobility spend.
How do we decide if it’s worth paying for stronger tier-2 on-ground supervision versus living with more penalties and employee complaints, when HR and Finance are pushing different priorities?
B1442 Trade-off: tier-2 supervision vs cost — In India corporate employee transport (EMS), how should leadership decide whether to invest in stronger tier-2 on-ground supervision versus accepting higher penalties and employee dissatisfaction—especially when HR wants safety and Finance wants cost control?
Leadership should prioritize stronger tier‑2 on-ground supervision when employee mobility is safety‑critical, shift‑driven, and reputationally sensitive, because controlled reliability and incident prevention are almost always cheaper and safer than recurring penalties, attrition, and fire‑fighting. Accepting higher penalties and dissatisfaction only makes sense for low‑criticality routes with limited night operations, low ESG scrutiny, and easy vendor substitution.
In Indian EMS, penalties are usually a lagging indicator. They signal broken rostering, weak driver management, and command center gaps rather than a clean “cost of doing business.” Frequent penalties correlate with poor On‑Time Performance, higher no‑show rates, stress on drivers, and a rising incident risk, which HR and EHS eventually need to defend. Most organizations treat women’s night‑shift safety, escort compliance, and zero‑incident posture as non‑negotiables, which pushes decisions toward more supervision, structured escalation matrices, and 24x7 NOC‑style control.
Stronger tier‑2 supervision improves early‑warning signals. It stabilizes routing, manages driver fatigue, and enforces compliance by design. That reduces exception-handling overhead for Transport Heads and limits exposure for CHROs and Security leads. Finance gains from fewer disputes, cleaner SLA linkage, and predictable cost per trip instead of volatile penalty write‑offs.
A practical decision rule is to segment EMS operations by risk and value. High‑risk corridors, heavy night operations, and locations with prior incidents warrant investment in tier‑2 supervision, command‑center observability, and structured BCP playbooks. Lower‑risk, day‑time, low‑volume pockets can run with lighter oversight and standard penalty regimes, provided OTP, safety, and employee feedback stay within agreed thresholds over multiple review cycles.
images: